This post is number 12 in a series about ocean acidification. Other posts: Introduction, 1, 2, 3, 4, 5, 6, 7, 8, 9, 10, 11, 12, 13, 14, 15, 16, 17, 18, Summary 1 of 2, Summary 2 of 2.
Welcome to the 12th post in our series about ocean acidification. Last post we asked about the ‘missing’ CO2 and the evidence for it being absorbed by the ocean. If the CO2 has been absorbed by the ocean then we would expect to have seen a decrease in ocean pH. Has this happened?
Anyone who has taken high school chemistry knows that measuring pH (post 4, the concentration of H3O+) is easy. Just pop in a pH electrode and read the number of the display. Right? Well, not quite.
To cut a long story short, a pH electrode is just one example of a whole class of electrodes – called ion selective electrodes (ISEs) – that indirectly measures concentration of H3O+ by measuring the potential difference between two electrodes. For simple solutions this difference is directly related to the concentration of ions in the solution between the electrodes. (You may recall this as the Nernst Equation). The trick (there's that word again) is in having a barrier that is selective for a given ion (e.g. H3O+) so that the electrode is only in contact with the ion of choice. However, no barrier is perfectly selective and seawater is not a simple solution. Other ions that are present in seawater – as well as carbonate species, which can interconvert (post 5) – interfere and make measurement of pH quite difficult.
Marine chemists have developed easier ways to measure the pH of seawater than the pH electrode. You may recall acid-base indicators from school. These are substances that change their colour as a function of pH. Red cabbage juice works quite well. The cabbage juice starts purple, turns red under acid conditions (e.g. if you add vinegar), and goes yellowy-green under basic conditions (e.g. if you add household ammonia or baking soda). Indicator dyes used by marine chemists are more sensitive, but operate on the sample principle. A spectrophotometer can then be used to measure subtle colour changes of the dye, giving more precise pH measurements than electrode-based systems.
But there is another way to measure pH – calculate it. There are 4 parameters to describe what chemists call the marine CO2 system:
We should be familiar now with 1, 3, and 4. The other parameter in the list is alkalinity. A definition of alkalinity is surprisingly complex, but an approximation is to say that it is not quite the opposite of 'acidity measured by pH' and is a way to quantify the difference between the things in solution that act as bases (i.e. accept H+) and the things that act as acids (i.e. donate H+) in addition to HCO3– and CO32–.
In the case of fresh water really only HCO3–, CO32–, OH– and H+ need be considered. In the case of seawater two additional groups of components are significant. Bases stronger than HCO3– (B(OH)4–, HPO42–, PO43–, and SiO(OH)3–) and acids stronger than H2CO3 (HSO4–, HF, and H3PO4). The utility of alkalinity is that it is straight forward to measure, even if we have no idea of concentration values for each of the contributing components.
If you have been paying close attention to these posts, you may be struck as how similar some of the items on the list of marine CO2 system parameters are. All these parameters are related through well-known equilibrium relationships. In fact if you know any 2 of the items on the list it is possible to calculate the other 2 parameters.
[clarification made 3 August in response to comment 1] For example, at most data collection buoys moored in the open ocean, pH and pCO2 are the most frequently measured parameters but if for some reason pH is not measured at a given time, then it is calculated from other parameters like alkalinity or dissolved inorganic carbon. For example, at some data collection buoys moored in the open ocean, it is easiest to have instruments that measure total dissolved inorganic carbon and the partial pressure of CO2. pH and alkalinity can then be calculated.
As we explained, pH electrodes are a proxy technique in any event. So, while pH at ocean moorings is not always measured directly with a pH electrode, the calculated values are nearly as accurate as measured values. (Slight discrepancies can arise because the equilibrium constants have uncertainties in what is essentially the 3rd decimal place).
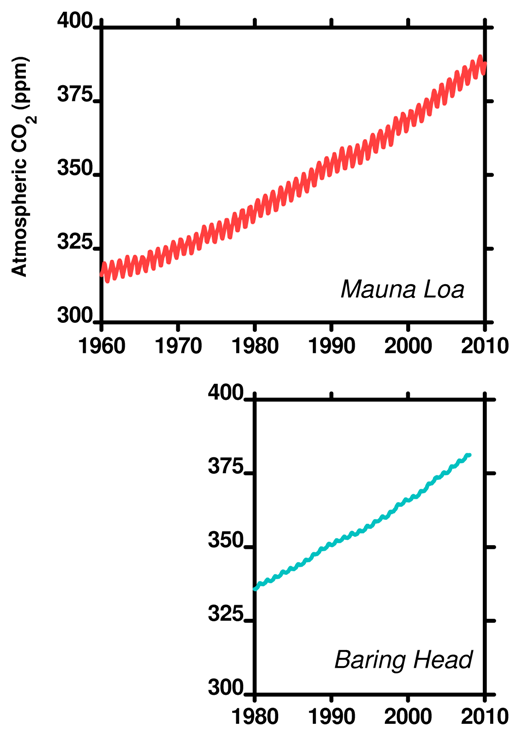
Number 4 in the list, the partial pressure or concentration of CO2 in the atmosphere, has been measured in many places for many years. There are seasonal changes as the amount of atmospheric CO2 changes as plants photosynthesize. Take a close look at this plot of data for CO2 from Mauna Loa and Baring Head (New Zealand). Both data sets available at CDIAC, the US government Carbon Dioxide Information Analysis Centre.

Figure 5. Atmospheric CO2 at Mauna Loa and Baring Head (to Dec 2007).
Both graph lines have regular oscillations each year – described by some as 'saw-toothing'. In the Northern Hemisphere spring, the plants grow new leaves, taking up CO2 and slightly decreasing the atmospheric CO2 level. In the winter, a lot of plants die off or drop their leaves over winter and CO2 increases as the leaves decay. The same effect occurs in the Southern Hemisphere – though offset by 6 months. The same principle also explains the saw-toothing in the oxygen plot we linked to in post 10).
However, the Northern hemisphere has a greater land mass and therefore more plants (especially at higher latitudes where the Southern Hemisphere is empty) so the oscillations are dominated by the Northern Hemisphere. These fluctuations alter the partial pressure of CO2 in the atmosphere and thus in the ocean on a seasonal basis.
Since pH is influenced by the partial pressure of CO2, the pH of seawater also shows seasonal fluctuations. There are seasonal fluctuations due to water temperature changes (see post 9 about Henry's Law). There are also small scale local changes induced when plankton (small ocean plants) take up CO2 from the water for photosynthesis. We have also discussed upwelling and downwelling hot spots as sources and sinks of CO2 on a local scale.
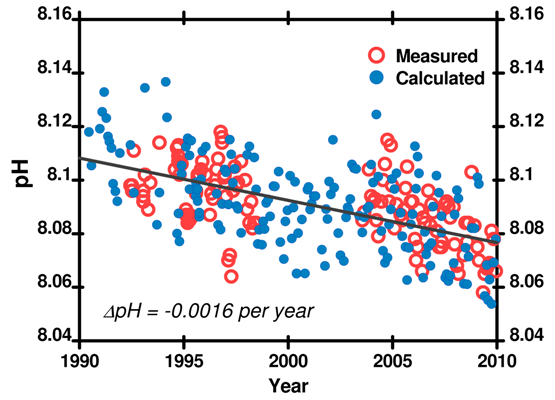
All these fluctuations in ocean pH are large compared to the expected annual changes attributable to increasing atmospheric CO2. Nevertheless, we have good quality data for many places. Though the rate of change is not smoothly even around the world, all the data agree: ocean pH is decreasing. The example below is from the Hawaii Ocean Time Series (HOTS) and covers 1989 – 2009. The drop in pH is 0.035 pH units in 20 years – an 8% change in the concentration of H3O+.

Figure 6. pH recorded at the Hawaii Ocean Time Series (HOTS) station. Note the good agreement between measured pH and pH calculated from other CO2 system parameters. Measured pH data and carbonate parameter data (used to calculate pH using SWCO2) here.
![]()
Next post is a little aside about different forms of calcium carbonate and why it matters.
Written by Doug Mackie, Christina McGraw, and Keith Hunter. This post is number 12 in a series about ocean acidification. Other posts: Introduction, 1, 2, 3, 4, 5, 6, 7, 8, 9, 10, 11, 12, 13, 14, 15, 16, 17, 18, Summary 1 of 2, Summary 2 of 2.
Posted by Doug Mackie on Monday, 1 August, 2011
 |
The Skeptical Science website by Skeptical Science is licensed under a Creative Commons Attribution 3.0 Unported License. |