


 Arguments
Software
Resources
Comments
The Consensus Project
Translations
About
Support
Arguments
Software
Resources
Comments
The Consensus Project
Translations
About
Support
![]()
![]()
![]()
![]()
![]()
![]()
![]()
![]()
![]()
![]()


![]()


Latest Posts
- Skeptical Science New Research for Week #21 2026
- What’s a ‘super El Niño’? And other El Niño questions, answered
- Fact brief - Does electromagnetic radiation from wind turbines pose a threat to human health?
- Five things you need to know about El Niño’s likely comeback
- 2026 SkS Weekly Climate Change & Global Warming News Roundup #20
- Skeptical Science New Research for Week #20 2026
- Higher warming predictions for 2026 and 2027
- A look back at ‘An Inconvenient Truth,’ 20 years later
- Two videos about the Atlantic Meriodonal Overturning Circulation (AMOC)
- 2026 SkS Weekly Climate Change & Global Warming News Roundup #19
- EGU2026 - Five days of virtual learning
- Skeptical Science New Research for Week #19 2026
- Climate Adam - Climate Change is Destroying Lives... Now
- EGU2026 - Presentation about the Skeptical Science Experiment
- Fact brief - Were the 2022 whale deaths off the US East Coast caused by offshore wind development?
- 2026 SkS Weekly Climate Change & Global Warming News Roundup #18
- Our new research is published - but we're not done yet with the 'Experiment'
- Skeptical Science New Research for Week #18 2026
- Wildfires used to ‘go to sleep’ at night. Climate change has them burning overtime
- Transition risk: The human cost of net zero
- How strong can a hurricane get in a warming world?
- 2026 SkS Weekly Climate Change & Global Warming News Roundup #17
- The really big picture, in four pictures
- Skeptical Science New Research for Week #17 2026
- EGU2026 - My plans for attending virtually
- Global warming is making the strongest hurricanes stronger
- As Cuba’s grid fails, solar power becomes a lifeline
- 2026 SkS Weekly Climate Change & Global Warming News Roundup #16
- Skeptical Science New Research for Week #16 2026
- Don’t panic: A field guide to the runaway greenhouse
Archived Rebuttal
This is the archived Advanced rebuttal to the climate myth "Arctic sea ice has recovered". Click here to view the latest rebuttal.
What the science says...
Arctic Ice: The Canary in the Coal Mine? Updated and revised post by Peter Hogarth
The dramatic downwards trend in the annual Summer extent of Arctic sea ice – contrasted with the marginal increase in Southern Winter Antarctic sea ice have both sparked intense debate and commentary in recent years. Many scientists specialising in Arctic studies have claimed that the summer sea ice could disappear completely before 2100. This conclusion is based on current trends in observational data and sophisticated modelling which shows that the steadily increasing annual global CO2 levels (Husler 2011) caused by fossil fuel emissions is enhancing our atmospheres natural greenhouse effect (Benestad 2011). This causes the atmosphere to be more opaque to Infra Red radiation emitted by our planet (Harries 2011), which in turn causes the average global surface temperatures to rise in order to maintain solar input/thermal output net energy equilibrium at the top of atmosphere (Pierrehumbert 2011). Measured data indicate that this temperature rise has been most significant in the polar regions over the past few decades, and modelling indicates this trend will continue. Data from historic sources covering the past century, plus ice cores and sea bed sediments spanning the past few hundred thousand years indicate this Arctic amplification is a characteristic climate response to changes in global energy balance.
However many commentators have been sceptical of this outlook, and have argued at various points over the past few years that the Arctic ice has been in the process of recovering after the extreme low Arctic Ice extent in late 2007, or that the data sets or models are flawed, or even that the Arctic is cooling, or that ice loss is purely part of a natural cycle. This has contributed to public confusion about anthropogenic climate change. What does the actual data from Arctic studies show? Here we look at publicly accessible data and information from sources such as the NSIDC (National Snow and Ice Data Centre), University of Bremen, Arctic ROOS (Regional Ocean Observing System), University of Illinois, JAXA (Japan Aerospace Exploration Agency), estimates from modelling, as well as multiple strands of independent evidence and relevant freely accessible peer reviewed scientific papers to see if these claims have any basis in reality.
The data available includes regional proxy data indicating conditions hundreds or even thousands of years ago, historic charts and vessel records, weather station data from the early 20th century onwards, expedition records, aerial photographic reconnaissance from the 1920s and 1930s and then early 1950s, declassified submarine data from the late 1950s and stereo imagery from spy satellites from the late 1960s, global data from scientific satellite missions carrying microwave sensors from the early 1970s, up to the latest advanced satellite borne sensors such as GRACE (Gravity Recovery and Climate Experiment) or the AMSR-E (Advanced Microwave Scanning Radiometer for EOS).
Viewed in a global context, the amounts of polar sea ice are relatively small compared with the massive total volumes of ice in the land based ice caps of Antarctica, Greenland, and the Himalayas. If we take into account the observations of recent accelerating total ice mass loss from these areas, (Zwally 2011, Schrama 2011, Bolch 2011), plus the combined increasing mass loss from the worlds glaciers, summarised in Pelto (2011)(also see Shahgedanova 2011, Leclercq 2011, Gardner 2011, Radic 2011 and even evidence from tropical glaciers Thompson 2011), it is evident that perennial ice loss is ongoing, global in extent, and currently following an accelerating trend (Pfeffer 2011). Although melt rates vary across the globe, the relatively thin layer of sea ice floating on the Arctic Ocean appears especially vulnerable, and the clear multi-decadal decline in summer ice extent has become one of the most compelling and widely discussed indicators of recent climate change. Coupled with the evidence of significant increases in average length of the ice melt season (Markus 2009, Perovich 2011, Agarwal 2011, Wang 2011) and mean ground permafrost temperatures in all Arctic regions rising towards critical thaw threshold over the past three decades (Quinton 2011, Romanovsky 2010), increasing melt rates across Greenland (Fettweiss 2011, Tedesco 2011), the entire Canadian Arctic (Fisher 2011, Sharp 2011), and Siberia (Okamoto 2011), it is apparent that the Arctic region is in a process of transition.
Temperature, or the thermal energy of the environment, is the main factor that governs seasonal melting and re-freezing of ice, and this is easily understood by the public. As heat is transferred to the ice as the environment (both atmosphere and Ocean) warms in the Summer, the thermal energy of the ice increases, resulting in temperature rise. As melting point is reached, the temperature of the ice stops rising and stays at melting point whilst large amounts of heat energy are transferred in order to melt the ice. This latent heat allows large amounts of thermal energy to be absorbed in Summer, constraining surface temperature rise whilst any ice remains. This is subsequently released in late Autumn when the ice re-freezes. In general the amount of Arctic sea ice can almost be regarded as a self calibrating proxy for regional temperature, but there are several inter-related dynamic and thermodynamic factors driving the high latitude weather patterns, currents, air and oceanic temperatures, and these would be expected to modulate the regional energy budget, and thus affect ice volume and extent (Stroeve 2011, Screen 2011). Evidence from Greenland Ice cores and sea bed sediments shows that after the most recent ice age, Arctic temperatures reached a maximum between 8.5 and 6 thousand years ago (the Holocene Thermal Maximum). Further evidence suggests this corresponded to a local sea ice minimum (Funder 2011), and since then the changing orbit and tilt of our planet have favoured a slow decline in long term average Northern Hemisphere temperatures, and corresponding increase in Arctic ice extent. Although this slow cooling trend has not been smooth or uniform (Miller 2010 there has been an abrupt and significant upwards turn in the Twentieth century, with the most recent 50 year period being the warmest for 2000 years in the composite proxy record. Atlantic waters entering the Arctic Ocean are now also warmer than at any time in the same period (Spielhagen 2011), whilst the entire Canadian Arctic is also experiencing the highest melt rates in 4000 years (Fisher 2011). Certainly, directly measured average air and surface temperatures over the Arctic have increased more than in any other region of the planet over at least the last fifty years (Wood 2010, Bekryaev 2010, Semenov 2010). Over this period the globally averaged heat content of the atmosphere (Peterson 2011), and more importantly the Oceans (von Schuckmann 2011, Hamon 2011), have significantly increased, but the Arctic is where this is expressed most dramatically as temperature rise. This Arctic Amplification (Serreze 2011) is a robust feature of all global temperature data sets (see figure 1 below), including satellite lower troposphere measurements using microwave, Surface Infra Red emission measurements from satellites, as well as radiosonde, weather station and buoy data.

Figure 1. Surface and lower tropospheric temperature anomaly trends by latitude bands calculated for past thirty years as well as past twenty years. Data courtesy of RSS, NASA and ECWMF, and also publicly accessible through the convenient KNMI climate explorer.
Figure 1 also gives easily understood evidence to help explain why the Arctic and Antarctic sea ice are responding differently to climate change. In all data sets and re-analyses the Polar Arctic shows the highest recent regional temperature increase, whilst the lowest surface and atmospheric temperature changes over this period correspond to the latitude band where Antarctic sea ice seasonally melts and re-freezes. However even here warming waters are affecting Ice shelf stability (Joughin 2011) and glacial flow rates, and we have seen considerable Antarctic ice shelf losses in recent years (Cook 2010).
The “extent” of sea ice (usually defined as area of the ocean covered by more than 15% of ice) is most commonly used when discussing changes in Arctic or Antarctic ice. Complete Polar Ice extent has been monitored by microwave sensors carried on satellites since 1973, with continuous overlapping data sets available from 1979 onwards. If we compare images of sea ice extent in the Northern and Southern hemispheres (from NSIDC), we see the Antarctic Winter sea ice grows unimpeded to cover a much larger extent than in the Arctic case, but in the melt season the receding ice is bound by the Antarctic continental coastline, leading to a smaller minimum sea ice extent than in the Arctic in Summer (at present). A large proportion of the Antarctic sea ice is first year ice, and is significantly thinner on average than the Arctic sea ice (NSIDC article). Unlike the Antarctic case, the growth of Arctic ice in the Winter is constrained by the land masses which almost completely surround the Arctic Ocean.
Figure 2 Animation of AMSR-E 89GHz brightness data from 2002 to 2009 showing detailed distribution of Arctic ice, patterns of ice loss, and effects of circulations on ice extent and ice break up, and diminishing ice extent over recent decade. Thanks and credit to Koji Shimada (and also Eddy Carmack).
If we look at the series of animations in figure 2, we see the that during the freezing season sea ice extent in any given year grows from the summer minimum until it butts up against the coastline. The ice edge can only move further South by advancing through the relatively narrow channels leading from the Arctic Ocean, such as the Fram and Bering straits. For the Arctic, there are records of the annually advancing and receding ice edge on charts going back to the beginning of the 20th Century, and some from even earlier (Walsh 1978, Mahoney 2008, Vinje 2003). It is possible to reconcile the ice chart and aerial reconnaissance data with satellite data processed for ice edge, despite technical difficulties and several different algorithms and definitions (Comiso 2008, Comiso 2009, Spreen 2008, Anderson 2007). There are enough recent overlapping independent data series to attempt to resolve these differences and develop long term climate records with quantifiable errors (Walsh and Chapman 2001, Rayner 2003, Bronnimann 2008, Cavalieri 2003, Scott and Meier 2010).
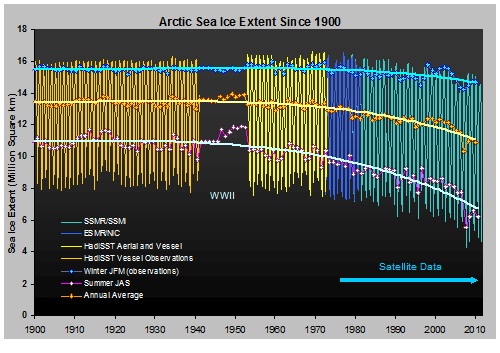
Figure 3. Long term seasonal trends in Arctic Ice extent. The trend lines are fitted to historical Summer and Winter three month mean values as well as the annual mean (Walsh and Chapman 2001). HadISST from 1900 to 1944 is interpolated (model) data fitted to observations, and uncertainties are larger.
Looking at the long term trend of Arctic ice extent using satellite data back to 1973, combined with aerial reconnaissance data back to the 1950s, and linking them as best we can by using charts and historical observations going back to the late 19th Century, we see a significant downwards trend, though shorter term, decadal (and regional) variations are apparent. We also see that the interannual variations are relatively small compared with the seasonal variation between September minimums and March maximums.
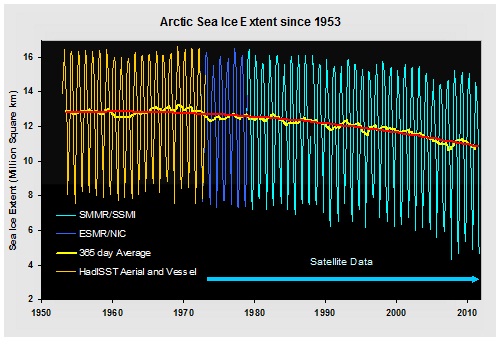
Figure 4. Higher resolution seasonal data and annual average values with trend from 1953 onwards, when more accurate reconnaissance data with higher spatial coverage became available.
Looking at figure 4, we see that in 2007, there was a dramatic decrease in summer Arctic sea ice extent to a new “record” minimum. By this time the summer extent had diminished to around 40% of the 1979 to 2000 average. The amplitude of the swing between summer and winter extents has also increased, partially as a result of the increasing proportion of young ice forming in winter and more rapidly melting in summer in the warming Arctic environment (Goosse 2009).
It can be seen that in 2008 and 2009, the summer ice extent had increased somewhat from the very low 2007 value, prompting suggestions of “recovery”. However the 2010 minimum was lower than in 2009, whilst the 2011 minimum extent appears to be very close to the 2007 level on all publicly available data sets, and is certainly below 2008, 2009 and 2010 minimum levels. Indeed the University of Bremen team (using an independent processing algorithm based on high resolution AMSR-E data) announced that on September 8th 2011 the Arctic Sea Ice extent had dropped below the 2007 value, setting a new record minimum. Looking at figure 4, we see that despite several periods of temporary multi-year increase in the past, the average long term multi-decadal decline is accelerating (Comiso 2008) and the five lowest summer ice extent values on record have been in the past five years. It seems unlikely that this downwards trend will reverse in the foreseeable future. Are these extreme minimums purely a feature of anomalously warm summer months, or are the downward trends evident through the rest of the annual cycle? Let us zoom in further.
Figure 5. Animation of annual trends over the SSMR and SSMI satellite sensor period, month by month. Trends for all months through the year are significantly negative. Data courtesy of NSIDC.
With the benefit of hindsight and four more years worth of data it is possible to view the 2007 decrease in ice extent as a short term variation away from the longer term downward trend (similar to the “dips” in 1990 or 1995). Interannual variations in wind, currents or cloud cover can superimpose variations on the overall decreasing trend in ice extent due to average background warming. This measured trend is below some IPCC AR4 model predictions (Stroeve 2007), though recent refinements to climate modeling work has resulted in closer agreement (Massonnet 2011) and it now seems clear that an imminent dramatic change in this trend or “tipping point” is unlikely, at least in the Arctic (Nghiem 2011, Tietsche 2011, Moon 2011, Ridley 2011). It has been shown that the September ice extent has been approximately in equilibrium with climate forcing over the entire satellite record (Armour 2011), and though this implies recovery is possible if the warming did reverse, models still suggest a substantially Ice free Arctic before 2100 if current trends in CO2 emissions continue (Wang 2009, Boé 2009, Zhang 2010, Bader 2011, Koenigk 2011).
When considering whether sea ice is recovering or not, it is also important to monitor changes in the amount of arctic ice surviving from one year to the next. Satellite radar backscatter (QuikSCAT) data can detect textural differences between new first year and older ice (see below). We can also track ice movement and longer term survival through successive melt seasons using satellite data and buoys and cross check this with airborne data records, allowing maps of the age and transport of Arctic ice to be created.
Figure 6. Animation of QuikSCAT 13GHz RADAR Scatterometer data clearly showing build up of new first year ice and areas of older ice, and the changes in overall extent and reductions in older ice from 2000-2009. Credit for images David Long, Brigham Young University, JPL NASA.
As ice that survives the melt season tends to accumulate further layers of ice through the winter, older ice also tends to be thicker ice. Observations over the whole Arctic region show that the reducing ice extent has been accompanied by a significant trend of older sea ice loss (Rigor 2004) corresponding to a reduction in overall ice thickness (Yu and Maykut 2004, Lindsay 2009, Wang 2010, Shirasawa 2009). This loss of thicker multi-year ice, which in the 1970s accounted for around three quarters of the total ice cover, has not been constant or uniform over the entire Arctic area. Over the past ten years older ice around the North pole towards Siberia has diminished rapidly, whilst the area North of the Canadian Coast has remained least affected (Agnew 2010, Haas 2010). The loss of ice more than 5 years old has also continued through 2009 (Nghiem 2010) and 2010, so that the overall percentage of ice surviving more than 5 years is now the lowest in the satellite record, at around 10% of the total. However there has been a short term recovery in the proportion of overall two and three year old ice (Maslanik 2011), following the extreme loss of 2007 and the consequent formation of a large area of first year ice in the Winter of 2007/2008. By March 2011 the overall multi-year ice formed around 45% of the total Winter Ice cover. Much of this multi-year ice formed in recent years was however relatively thin, and this has contributed to the rapid loss of ice through the 2011 melt season, culminating in the very low ice minimum extent in September.
Recent voyages have provided direct observational data (Barber 2010, Barber 2009) showing that many areas reported as multi-year ice in 2009 by satellite sensors were in fact “rotten”, containing approximately 25% open water. This implies that the ice coverage as reported by microwave sensors on satellites, which do not have high enough resolution to monitor these small scale features, is likely to be an overestimate. On a larger scale, recent melt seasons and reductions in extent have seen the overall ice cover becoming increasingly “unlocked” from the surrounding coastlines, so that ice once thought to be permanently land fast is now moving. The ice is becoming more mobile and susceptible to fracture and break up. Even above the Canadian Archipelago where ice remains thickest, ice shelves which are estimated to be more than 3000 years old have “calved” or fractured since 2000.
Figure 7. Animation showing motion and changing proportion of older and younger Arctic ice, colour scale is top right, ice 5 years old or older is in red. Credit Jim Maslanik and Chuck Fowler, Colorado University.
Can we say anything else about the amount of sea ice? Extent is the most visible proxy for the total amount of ice, and as we have seen we have relatively good ice boundary records for many Arctic regions for most of the 20th Century. To determine the total amount of ice we also need observations of ice thickness in order to estimate ice volume. Ice age can give us a useful indication of thickness, but actual measurements would allow more accurate estimates. Ice thickness data from before the 1950s is sparse. Recently declassified submarine sonar based data from 1958 onwards, covering more than 38% of the Arctic Ocean, shows that overall ice thickness has almost halved in the past 30 years, and the thinning trend is accelerating (Kwok and Rothrock 2009, Kwok 2011), though the ice thickness is not uniform across the region (Oikkonen 2011). This overall ice thinning, as measured by satellite radar altimetry (Giles 2008) and ICESat satellite laser altimetry (Kwok 2009), continued through 2008 and 2009 despite the slight increase in minimum ice extent. Combined with the loss of older ice it appears that the total amount of sea ice is on a downwards trend (Maslowski 2010, Tschudi 2010)
If we look at sophisticated models of the Arctic ice volume, such as (PIOMAS), these indicate that the annual ice volume is indeed continuing to diminish, and as with ice extent, the trend is accelerating. As the Summer ice (on average) thins, it becomes ever more susceptible various positive feedbacks, such as the effects of ice motion during storms or high winds, warming from above, from direct solar heating (Perovich 2011a), as well as from below by increasingly warm waters. The water in contact with the underside of the ice can be heated directly through thinner ice and meltponds (Itoh 2011, Sirevaag 2011). Warmer surface water may also have been transported from increasingly ice free areas subject to direct insolation, as well as from areas of the Atlantic and Pacific which are also, on average, warming (Steele 2010, Nguyen 2011). This all contributes to a lengthening melt season (Perovich 2011b). PIOMAS indicates that the 2010 summer minimum ice volume was even lower than in 2007 (Shweiger 2011), and the 2011 minimum value was lower still.
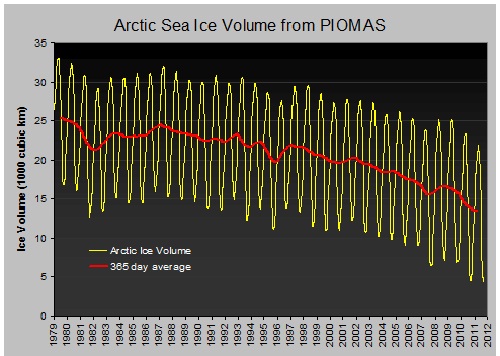
Figure 8. Chart showing estimated seasonal variations and average annual PIOMAS Arctic ice volume.
So to summarise, it is the longer term trends in diminishing ice extent, thickness, prevalence of older ice loss and volume, rather than short term interannual changes from one melt season to the next which are important when we talk about the impact of climate change on Arctic ice. As time passes and we add more data points to the charts, we may see brief increases or decreases, but as we now have data extending over several decades, the overall trends will only be marginally affected. Accounting for recent years has only increased the multi-decadal downwards trends. Against this background, claims of recovering Arctic ice are unsubstantiated. Modelling clearly indicates that this ongoing rapid Arctic sea ice loss can not be a result of natural variations (Kay 2011), and we should accept that in the time-span of a single human lifetime the Arctic region has been substantially affected by our activities.
We have noted that the amounts of polar sea ice are small compared with the total reservoir of perennial ice in the land based ice caps of Greenland, Antarctica, and the Himalayas. Though average ice mass loss from these regions amounts to hundreds of billions of tons per year, affecting hydrological cycles and global sea level (Church 2011), the loss of Arctic Sea ice has in many ways become representative of this wider ice loss and climate change. As the Arctic region has warmed in recent decades, the thin floating shell of Arctic sea ice has (on average) diminished and progressively thinned, making it increasingly fragile and vulnerable to a number of related mechanisms which are likely to further enhance ice loss. As the ice extent reduces further the amount of solar energy reflected away in the summer will also reduce, whilst the amount absorbed by open ocean will increase. The consequences of this ongoing warming and accelerating summer ice loss for the inhabitants of the region will be profound and long term (Ford 2009) and the loss of the regulating effect of summer sea ice could have consequences for the climate reaching far outside the Arctic region. With the imminent likelihood of permafrost thaw releasing significant amounts of stored Methane into the atmosphere (Isaksen 2011, Koven 2011), with the ecology of the productive Arctic waters changing (Johannessen 2010, McMinn 2011), and with the North West Passage (Shibata 2011) and the Northern Arctic Route being open more frequently (with both routes being open at the same time in 2010 and 2011), offering opportunities for lower intercontinental shipping costs, and with Energy companies expanding operations into the Arctic as reduced and thinner ice levels and rising energy prices change the economics of exploration and extraction, the diminishing ice could also present governments and humankind with dilemmas the significance of which we do not yet fully understand. Are we disinheriting the generations to come? On the evidence so far, we are certainly passing our grandchildren the responsibilities of adapting to the global changes which we, and the unwitting generations behind us, have set in motion.
Updated on 2011-09-27 by Peter Hogarth.


THE ESCALATOR

(free to republish)