Climate Science Glossary

Term Lookup

Enter a term in the search box to find its definition.

Settings

Use the controls in the far right panel to increase or decrease the number of terms automatically displayed (or to completely turn that feature off).

Term Lookup

Settings


All IPCC definitions taken from Climate Change 2007: The Physical Science Basis. Working Group I Contribution to the Fourth Assessment Report of the Intergovernmental Panel on Climate Change, Annex I, Glossary, pp. 941-954. Cambridge University Press.

Home Arguments Software Resources Comments The Consensus Project Translations About Support

Bluesky Facebook LinkedIn Mastodon MeWe

Twitter YouTube RSS Posts RSS Comments Email Subscribe


Climate's changed before
It's the sun
It's not bad
There is no consensus
It's cooling
Models are unreliable
Temp record is unreliable
Animals and plants can adapt
It hasn't warmed since 1998
Antarctica is gaining ice
View All Arguments...


Username
Password
New? Register here
Forgot your password?

Latest Posts

Archives

Is Pacific Decadal Oscillation the Smoking Gun?

Posted on 3 May 2008 by John Cross

The blogosphere is abuzz with the news that the Pacific Decadal Oscillation is reverting to a cool phase. Hot on the heels of this bombshell, a new climate model predicts a cooling North Atlantic Ocean will slow down global warming. This has led to speculation that man-made global warming is no match for natural cycles or even that Pacific Decadal Oscillation is responsible for most of the climate change over the past century including the warming since the mid-70's.

What is Pacific Decadal Oscillation?

The PDO is a climate phenomena found primarily in the North Pacific (as opposed to El Niño which affects mostly the tropical Pacific). It has two phases that it typically alternates between; usually staying in one phase for a significant period of time (as little as 10 and as much as 40 years). However, it's not uncommon for these long periods to be broken by intervals when it switches phases for anything between 1 and 5 years. The phases of the PDO have been called warm phases (positive values) or cool phases (negative values).
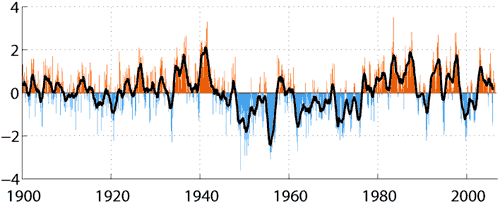

Figure 1: Monthly values for PDO index: 1900 to May 2006. Figure source: Climate Impacts Group

So the first lesson of PDOs is that while we talk about a 20 to 30 year period, it is not very clear cut at all. In fact, an analysis of the frequency of the events does not produce much in the way of a firm period. Incidentally back in 1999 it was predicted that we were entering a cool phase.

The second lesson of PDOs is that while we talk about warm phases and cool phases these are more names than physical descriptions. As seen in Figure 2, a cool phase PDO is associated with cool sea surface temperatures along the Pacific coast of North America, but the center of the North Pacific ocean is still quite warm. Consequently it would appear that there is nothing fundamental about a PDO that would cause significant changes to global temperatures.
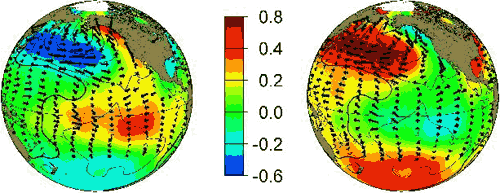

Figure 2: PDO warm phase (left) and cool phase (right). Image courtesy of JISAO.

Nevertheless, climate is always full of surprises and to be complete we should look at how the PDO's change of phase coincide with a change in climate trends? In 1905, PDO switched to a warm phase as global warming began. In 1946, PDO switched to a cool phase as temperatures cool mid-century. In 1977, PDO switched to a warm phase around the same time as the modern global warming period. Is PDO the smoking gun?
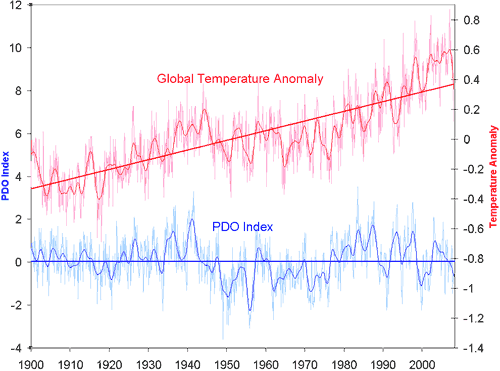

Figure 3: Monthly PDO index (blue) versus monthly global land ocean temperature anomanly (red). Smoothed data and trend lines are added.

While PDO does have some degree of correlation with short term variations in global temperature, the striking feature of Figure 3 is the contrast in trends between PDO and global temperature. Obviously the PDO as an oscillation between positive and negative values shows no long term trend. In contrast, temperature displays a long term warming trend. When the PDO last switched to a cool phase, global temperatures were about 0.4C cooler than currently.

The long term warming trend indicates the total energy in the Earth's climate system is increasing. This is due to an energy imbalance - more energy is coming in than is going out (Hansen 2005). Various factors affect the Earth's energy balance. A brightening sun increases inbound energy. Atmospheric aerosols reflect sunlight, decreasing inbound energy. Greenhouse gases absorb outgoing longwave radiation, reducing the amount of outgoing energy.

The total energy imbalance is expressed as net forcing, the sum of all the various forcings (eg - solar, aerosols, greenhouse gases, etc). Figure 4 compares net forcing to global temperature over the 20th century:
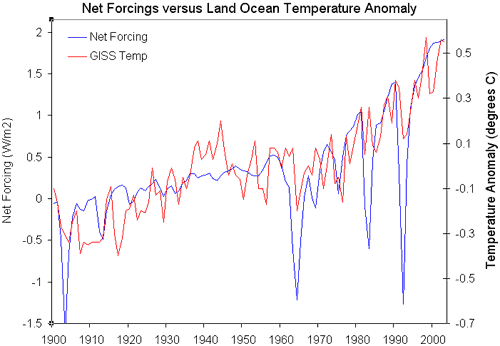

Figure 4: Net forcing (Blue - NASA GISS) versus global land ocean temperature anomaly (Red - GISS Temp).

When all forcings are included, net forcing shows good correlation with global temperatures. There is no single smoking gun. As our climate continues to absorb more energy than it emits, we can expect the long term warming trend to continue with short term fluctuations superimposed. This is the point of Keenlyside 2008 and is echoed by the Hadley Centre who predicted internal variability will partially offset the anthropogenic global warming signal for the next few years (Smith 2007).

Both predictions come from climate models seeking to incorporate ocean dynamics (I'm surprised noone has coined the term GCM 2.0 yet). These new models predict that while warming will slow over the next few years due to internal variability, the warming trend will resume in the long term.

This post was co-authored by John Cross and John Cook.

0 0

Printable Version  |  Link to this page

Comments

1  2  Next

Comments 1 to 50 out of 53:

  1. John Nicely done. A similsr post on the Atlantic long cycle will help complete the picture (I know, more work).
    0 0
    Response: Not to mention ENSO and the various other oceanic cycles. But the answer is essentially the same - oscillations cause short term internal variability but don't explain the long term trend which is caused by the energy imbalance.
  2. Johns I see that there is a lack of correllation from the beginning of WW2 through a couple years past its end. Otherwise it appears to be a faily good match.
    0 0
    Response: Looking at Hansen 2005's model hindcasts, they also show less correlation around the 1940's. I'm guessing it's due to internal variability - possibly strong El Nino at the time? I haven't looked at it in detail yet though (but plan to for a future post on mid-century cooling).
  3. Regarding the Keenlyside forecast, most media reports are missing a key piece - that the temperature projection converges with the IPCC projection within 20 years. http://climateprogress.org/wp-content/uploads/2008/05/nature5-1.jpg http://climateprogress.org/2008/05/02/nature-article-on-cooling-confuses-revkin...
    0 0
  4. Quietman: Are you talking about Figure 4? If so, I see the spot you are talking about. I could also make an argument for an earlier period of say about 1905 to 1925 - but I tend not to trust forcing estimates from that early. NewYorkJ: Thanks for the links. I had a skim through but have booked marked it to go back to and read in more depth when I have the time. Regards, John
    0 0
  5. Dear Johns, my immediate impressions follow: First, comments in the links regarding abilities to forecast El Nino, etc, seem a bit optimistic; also, it seems quite early to have any confidence in a forecast of PDO. Second, who named the 'warm' and 'cool' phases of the PDO phenomenon? Must have been North Americans? Third, Pinatubo caused the low forcing in 1992, and I suppose El Chichon caused the downspike in 1983. Google helped me find Agung in 1963 -- is that the cause of the mid-60s downspike? One can go to lots of internet locations to find discussion of the quality of temperature measurements; what's the best place to look to learn about reconstructed estimates of forcing?
    0 0
    Response: Re the accuracy of the new model's predictions of El Nino, PDO and North Atlantic short term behaviour, this is the most ironic element of the whole situation. These are new models testing new methods - inevitably, they'll be refined and improved over time and there'll be inaccuracies. And yet as they're predicting results the skeptics like (eg - cooling in the short term), the skeptics suddenly have lost their skepticism for climate models - or at least for these results.

    Re forcing reconstructions, there are links to papers and people at the NASA GISS page on forcings.
  6. John Cross The reference to WW2 is figure 4. The confilct in Europe began in 1936 and the Pacific conflict slightly earlier. An interesting anomaly that could easily have been AGW due to the wartime industry and the conflict itself. Just a thought. In figure 3 the correllation can also be seen to some extent but not in the trend line. It makes it clear that other factors are involved.
    0 0
  7. John Cook Re your response to Steve L.: Deniers love it, the skeptics simply expected it. The trend forcast as 10 years is conservative. I have read that the trend down would last through 2040 and then resume upwards. I have also seen that it will have an inverse peak around 2022. Lets hope they are right as it give us a reprieve.
    0 0
    Response: The global cooling predictions through to 2040 are usually based on predictions of cooling solar activity. I would treat those with healthy skepticism. I also hope they're right but don't think it likely (or frankly very possible).
  8. How are the forcings in plot 4 estimated?
    0 0
    Response: The net forcing is the result of combining all the following forcings:

    Line plot of showing separate radiative forcings, 1880-2003

    NASA GISS have links to further resources:
    You can find out more at their Forcings in GISS Climate Model page.
  9. That's all well and good, but earlier, you wrote to discredit the sunspot series, and you predicted that: a) the current drop in global temperatures was due to La Nina, AND b) that, once LaNina ended, global temperatures would continue that rise. LaNina ended in April. Are you standing by the assertion that global temperatures will continue to rise now that that has happened? If they do decline, then what is the cause? And, what would you say if the Mauna Loa CO2 measurements for this year actually -decline-.
    0 0
    Response: My assertion was that the sharp cooling from Jan 2007 to Jan 2008 would reverse when La Nina reverses. I still expect that to occur (in fact, I believe it's currently occuring). If CO2 levels at Mauna Loa fell this year, it would be an interesting result. However, that is one station - if the global average of CO2 levels fell this year, I would be very surprised.
  10. The reference to WW2 is figure 4. The confilct in Europe began in 1936 and the Pacific conflict slightly earlier. An interesting anomaly that could easily have been AGW due to the wartime industry and the conflict itself. Just a thought. You might have us on climate but your history suffers for it! Fuel demands were much, much lower then. By way of example, the US Army back then used 1/16th of the fuel of the fuel it uses today. Vehicles are heavier today, and faster. Jet engines gobble fuel. There were no helicopters in World War II. http://www.strategypage.com/htmw/htlog/articles/20080404.aspx This isn't to say that the USA fought WWII by itself, but, if anyone gobbled fuel during WWII, it was the USA. The Japanese and Germans both had tremendous fuel problems. Germany couldn't get fighters aloft for lack of fuel, and its own offensives often stalled for the same reason. By the end of the war, Japan was reducing to sending capital ships on suicide missions because they didn't have the fuel to actually operate them. Also, no army was as well mechanized as the US Army was. The German logistical train had a lot of steam engines and horse drawn transport, whereas the USA operated a lot of trucks. The Russians had a big, mechanized army too, and used a fair amount of fuel - but they didn't operate strategic bombers and a giant navy the way the USA did. domestically, the USA rationed gasoline "is this trip really necessary". Most passenger transport was by rail. If you look at most of the rail transport in the USA, you will see a lot of steam locomotives being pressed back into service. In fact, FDR actually forced some loco companies to keep making steam engines rather than diesels (which ultimate lead to their postwar demise), because coal was more available and steam was at least well understood. But locomotives are awefully cheap on CO2 compared to cars. I mean, a big steam engine of the day -might- make about about 2000 horsepower, (the biggest, Big Boy, was about double that), or about the power of 10 of today's car and not even close to the power of a single jet engine on a fighter aircraft. But out of that horsepower, you would pull a rail line that could probably be many, many passenger cars. The UP BigBoys pulled freight trains that were measured in -miles-. Moral of the story is, the cheapest way to go green is to build more rail lines and use more trains.
    0 0
  11. tbandrow Good points. But how about the gases and particulates from burning buildings, burning fuel and supply dumps, burning vehicles and ships and the gases from the ammunition of all types expended. Being a combat veteran I am somewhat familiar with the effects of a combat zone and its a dirty place. Just think about the Kuwait conflict where Sadam burned the oil fields. That is a lot of emissions all at once. In WW2 the allies burned a lot of oil fields. But, like I said, its just a thought.
    0 0
  12. Tbandrow: In regards to the temperatures, I would be surprised if they continued to grow. I am actually expecting a small decline in April's temperature - only because the March temperature was so large. I do not expect them to return to the January / February levels. In regards to the CO2 levels, if there is no annual growth in the CO2 levels then I will be extremely surprised. Regards, John
    0 0
    Response: The Australian Bureau of Meteorology have updated their Southern Oscillation Index and La Nina continues to subside. So as a broad guesstimate, I expect April's temperatures to be around level to March, possibly slightly higher depending on whether they get Africa's data this month and whether Russia's massive heat wave continues.
  13. tbandrew, re your comments: ["LaNina ended in April. Are you standing by the assertion that global temperatures will continue to rise now that that has happened? If they do decline, then what is the cause? And, what would you say if the Mauna Loa CO2 measurements for this year actually -decline-."] I don't think anyone doubts that global temperatures will continue to rise. After all we're continually enhancing the levels of atmospheric greenhouse gas levels, and temperatures are already on their way up to a new equilibrium level "set" by the enhanced greenhouse gas levels already up there. The point of this thread is that internal variability in the climate system (El Nino's, La Nina's, and more specifically to this thread, the Pacific Decadal oscillation) might act to counter the greenhouse-induced surface temperature rise for a while. Of course if the sun "decides" to burn a tad cooler or we have a serious bout of volcanic activity, then greenhouse-induced warming will be delayed further....but one cannot massively enhance the concentration of atmospheric greenhouse gases and not expect that the world will warm.. And it's rather unlikely that the atmospheric CO2 levels will decline during 2008. They're already well above 2007 levels. Why should they decline? What's your proposed mechanism whereby addiding CO2 to the atmosphere will result in a decreaed level of atmospheric CO2, particularly as the oceans absorption of CO2 is already becoming somewhat less eficient?? here's the data: http://www.esrl.noaa.gov/gmd/ccgg/trends/ (either view the Mauna Loa data or scroll down the page for the globally averaged sea surface CO2 data).
    0 0
  14. Some general comments and questions about this thread. There are a number of things that I'm confused about: (i) All of these ocean oscillations (El Nino's, La Nina's and the Pacific Decadal oscillation) act to modulate the global surface temperature through the redistribution of solar energy with respect to the ocean surface and depths. In El Nino years, for example, warm surface waters spread across large parts of the equatorial Pacific with a suppression of cold water upwelling of the West coast of S. America. So the Earth's surface temperature rises a tad during the period of this phenomenon....however the contribution to any long term trend (e.g. drien by greenhouse-warming) is close to zero. However, according to your Figure 2, the warm phase of the PDO seems to be associated with reduced sea surface warmth overall. Apparently the PDO is identified with respect to the pattern of sea surface temperatures near the NW coast of the US and Canada. But this seems a highly localized affair! Unless something untoward is happening on the other half of the globe (hidden in Figure 2), I don't understand what's going on. I actually assumed that you might have mislabelled Figure 2 a and b, but apparently not. It does look a bit odd to me...much larger areas of red and dark red in the "cool" phase of the PDO.. (ii) What are the predictable elements of the PDO in the analysis of Keenlyside et al? I had a quick read through their paper and it doesn't seem obvious to me. In other words what is it about the PDO that is sufficiently predicatble that Keenlyside are basing their projections on its future behaviour? It's not particularly cyclic (see your Figure 1), so what is it? Anybody got a simple explanation? (iii) Keenlyside et al [Nature 453, 84-88, 2008; link in Johns summary at the top of the thread] seems slightly problematic to me. In their Figure 4 (top of page 87), their "hindcast/forecast" shows zero global warming between 1985 and 2000. They consider the latter parts of this period as "verification". I would conclude that their "verification" has failed somewhat! Their "forecast" indicates that the period between 1985 and 2005 should give a temperature increase of around 0.1 oC. That's much smaller than the measured global temperature rise during this period... again that might be taken to indicate that their "forecast" isn't actually that good. (iv) A general point. I wonder whether the efforts at short-medium term "forecasting" are premature, or if not premature, might be being taken out of context. If there are stochastic elements of the climate system that are not well-defined [see point (ii)], aren't these "forecasts" similar to "guesses"? Modelling seems a rather good way of assessing the equilibrium temperature increase in response to various greenhouse gas emission scenarios, and giving us some indication of the time scale of temperature increase and the geographical distribution of excess warmth. But rather detailed forecasts of the Earth's temperature evolution over periods of a few years to decades seems problematic to me. I can understand the value of these efforts in (a) the continuing development of modelling efforts and (b) as a test of our understanding of the various elements of the climate system and their interactions, and so on...but they really need to be understood in those terms I would have thought. I don't think they should be considered as "true forecasts" in the wider sense. They're certainly not "predictions", although unfortunately many will consider them to predictions, and will no doubt be ready to jump on them when the forecasts turn out not to be correct...
    0 0
  15. Chris: some comments about your point (i). The PDO came about from fishery research in Alaska so I suspect that the warm / cool is a local description (and not really a useful one either). My guess is that we will start to see the term positive and negative phase used more and more. Keep in mind the idea of the PDO is only about 10 years old. Regards, John
    0 0
  16. I don't think anyone doubts that global temperatures will continue to rise. After all we're continually enhancing the levels of atmospheric greenhouse gas levels, and temperatures are already on their way up to a new equilibrium level "set" by the enhanced greenhouse gas levels already up there. Some people do have that doubt. So, what I'm trying to do is set up an actual conditions of a simple experiment. John's been super enough to basically describe his view of things and its certainly mainstream enough. La Nina ends, and global temperatures will rise for it through the year. If the temperatures rise, then, yeah for Hansen and friends. current models are more validated and the sunspot people made a prediction that failed. we have a weak solar cycle, low flux and sunspots, and the earth's temperature still goes up. That would pretty much do it. If the temperatures fall, though, then yeesh, there's work to do. If there is some sort of mechanism driving the climate than a lot more science needs to be done. But, at least there is a, double yeah for Hansen and friends because they at least have some software base that will need to be adjusted to reflect new things learned. I am skeptical of global warming per se, but that doesn't mean I oppose the use of computer models as a means of encoding scientific knowledge. Rather, I just think the current models suck. It's been my experience that most experts in some other field are horrible programmers, and I'm a computer programmer. I had a look at Hansen's GCM, and although my FORTRAN is very rusty, what they have in there just seems absurd. Some other climate models seem to use the same sort of analytical and modelling techniques used by the finance industry, and that's been a 200 billion dollar fiasco -so far-. I have a sort of a dream that I'm going to write a GCM that doesn't suck and so this immediate experiment interests me. So, I'm not coming from the perspective of denial because a lot of people of a left wing ilk are pushing it. Rather, I see an opportunity for my capitalist friends to really cash in on climate by offering someday a -better model-. So, to other skeptics, I would say, if you don't like the model that is out there kicking out global warming predictions, make one that is more accurate. If you can't, then get out of the climate business and let the pros do their jobs.
    0 0
  17. Responding to the possibility of atmospheric CO2 declining this year ... well, the 1998 El Nino was associated with higher CO2 concentrations (presumably due to the Pacific releasing it or failing to absorb much due to warm surface temperature). Also, after Pinatubo there wasn't much increase in CO2 (despite the volcanic release), I guess because it was colder and the ocean surface absorbed more CO2? I wonder if the size of the economy can be reconstructed from trends in CO2 concentrations? That's presumably another factor that COULD contribute to a lower-than-expected CO2 concentration in 2008, although I greatly doubt it.
    0 0
  18. co2 interannual varibility is mostly due to tropical land fluxes,droughts and fire in the Amazon basin and Indonesia during el nino are the main driver not ocean release/absorption: http://www.atmos-chem-phys.org/3/1919/2003/acp-3-1919-2003.html http://cat.inist.fr/?aModele=afficheN&cpsidt=16775977
    0 0
    Response: Those are both interesting papers, thanks for the links.
  19. About April anomaly,over land Asian exceptional anomaly has greatly reduced while antarctica interior has been warm this month,oceans are warming slowly despite la nina rapid decline(there is a 2-3 months lag beetwen ocean temps and ENSO) thus do not expect a very warm month as March(neither cold anyway). RSS satellite data are stable due to land cooling compensated by ocean warming but satellite data are more sensitive to tropical SST change and less to land surface anomaly... RSS land and ocean data: MSU Land Temp MSU Ocean Temp And some information about MSU vs tropical SST
    0 0
  20. gx, thank you for disabusing me of the notion I was promoting. I don't remember where I was told that the CO2 in '98 came from the ocean (I think it was a commenter at CA). It shows how much more valuable comments are when they include links to relevant primary literature. However, I still wonder about the reduction in CO2 associated with Pinatubo, and given that different parts of the ocean can be sources while the rest is a sink, I wonder if there is a non-negligible effect on the noise in CO2 trend from oceans. Your links suggest another interesting thing. The stronger effect of forest burning says something about the scale of forest burning for agriculture, don't they? I would assume that there are trends in agricultural burning, but it's trends in precipitation that are observed in atmospheric CO2.
    0 0
  21. Steve L I posted some links on El Nino / La Nina in the Volcano thread that you might find interesting. In summary, it says that a volcanic eruption in the Andes always precedes an El Nino. CO2 is released when a volcano erupts as well. But the real impact is the El Nino itself (record highs).
    0 0
  22. John I do not believe that there is a single smoking gun anywhere, or conversely, there are many smoking guns. Re: "oscillations cause short term internal variability but don't explain the long term trend which is caused by the energy imbalance" in your response. The North Atlanyic long cycle is not a short term effect. See A Pervasive 1470-Year Climate Cycle in North Atlantic Glacials and Interglacials: A Product of Internal or External Forcing?. And as for the record El Nino year of 1998, see Predictable Winter Climate in the North Atlantic Sector During the 1997-1999 ENSO Cycle. It seems that these record years are a product of various cycles overlapping at just the right time.
    0 0
  23. John, in relation to PDO/ENSO, you are aware, I guess, of Roy Spencer’s theory on internal radiative forcing. From the 2nd link below, “Internal radiative forcing refers to any change in the top-of-atmosphere radiative budget resulting from an internally generated fluctuation in the ocean-atmosphere system that is not the direct result of feedback on temperature“. He has an article in print in the Journal of Climate. From his homepage: - http://www.weatherquestions.com/Roy-Spencer-on-global-warming.htm “Our latest article, "Potential Biases in Feedback Diagnosis from Observational Data: A Simple Model Description", has been accepted for publication in Journal of Climate. It uses a simple climate model to show how daily noise in the Earth's cloud cover amount can cause feedback estimates from observational data to be biased in the positive direction, making the climate system look more sensitive to manmade greenhouse gas emissions than it really is”. Also: - “I have asked the editor of the Bulletin of the American Meteorological Society to consider publishing a paper I have written entitled, "Evidence for Internal Radiative Forcing of Climate Change". I believe that this paper addresses the single most important issue neglected by the U.N.'s Intergovernmental Panel on Climate Change (IPCC): Natural climate variability generated within the climate system in the form of INTERNAL radiative forcing. This paper is a generalization of our paper that has just been accepted for publication in Journal of Climate, and describes how mixing up of cause and effect when observing natural climate variability can lead to the mistaken conclusion that the climate system is more sensitive to greenhouse gas emissions than it really is. It also shows that a small change in cloud cover hypothesized to occur with the El Nino/La Nina and Pacific Decadal Oscillation modes of natural climate variability can explain most of the major features of global average temperature change in the last century, including 70% of the warming trend. While this does not prove that global warming is mostly natural, it provides a quantitative mechanism for the (minority) view that global warming is mostly a manifestation of natural internal climate variability. (This paper is sure to be controversial, and it will be interesting to see how difficult it will be to get published.)” In relation to this see also his post in Climate Science: - http://climatesci.org/2008/04/22/internal-radiative-forcing... If his theory is essentially correct then: - 1. Much of the Net forcing (w/m2) in your chart above, since the 1970’s, can be attributed to internal radiative forcing. 2. Feedback to GHG forcing is much less, or even –‘ve. The latter implies sensitivity to 2 X CO2 of less than 1C. 3. If the PDO has changed to a longer term , –ve phase, with a dominant presence of La-Ninas over El- Ninos, then we are in for a sustained period of less warming or even cooling. 4. Over the longer term the ocean cycles will probably cancel out but we are left with a much smaller increase in radiative forcing & feedback, due to GHG’s, then we have been led to believe. The mistake has been to “extrapolate” the recent warming as if it was almost all due to GHG’s. 5. The theory probably needs to be expanded to include all the major ocean fluctuations.
    0 0
  24. You write: "The long term warming trend indicates the total energy in the Earth's climate system is increasing." Actually, the trend you are talking about is a snapshot of the lower troposphere at about 2 meters altitude (plus an estimate of average sea surface temp). It gives us very little information about the total energy content in the oceans, which are at least an order of magnitude greater as energy reservoirs as the atmosphere. Btw., why do you keep using the GISS temperature data which diverges notably from the other temp time series? Don't you trust HadCRUT or the satellite MSU series, because they show less warming? Or do you have strictly methodological arguments for your choice?
    0 0
    Response: A good point - the ocean contains something like 84% of the heat absorbed by the earth and it's long term trend is a good measure of the climate's energy imbalance. Hansen 2005 uses the warming oceans to calculate the net forcing at 0.85Wm-2. As for why I use GISS over others, for the sake of this discussion, only GISS and HadCRUT go back to the start of the century. Both show an overall warming trend so the argument of a long term energy imbalance is the same regardless of which dataset you use.

    GISS covers the entire globe whereas HadCRUT omits polar regions so you could argue GISS Temp offers a more complete picture of 'global' warming. But in actuality, I just haven't got around to downloading and parsing all the different datasets. Lucia at rankexploits.com takes the average of the 4 major datasets (GISS, HadCRUT, RSS and UAH) which is an interesting approach.
  25. GISS does not diverge noticeably from the other temperature series. If any series diverges from the others, it's UAH which shows the least amount of warming. http://cce.890m.com/temp-compare.jpg http://cce.890m.com/giss-vs-all.jpg
    0 0
    Response: Thanks for the links - here's what the second graph looks like:
  26. I posted the following at RealClimate, but folks may be interested here. The following article is about the ‘Weather Olympics’ that will be run alongside the Beijing Olympics, in which international teams will compete to predict Beijing’s weather with 36hr forecasts. >> Teams prepare for weather Olympics Perhaps we similarly need an annual climate forecasting competition. There could be multiple events: 1. Global average temperature. 2. Regional average temperatures. 3. Arctic and antarctic ice extent prediction. 4. Glacial extent. 5. El Nino/La Lina prediction, along with predictions for a bunch of other such phenomena. etc. And where appropriate there could sub-events for different time periods or for trends rather then absolute values. Then we’ll be able to see who’s models and theories stack up to the cold hard facts of reality the best. There seems to be resistance to ideas like this among the scientific community. Not sure why. Climatologists are having trouble getting the general non-scientific community to take the science seriously, rather than the guff from denialists. Something like this would distill the work in a way the public could understand and in a manner that the media would run with.
    0 0
  27. pico, I don't see any positive value in an "annual climate forecasting competition". Apart from anything else it doesn't make sense. One can't "predict" "climate" on an annual basis bacause year to year variation isn't "climate"..it's more like "weather". The whole thing (Keenlyside et al included) is a delusion. We understand quite well the essential elements of the Earth's energy budget (e.g. an enhanced greenhouse gas concentration will result in a higher equilibrium temperature anomaly, all else being equal)...however we don't have a good handle on either the internal variations of the climate system (El Nino's, la Nino's and various other ocean circulation variabilities), nor the unpredictable elements (non-cyclic solar contributions; volcanic contributions...)... so whereas we can make reasonably good predictions of the Earth's temporal temperature evolution [e.g. Broeckers 1975 prediction...or Hansen et al's mid-1980's climate model extrapolated into the future (our now-present)] under various emission scenarios, no-one can truthfully predict whether the temperature anomaly for the year ahead will be the same as last years or plus 0.1 oC or - 0.1 oC. However we can rather more reliably assert that in 10 years time the Earth's temperature anomaly will be fluctuating around a level that is 0.15-0.25 higher than today's, and that in 20 years time the Earth's temperature anomaly will be fluctuating around a level that is 0.3 - 0.5 oC higher than the present one, given a continued greenhouse gas emission trajectory. By throwing the floor open to all-comers with all their "guesses" the whole thing is likely to become a circus with the correct "guess" likely to be be "correct" for the wrong reasons. Unless one can predict any solar fluctuation (it can't be done outside the certainty of the 11 year solar cycle)...El Nino's and La Nina's (can't be done except on a probabilistic basis), volcanic eruptions (can't be done), ocean current fluctuations (PDO, AMO, SOI et al) (no real basis for prediction there either), there is no basis for meaningful year on year prediction... However the evidence supports the conclusion that on a decadal timescale, most of these fluctuations roughly cancel with little net warming/cooling contribution (medium to long term variations in solar output being a potential exception), whereas a continually increased greenhouse forcing results in a postive trend which is apparent on a decadal basis rising above the "noise" that modulates the Earth's temperature anomaly on a year to year basis. If one examines the Earths temperature evolution (see Figure in post #25 just above) that's blazingly obvious. Notice that our uncertainty with respect to yearly forecasting doesn't indicate an incomprehensibility of the climate system. We can understand the temperature evolution rather well in hindsight. We can observe El Nino's, La Nina's, volcanic eruptions and so on, and understand how they influence the temperature evolution on a year-on-year basis rather well... ...we just can't predict all this "noise". It's foolish to pretend that we might be able to, and to pretend that we can is to put the charlatans and any climate scientist foolish enough to engage in this sort of prediction on an equal basis...because it's just guessing. Now of course someone might come up with a profound understanding of some of the presently apparently stochastic elements of the climate system (e.g. it might become apparent how one can make reliable predictions of El Nino's or the PDO)...in that case fine..predict away!
    0 0
  28. Chris, 1) You are assuming I'm suggesting that the Climate Olympics events would be all be about predicting next year's climate. Not at all. While the competition might be annual, the timeframes for some events might be for periods that are much longer. The time frames would need to be selected very carefully by scientists with a comprehensive understanding of this. In fact the process of choosing the suit of events and associated time-frames would itself be very informative to the wider public. The event suite might be summarized as a grid of phenomenon x timeframe with many cells blacked out because it is not possible to predict all phenomena over all time-frames. 2) Clearly you would not be able to let every second clown and his squeeky dog enter with predictions plucked out of his/her silly hat. There would need to be criteria, such as the requirement that the predictions be based on a sound conceptual models of atmospheric and ocean physics. 3) As the science and models advance, it would be necessary to re-examine the event suit annually. So extra events might be added over time, but only after careful consideration.
    0 0
  29. The squeeky dog might win. I think you eliminated everyone else with the last lines of the paragraph.
    0 0
  30. pico, Yes i did interpret your Climate Olympics event as a "year ahead" prediction jamboree. Such a prediction was suggested further up the thread and i had that in mind when I read your post... So, actually I'm pretty much in agreement that such an event would be a good idea as a focus of research towards the short term predictions (a few-10 years) that would be very useful for all sorts of endeavours, but which are now (in my opinion) little better than "guesses". Some effort should be made to ensure that the public perception wasn't "hijacked" with the inference that unsuccessful predictions indicate fundamental misunderstanding of the climate system in its response to persistent greenhouse forcing. I think we all agree that very short term forecasting is bound to be complicated by all of the essentially unpredictable (for now anyway!) elements of ocean circulation, solar activity and potential volcanic eruptions... There is some precedent from other research fields for the sort of regular event that you propose. The protein folding modellers have a biannual event (CASP) in which a competition for the most succesful protein structure prediction is held (i.e. the modellers are given the amino acid sequence of a protein who's crystal structure has recently been determined but not yet released, and they have to model the structure from the sequence, based on the known forces governing the folded state structures of proteins). I guess the difference between CASP and your Climate Olympics is that the protein modellers find out immediately who has done the best job, whereas the climate modellers will have to wait a few years to see who's best nailed the prediction...
    0 0
  31. John Cross and I made a predictions on global temp a few months ago based on La NIna, where are those now? I know so far I am right on (due to brilliant lack of specificity and a random wiggle in the GISS data)so I want to review my brilliant contribution and maybe enter it in the proposed contest.
    0 0
  32. Why do we think it is reverting to a cool phase and not just a dip like in 2000?
    0 0
  33. Wondering Aloud, It's a very good question, and one that Keenlyside et al (link in John Cross' header article above) don't really address in their paper as far as I can see. The lack of success of their "hindcasts" with respect to reality, might lend us to question whether their prediction of a short-term slowdown of warming has much merit. There's also the question of whether the "warm" or "cool" phases of the PDO make a significant contribution to the Earth's global surface temperature anyway. After all the PDO is just one of the Ocean oscillations. If one overlays the AMO (Atlantic Meridonal Oscillation) with the PDO, for example, it's pretty much a mirror image with a cold phase in the early 20th century up to the 30's, a warm phase from then through the early 60's and then a cool phase to 2000. So overall, ocean currents might be essentially neutral on short timescales as well as longer (decadal) ones... Unfortunately I can't find a picture of the AMO, but this is described in a recent paper in Geophys. Res. Lett.: K. E. Trenberth and D. J. Shea (2006) Atlantic hurricanes and natural variability in 2005; Geophys. Res. Lett. 33, L12704, doi:10.1029/2006GL026894.
    0 0
  34. WA and Chris Wiki gives a good explanation of the AMO: Atlantic Multidecadal Oscillation Or this may be better as it includes a graph and a link to the NASA source paper: Multi-Decade Climate Cycles Also I put a link in comment 22 about the AMO (just in case you missed it).
    0 0
  35. Have a look at these two sites: http://atmoz.org/blog/2008/08/03/on-the-relationship-between-the-pacific-decadal-oscillation-pdo-and-the-global-average-mean-temperature/ http://wattsupwiththat.wordpress.com/2008/01/25/warming-trend-pdo-and-solar-correlate-better-than-co2/ This analysis shows oceans are clearly the main drivers of climate through their actions in storing and distributing heat. We should not be surprised to see a close correlation between GMT and oceanic oscillations; in fact, given that oceans store around 85% of TSI and therefore (ultimately) transport that energy (directly and indirectly)around the globe we should be more surprised if there weren't. Of course PDO and AMO and the rest affect GMT because they are the prime mechanism that absorbs and disperses heat in the model. What is less clear is the time lag between oceanic warming and the release of that heat. I don't think that PDO et al is an issue, what is an issue is does increasing the CO2 component effect the overall system balance, in waht way and to what extent?
    0 0
  36. John, In response to #5, Steve L, you said>> "... the skeptics suddenly have lost their skepticism for climate models -or at least for these results." What makes you say that, wishful thinking perhaps? Until computer models can actually predict something that can be confirmed (rather than spit out questionable "correlations" in 20:20 hindsight), I think most skeptics will remain just that.
    0 0
  37. Mizimi The oceans also receive and store heat from the earth. See the link to plate tectonics in Volcano thread.
    0 0
  38. QM: Yes, another thread I am pursuing ( when time allows!!)is any correlation between tectonic plate movements and global temps due to land distribution; It seems clear to me that the Nhemisphere land mass has a big influence on several factors affecting GMT.
    0 0
  39. Mizimi Yes, we know from past plate positions how placement changes climate (in general) because of equatorial storm formation and large land mass desertification. I think Palaeos.com covers that issue. What the current article is about is somewhat different. It's about heat exchange at subduction zones, an issue that I have been arguing for about a year now.
    0 0
  40. Quietman, I am unfamiliar with this research. Has there been any significant change in the number or magnitude of subduction zones, that could explain an increase in global temperature? Oh, and what is the exact name (or URL) of the "Volcano thread" I can't seem to locate it?
    0 0
  41. Quietman, Forget that last question, I found it in your post #21. It's marvelous what you can find if you just look back far enough in the current thread. ;)
    0 0
  42. I have a question - my grasp on physics is pretty basic and I was using this article to make a point on an internet forum and this was the response I got. Can you possibly give a brief explanation? "Greenhouse gases absorb outgoing longwave radiation" I am not sure what this is trying to say. The absorption of energy must culminate in some sort of effect. Either the energy excites e-, causing it to jump from a lower energy level then falling back again; emitting light during the drop. Or the energy absorbed breaks bonds. Or the energy is reflected. Do you know what this is trying to say?
    0 0
  43. Re #42: The infrared electromagnetic (EM) radiation reaching the earth's surface is transformed to thermal energy which is re-irradiated eventually as longwave infrared (IR), having a lower energy than the incident IR. This longwave IR has energies that overlap with those of the vibrational transitions of certain atmospheric gases. These are molecules with asymmetric bond vibrations; i.e. CO2, H2O, CH4 and others (symmetric diatomic molecules that dominate the atmospheric composition - O2 and N2, don't absorb this longwave IR). So electronic transitions aren't excited, nor are bonds broken. However the absorbed longwave IR is either re-emitted by the greenhouse gas molecules, or else the gases transfer their thermal energy to other molecules directly by collision (thermal energy is essentially the same as heat). This has the effect of suppressing the escape of IR into space, and thus warming the atmosphere. In other words, the longwave IR emitted by the earth's surface radiates essentially "upwards" into towards space; however the "trapped" IR is re-emitted in all directions, and so the return of thermal energy to space is suppressed. I suspect that's what the sentence is summarising...
    0 0
  44. Thank you!
    0 0
  45. Where is this one at? I think I sam a claim that PDO was back into a neutral phase and that the it never really switched for any significant time? When you present global temperature anomaly graphs like the one above who is the source of these graghs? Do the ones you use now look the same as they did a few years ago for the period from 1880 to 1990?
    0 0
  46. The only reason the UAH data diverges from all the rest is because the UAH was relying on Diurnal (day & night) data-which resulted in a lower temperature anomaly. Other researchers have corrected for this error, & the resulting data set is now virtually identical to that of GISS, RSS & HadCRU datasets.
    0 0
  47. Here's the thing I keep coming back to-Decadal Oscillations have been going on since time out of mind, yet we're supposed to believe that *suddenly* they're generating a 60-year long warming trend. If so, what has changed in the DO's to make them do this? The oceans might store & distribute heat but, last I checked, they couldn't create that heat out of nothing. Isn't it possible that atmospheric warming is driving changes in the Decadal Oscillations, rather than the other way around? At days end, over the last 60 years, we've been seeing the fastest rise in global temperatures in more than 12,000 years-& the only thing which has changed significantly in the same period of time is the atmospheric concentration of greenhouse gases. Perhaps that's a coincidence, but Occam's Razor suggests otherwise.
    0 0
  48. Marcus, PDO and ENSO share a surprising similar sea surface temperature and surface wind field patterns in the Pacific Ocean. Being independent in the respective cycles, this fact seems to point to a common general response to different forcing or variability; but neither one controls climate, the reverse might be true.
    0 0
  49. I think this is they correct place for this question, has anyone examined Akasofu's paper claiming that we are now in the cooling phase of the multi-decadal oscillation? http://people.iarc.uaf.edu/~sakasofu/pdf/two_natural_components_recent_climate_change.pdf Is there any merit to his arguments? It looks convincing but perhaps a little too neat.
    0 0
  50. farwalker, to be honest, i do not have the will to go through the 55 pages of that (unpublished?) paper. But just from the first few pages you may realize that the whole reasoning is based on a faulty assumption: recovery from the LIA. What does it mean recovery? Is there any predefined climate state that have to be restored? Does it happen without any forcing? This argument would make even the skeptics crazy, they who love the sun so much! Indeed, there has been an increasing sun activity from the Maunder minimum but it has stopped about 60 years ago. The temperature increase from the mid 19th century up the the mid 20th century is surely due in part to the sun; but from then on it can not be the sun. Another faulty claim is that global warming has stopped in the last decade. There are good reason to believe that it's not cooling; and there's no way to support this claim based on temperature data. (Also here).
    0 0

1  2  Next

You need to be logged in to post a comment. Login via the left margin or if you're new, register here.


The Consensus Project Website

THE ESCALATOR

(free to republish)


© Copyright 2024 John Cook
Home | Translations | About Us | Privacy | Contact Us