Climate Science Glossary

Term Lookup

Enter a term in the search box to find its definition.

Settings

Use the controls in the far right panel to increase or decrease the number of terms automatically displayed (or to completely turn that feature off).

Term Lookup

Settings


All IPCC definitions taken from Climate Change 2007: The Physical Science Basis. Working Group I Contribution to the Fourth Assessment Report of the Intergovernmental Panel on Climate Change, Annex I, Glossary, pp. 941-954. Cambridge University Press.

Home Arguments Software Resources Comments The Consensus Project Translations About Support

Bluesky Facebook LinkedIn Mastodon MeWe

Twitter YouTube RSS Posts RSS Comments Email Subscribe


Climate's changed before
It's the sun
It's not bad
There is no consensus
It's cooling
Models are unreliable
Temp record is unreliable
Animals and plants can adapt
It hasn't warmed since 1998
Antarctica is gaining ice
View All Arguments...


Username
Password
New? Register here
Forgot your password?

Latest Posts

Archives

The Deep Ocean Warms When Global Surface Temperatures Stall

Posted on 2 October 2011 by Rob Painting

Despite being the warmest decade on record, the last decade has seen a slowdown in the rate of global warming in some temperature datasets. The factors responsible for this slowdown have been discussed at SkS, most recently in the SkS post Ocean Heat Content And The Importance Of The Deep Ocean, which looked at three Hadley Centre climate models. 

Meehl (2011) is also climate modeling-based study, which finds that decade-long periods of little or no warming are relatively common in the model simulations. This helps to explain why global warming is not a steadily rising, or monotonic trend, consistent with the temperature observations to date (Figure 1).
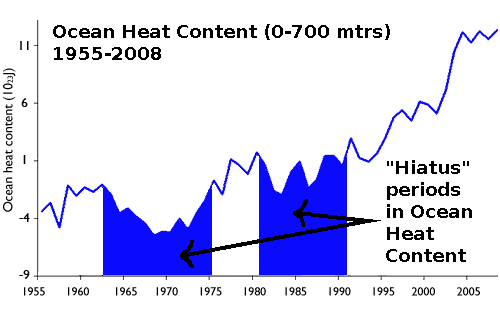
Figure 1 - Ocean heat content (0-700 mtrs) for the period 1955 to 2008. Adapted from Levitus (2009). Two periods of ocean warming hiatus highlighted in blue. Both periods exceed 10 years in length.

This see-sawing of upper ocean heat is simply part of the natural variability inherent in the climate, which occurs even during periods where the ocean is experiencing long-term warming. During these "hiatus" periods the surface layers of the ocean undergo little or no warming, but the ocean below undergoes substantial warming.

Where's the heat at?

Meehl (2011) use the Community Climate System Model (CCSM4) to simulate a future global warming scenario where the top-of-the-atmosphere (TOA) energy imbalance is similar to that observed in the last decade. Five model runs in which the Earth system is accumulating heat but the global surface temperatures show decade-long hiatus periods are examined (Figure 2).  Note that the declining trend in the later part of the 21st Century simulations in Figure 2 is due to the emissions scenario chosen - where CO2 emissions are supposed to decline.
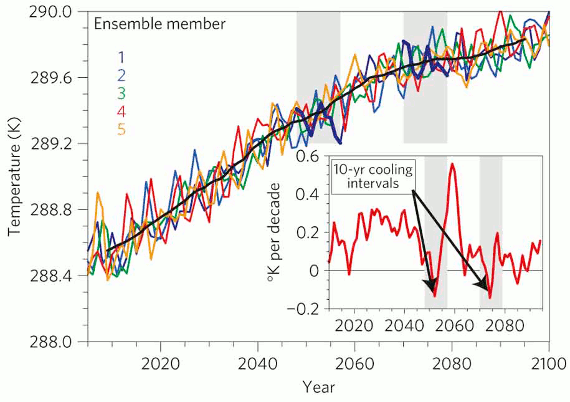
Figure 2 - Annual mean (globally averaged) surface temperature for the 5 climate model runs examined. Coloured lines are the models runs and black line is the mean (average) of the model runs. Inset are two ten-year negative-surface-temperature-trend periods. From Meehl (2011)

The authors look at the two hiatus periods (chosen because of the negative global surface temperature trend) from the 5 models runs shown above, plus 6 others from other model runs, giving a total of 8 hiatus periods from the model simulations. Analysing these hiatus periods reveals that, compared to other decades, a far greater amount of heat goes into the ocean in the 300 to 750 metre layer, and the 750 metre to ocean floor layer (Figure 3).
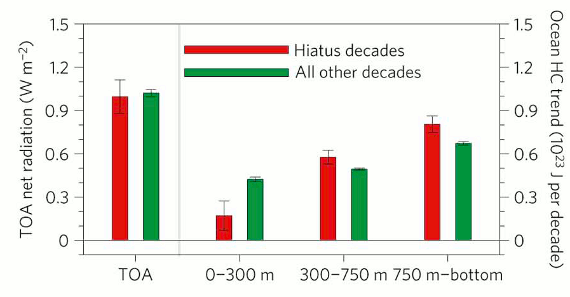
 

Figure 3 - composite global linear trends for hiatus decades (red bars) and other decades (green bars). Positive values for TOA net radiation (left-hand side) indicate energy accumulating in the system (i.e. global warming). Right-hand side shows ocean heat content decadal trends, for the various ocean layers.

The model therefore shows that greater amounts of heat are being sequestered in the deep ocean when global surface temperatures are in hiatus periods.

Ocean basin trends  

Looking at the ocean basins, in the model runs, the authors find various processes are at work in each basin. In the Atlantic and Southern Oceans, there is a marked drop in heat content in the upper 300 metre layer, with moderate increases in the layers below 750 metres. Meanwhile in the Pacific and Indian Oceans, the reduction in heat content in the upper 300 metre layer is much smaller, and the greatest increase in heat content occurs in the mid-ocean layer (300-750 metres).

The general pattern of warming and ocean circulation in the model, during these hiatus periods, is very similar to that which occurs over shorter timeframes in the La Niña phase of ENSO. Strong upwelling in the equatorial eastern Pacific brings cold water up from the deep, which cools air temperatures in this region. Meanwhile in the subtropics of each hemisphere, heat is piling up and being driven down into deeper layers. The typical sea surface trend for these hiatus periods is shown in Figure 4.
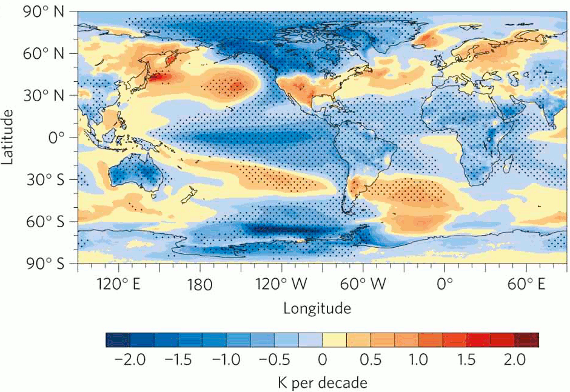
    

Figure 4 - Composite average global surface temperature trends for hiatus decades, (from the climate models); stipling indicates 5% statistical significance (i.e a 5% probability the result was due to chance or statistical error). Orange-coloured ocean areas represent regions where OHC is converging and being driven down into the deep.

Ocean heat coming back to haunt us?

Not only does the climate model-based study, Meehl (2011), show heat is buried into deeper ocean layers when global surface temperatures stall, but it also presents plausible mechanisms in ocean circulation that transport heat down to the deep ocean. The general pattern of sea surface temperature during these hiatus periods is very reminiscent of a La Niña-like climate state.

The regular nature of these hiatus decades in the climate model, indicate that they are simply periods of natural variability, which occur even in the presence of a long-term warming trend. This is supported by historic observations (Figure 1), which shows roughly decade-long hiatus periods in upper ocean heat content during the 1960s to 1970s, and the 1980s to 1990s.

The natural variability 'flip-side' to these hiatus decades, are periods where there is greater-than-average surface warming (see inset in Figure 2). So at some point in the very near future we can probably expect surface temperatures to gather up a head of steam, and begin rising at a rapid rate. 

Related SkS posts: Deep ocean warming solves the sea level puzzleBillions of Blow Dryers: Some Missing Heat Returns to Haunt Us, Ocean Cooling Corrected, Again, and Ocean Heat Content And The Importance Of The Deep Ocean

0 0

Printable Version  |  Link to this page

Comments

Prev  1  2  

Comments 51 to 55 out of 55:

  1. A more general point to consider is that there are open question in relation to the science of climate change. This is one of them. Some have gone for one mechanism, others for an alternative mechanism. Either may be entirely right or wrong, perhaps more plausible in this case is that both mechanisms are operating, but we shall see. Some climate skeptics like to think that climate scientists consider the science a closed shop where there is but one single view and no discussion allowed. That leads to some of the more egregious accusations levelled. Of course this is not the case, and here we have a prime example of active disagreement on part of the science. It does not, of course, change the need for action, as whichever hypothesis is right has bad news following right along behind it. That Trenberth and Hansen have different views on one aspect of all this does not cause any significant issues, and is quite natural in science.
    0 0
  2. David, Rob, Skywatcher. Take a look at a graph Albatross just posted on this thread. The sooner this data appears in a papoer the better.
    0 0
  3. Aware of that thanks Glenn, I was involved in the discussion at Real Climate when Gavin Schmidt posted the graph. Just affirms what the data from the 700mtr and 1500 mtr ocean depth observations were suggesting. I might e-mail a few scientists and find out if there's any studies on this in the pipeline.
    0 0
  4. Hi Rob, just posted this over on the Heat energy post (link Glenn provided). Looking at five year averages of the difference between the 700m heat Ocean content and the 2000m data, (assuming the data is treated consistently and I haven’t messed up) we see a significant increase in this difference in all ocean basins (and also checked for both hemispheres) over the past decade, against a background of continuing global increase in 0 to 2000m heat content. The departure from the very small global 700m to 2000m differences over the 1980 to 2000 period is marked. This would indicate continued and consistent warming of deeper layers during short term changes nearer the surface. Useful for this post I think.
    0 0
  5. Peter @54, Nice graphic! But, "Oh No! Another Hockey Stick"! ;) I recall reading in a new paper that they suspect that there were problems with the data over the Atlantic in the seventies, with an abnormally warm blip being an artifact of data issues. A couple of studies have suggested that the data before 1970 are not of much use due to poor spatial coverage and that is reinforced by church et al's finding that they can only close the seal level budget from the early seventies.
    0 0
  6. Thanks Pete. And this is from the NODC data? Interesting how it can change so quickly, almost as if someone has flipped a lever and heat is now tracking down deeper. Just been reading Sutton & Roemmich (2011). Although I don't cover it in the post, most of the heat funneled down to the depths in the climate model used by Meehl (2011), occurs in the Southern Ocean (figure 4 in the post). That's what Sutton & Roemmich find looking at the WOCE (World Ocean Circulation Experiment) and ARGO data. The "missing heat" is running out of places to hide.
    0 0
  7. Suggested reading: “Deep Oceans May Mask Global Warming for Years at a Time: Computer simulations of global climate lead to new conclusions,” National Science Foundation, Sep 13, 2011 To access this article, click here.
    0 0
  8. From where do Peter Hogarth found the data to make the wonderful figure of comment 54?
    0 0
  9. When I say that "surface temperatures are warming steadily" I want to say that is not true that surface and atmospheric warming has stopped or even slowed down. That was an artifact of the moderate-to-strong La Niñas of 2007-2008 and 2010-2011. The thing that puzzles me is how we can have at the same time this on the surface/atmosphere: Source: 2011 Temperature Roundup This in the upper 700 meters of the ocean: Source: ENSO Dominates NODC Ocean Heat Content (0-700 Meters) Data And this in the upper 2000 meters of the ocean: Source: Introduction To The NODC Ocean Heat Content Anomaly Data For Depths Of 0-2000 Meters How can a forcing warm the atmosphere and the land, while at the same time producing a much smaller upper ocean warming, and then producing significant warming in the deep sea? How can the heat had bypassed the upper ocean in the trip from the atmosphere to the deep ocean?
    0 0
  10. "How can the heat had bypassed the upper ocean in the trip from the atmosphere to the deep ocean?" It's only a concern if the mechanism for heat transfer was entirely conduction or general turbulence. We can knock out general turbulence immediately, the oceans do not behave like an earth sized washing machine. Conduction? Obviously an issue at various depths and places, but we already know that there are layers and specific places where the water temperature is very different from nearby waters. What's left? Convection. As soon as you allow for water at various depths to exhibit the same kinds of behaviour as air at various altitudes, it all makes sense. Winds, storms, hurricanes, tornadoes exhibit extreme versions of focused or funnelled transport of air at temperature differentials. Local features like hills, mountains, seasides promote consistent winds, or lack of them in some valleys, and temperature profiles. Translate these various features into 'water language' and it's not so hard.
    0 0
  11. adelady@60: Do you have any papers showing this? That the "water language" is similiar to atmospheric functions? The sheer difference in density of mass difference would indicate a HUGE energy differential required.
    0 0
  12. 59, Peru,
    How can the heat had bypassed the upper ocean in the trip from the atmosphere to the deep ocean?
    One of your problems comes from the way you phrased this question. You make it sound like the system is a simple path for heat from atmosphere to upper ocean to deeper ocean. It's obviously far more complex than that.
    0 0
  13. Sorry camburn, there are probably lots. But what came to my mind was something I read about flying. It referred to old-fashioned clunky type smaller planes of, from memory, 50s vintage. The instructor's words were that it was easier to control a plane in bad weather if you 'saw' yourself as swimming, diving or surfacing in currents, tides or waves.
    0 0
  14. One more question: The upper ocean warmed during the 1970s-1990s period together with the land+atmosphere. Then in the 2000s the strange pattern of warming deep oceans despite non-warming upper ocean began. At the same time, the atmosphere and the land surface continued to warm steadily. What changed during the 2000s?
    0 0
  15. What changed during the 2000s? Little to nothing. It's barely ten years. You need at least another 7-10 years of the same before you could even _begin_ to detect anything different going on.
    0 0
  16. Actually, from a solar plumbers perspective, convection is harder to swallow than conduction or turbulence. I make my living on water stratification - hot water is more buoyant than cold, thus water heater can deliver almost the entire contents of the tank (cylinder) as the cold water is added at the bottom. We use variations of this trick endlessly to maximize the output of solar thermal systems. However, my earliest design required multiple storage tanks, but only one tank that was exchanging heat with the loads. So I circulated the water, thus moving the heat energy (I think of it as a conveyor belt). And that is the model that I think is more helpful to understand how the heat "bypasses" the upper ocean. It doesn't really, it is an artifact of an incomplete measurement system (ie not enough sensors) and the fact that the heat energy is only sinking in certain areas (and lots of heat is going down in those areas). Conduction and convection (ie a warmer liquid rising and a colder liquid falling due to density), in the absence of turbulent system, don't move heat down in water. But ocean currents that are sinking can carry hot water down with them - and that is the mechanism that explains both how heat gets to the lower ocean at all, and why it isn't uniform (and thus appears to bypass the upper ocean). I should point out I don't have any papers to back up this view - just my livelihood.
    0 0
  17. From Peru - How can a forcing warm the atmosphere and the land, while at the same time producing a much smaller upper ocean warming and then producing significant warming in the deep sea?" That's not correct. The upper ocean, the top 700 meters, has warmed considerably through the noughties, although most likely at a slower rate than the 1990's. A part of the problem is the switch over from the less precise XBT-based system to ARGO. See SkS post: Search For 'Missing Heat' Confirms More Global Warming 'In The Pipeline' and pay particular attention to figure 2: Note how the warming rate abruptly shrinks after 2003, when the more precise ARGO data makes up the majority of ocean temperature measurements. It suggests that a large portion of the apparent slower heating rate isn't actually real, but a consequence of moving from one system to another. So does that mean there was no slowing of the ocean warming rate? I don't believe so. This is apparent in the thermal component (expansion) of sea level rise. The rate of ocean warming still appears to be lower than the 1990's, but the recent paper Jacob (2012) indicates the melting of land-based ice may be smaller than previously thought, and therefore the estimates of thermal expansion may have to be revised upwards. Volcanic aerosols (Solomon (2011), and the downward part of the solar cycle would have also contributed to a slower rate of ocean warming through the noughties, and Asian aerosols (pollution particles) may also have played a part. Still awaiting papers to be published on that. At some point through this ocean warming process we should expect the warming in the subsurface layers to exceed that of the surface layers, because earlier warm periods in Earth's history had surface-to-deep ocean temperature gradients much smaller than today. Of course I'm assuming that such a trend is typical of all warmer periods, it may not be, but so far it seems to be headed in that direction.
    0 0
  18. From Peru - "What changed during the 2000s?" ARGO came along. With its greater precision we now have the capacity to see what is going on in the individual layers. It would take a very detailed re-analysis of the old data, and removal of errors & bias, to ascertain whether this divergence between the 0-700 meter and 0-2000 meter layer in the 'noughties' is in fact a novel feature.
    0 0
  19. Adelady, that instructor was correct. Most people approach airplanes from their exeperience driving cars but they are much more similar to boats. They move in a fluid. That was a major message I tried to pass on to my flight students. It applies in all conditions, not only bad weather. Another important message was that one should not find himself in bad weather if applying proper decision making...
    0 0
  20. RobP#67: "the warming rate abruptly shrinks after 2003, when the more precise ARGO data makes up the majority of ocean temperature measurements." If you are suggesting that the change in rate is due to the changeover in data acquisition systems, wouldn't it be better to say 'the warming rate apparently shrinks'? But even that case in not well-supported by the error bars in your figure b: On the more recent data, uncertainty appears to be ~3x that of the older data. Are we able to show a statistically significant difference between, for example, the central NODC bar of 0.5+/-0.2 (early) and 0.1+/-0.6 (later)? This combination of 'surface temperatures stall' and 'ocean heating slows' seems to be the message we hear from the opposition. A better message could be phrased: Thermal cycles in the oceans are as yet not completely measured; we do know they have the capacity to mask and delay what we see on the surface by storing large quantities of energy. Despite that, as FR2011 show, there's been no change in the underlying atmospheric warming rate. And thus we really should be worried what will happen when that heat comes back to see us, especially since even the la Nina years keep getting warmer.
    0 0
  21. Muon - of course I'm jumping the gun, the length of the record, as discussed in that post, isn't long enough to to say definitively. But the error bars will reduce as the length of observations grows, that much is a gimme.
    0 0

Prev  1  2  

You need to be logged in to post a comment. Login via the left margin or if you're new, register here.


The Consensus Project Website

THE ESCALATOR

(free to republish)


© Copyright 2024 John Cook
Home | Translations | About Us | Privacy | Contact Us