Climate Science Glossary

Term Lookup

Enter a term in the search box to find its definition.

Settings

Use the controls in the far right panel to increase or decrease the number of terms automatically displayed (or to completely turn that feature off).

Term Lookup

Settings


All IPCC definitions taken from Climate Change 2007: The Physical Science Basis. Working Group I Contribution to the Fourth Assessment Report of the Intergovernmental Panel on Climate Change, Annex I, Glossary, pp. 941-954. Cambridge University Press.

Home Arguments Software Resources Comments The Consensus Project Translations About Support

Bluesky Facebook LinkedIn Mastodon MeWe

Twitter YouTube RSS Posts RSS Comments Email Subscribe


Climate's changed before
It's the sun
It's not bad
There is no consensus
It's cooling
Models are unreliable
Temp record is unreliable
Animals and plants can adapt
It hasn't warmed since 1998
Antarctica is gaining ice
View All Arguments...


Username
Password
New? Register here
Forgot your password?

Latest Posts

Archives

Visual depictions of Sea Level Rise

Posted on 3 March 2010 by Peter Hogarth

Guest post by Peter Hogarth

Even many critics would agree that global sea levels are currently rising, regardless of recent scrutiny and revision of estimates of predicted sea level rise. As pointed out previously, predicting sea level rise is tough. The National Oceanic and Atmospheric Administration (NOAA) puts it neatly, “To make predictions, we need knowledge. To gain knowledge we need observations”. However a recent claim disputes that current sea levels are rising significantly. Is it possible to verify or falsify this statement by looking at observations and data from the scientific community concerned with measuring sea level?

The answer is yes. Measuring sea level is now a multidisciplinary effort involving integration of observations from several global networks of hundreds of tidal stations, calibrated with vertical reference data from nearby GPS (Global Positioning System, which now use the American GPS, Russian GLONASS and European Galileo constellations of satellites) or DORIS (Doppler Orbitography Integrated by Satellite) stations, and data from several independent satellite based radar altimeters (recently Jason I, Jason II, and Envisat) which give complete global coverage, data on sea temperature and pressure from the ARGO floating sensors (which give information on temperature and salinity related variations in Oceanic volume), and most recently data from the satellite based gravity sensor GRACE (Gravity Recovery And Climate Experiment), which can give direct measurements of changes in mass of oceanic and land based water.

A 2009 review by Merrifield et al of the GLOSS (Global Sea Level Observing System) gives some indication of the large number and variety of organizations and workers involved. These measurements are complementary as well as providing independent cross validation checks on any individual data set, and many teams independently process raw observations to derive sea level data. This has enormously improved our knowledge of estimated sea level rise at global and regional level over the past 20 years, with continual refinements of estimates, as well as reductions in uncertainties from the centimetric level to sub mm level.

What are the conclusions from these efforts? Recent reviews (Cazenave et al 2009, Cazenave and Llovel 2010) show that the most up to date estimates of mean rate of sea level rise for the 20th century are converging on around 1.7 to 1.8mm/year, with uncertainties of around 0.2 to 0.3mm. (Ablain 2009, Church 2008, Engelhart 2009, Jevrejeva 2008, Leulette 2009, Merrifield 2009, Woppelmann 2009). The small differences between reported figures are mainly due to the different Glacial-Isostatic Adjustment (GIA) model or GPS based corrections that are used for the tidal stations, and extrapolating current knowledge of these vertical velocity corrections backwards to before the absolute GPS corrected data was available.
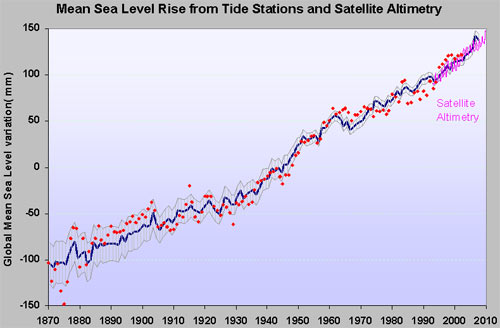

Figure 1: Global corrected tidal station data (Church 2006 updated to 2009-dark blue, and Jevrejeva 2008- red)

Most recently, corrected tidal station data from the satellite altimeter period of 1993 to 2010 is in good agreement (within the error budget) with the satellite altimeter data, which gives 3.3mm/year ±0.4mm once GIA corrections are added. These values are considered “robust”. The overall message is clear. Sea levels are rising.
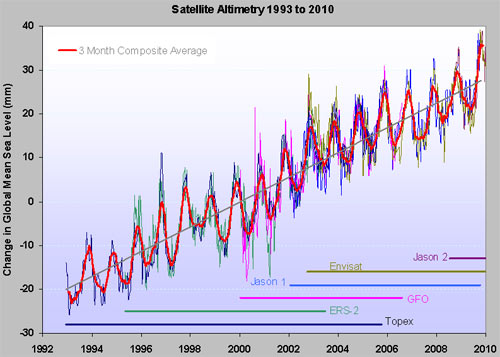

Figure 2: Data from all satellite altimeters and 3 month composite average. The seasonal variations have been retained (trend 2.83mm/year, GIA correction would add another 0.2 to 0.5mm/yr)

Both tidal station data and altimeter data show decadal and shorter term variations in the rate of rise, but there is a significant weight of evidence of a recent acceleration in rate of sea level rise towards the end of the last century (Jevrejeva 2008, Merrifield 2009, Vermeer 2009), whilst the “slowing down” reported by some observers (around 2008) has proved short lived (judging from 2009/2010 data).

It has also now become possible to attempt to “close” the sea level budget, which has components of reported thermal expansion of the volume of water due to increase in accumulated heat energy, and also an increased component from melting ice from land based sources. Again refinements and corrections of recent datasets from GRACE (with GPS) and ARGO resolve previous and relatively recent difficulties, so that the sum of these climate-related contributions (2.85 ± 0.35 mm per year) is now comparable with the altimetry-based sea level rise (3.3 ± 0.4 mm per year) over the 1993 to 2007 period (Cazenave 2010, reporting a consensus of the Ocean Observing Community).

Using these datasets it is estimated that around 30% of the observed rate of rise over the satellite altimeter time period is due to ocean thermal expansion and 55% results from accumulated melting land ice. There is evidence that the land ice melt contribution has increased significantly over the past five years.

The Satellite altimetry data is also truly global in extent, allowing estimates of recent sea level rise to be made for open ocean or areas not served by calibrated tide gauges. The distribution of higher than average historical rises (up to 10mm/year) in sea level reported from many tidal stations, whilst other tidal stations consistently reported reductions in sea level, is verified by the altimetry data, but a much more complete and complex picture emerges, of dynamic changes of sea level and local regions of high and low average sea level rise.
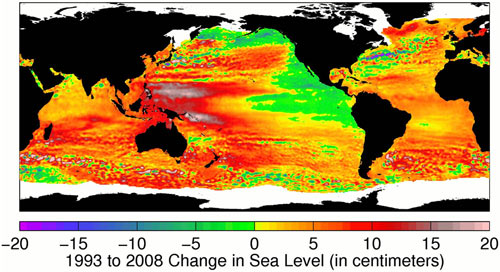

Figure 3: Sea level changes between 1993 and 2008 from TOPEX/Poseidon, Jason-1 and Jason-2 satellite altimeters. The oceans are colour coded for changes in mean sea level. Yellow and red regions show rising sea level, while green and blue regions show falling sea level. White regions are missing data during parts of the year. On average the global sea level is rising, but complex regional variations are superimposed on this. Credit: Data products from Ssalto/Duacs, distributed by Aviso, with support from CNES.

The correlation with variations in Sea Surface Temperature and also with PDO, NAO, El Nino and La Nina events is marked, and the influence of Westerly equatorial ocean currents and other currents and prevailing wind systems is also apparent. At a glance this confirms and explains for example the discrepancy between data from tidal stations on the Western and Eastern Coast of the United States and the fact that even GIA corrected data from Alaska shows local reductions in sea level over much of the record. This answers a point many observers make such as "why has my local sea level not shown an increase?"

The dynamic nature of sea level variations can be best visualised by time sequence animations of the Topex, Jason I and Jason II global data sets (NOAA Laboratory for Satellite Altimetry).

The following shows 3-D sea level variations with colours representing sea surface temperatures during the El Nino over 1997 to 1998 (NASA/Goddard Space Flight Center Scientific Visualization Studio).

These yearly rates of sea level rise may appear small compared with daily tidal variations of up to 8m (eg - Bay of Fundy) or even the average wave height in open waters(!). However, while the steady and gradually accelerating increase since pre-industrial times of around 30cm or a foot may appear manageable, if the recent trend of accelerating mass loss from Greenland and Antarctic Ice caps, as well as the world's glaciers continues, then the potential sea level rises will have significant impact on humanity. The weight of peer-reviewed evidence for this acceleration in sea level rise is robust.

0 0

Printable Version  |  Link to this page

Comments

Prev  1  2  

Comments 51 to 79 out of 79:

  1. How do they position the height of satellites anyway?
    0 0
  2. RSVP, you can find a general discussion on satellite positioning here
    0 0
  3. HumanityRules at 11:10 AM on 4 March, 2010 My apologies, I forgot the Nerem 2009 link in 48. https://abstracts.congrex.com/scripts/jmevent/abstracts/FCXNL-09A02a-1728088-1-OceanObs2009cwp_final.pdf
    0 0
  4. #49 Peter Hogarth at 20:54 PM on 5 March, 2010 "as it stands is fundamentally flawed" Yes, I realize it is. The change in LoD caused by steric sea level change is negligible at first approximation. The steric part of the figure I have calculated should be multiplied by the ratio of depth with temperature change (1000 m?) and Earth's radius. It makes it more than three orders of magnitude smaller, microseconds instead of msecs. For eustatic rise (when water mass is changing), this is not the case. However, effect on LoD depends on latitude of source. If landlocked watermass makes its way into the ocean from latitude fi, actual delta_LoD is proportional to 1-1.5*cos(fi). Latitude 48 11 (N/S) is neutral, water from here has no effect on LoD. Poleward from there the coefficient is positive, increasing. At southern tip of Greenland (60N) it is 0.25, goes up to 0.8 for Norhern fringe (82N). Uneven latitudal distribution of landmasses can modify this relationship somewhat. Observed drift of pole is also a limiting factor, needs further care. Mass contribution to sea level rise, if any, should have been balanced between low and high latitudes. There was not much ice in temperate zone & tropics, so it is a limiting factor. As for steric rise, if half of 20th century rise (~10 cm) is attributed to thermal expansion and it occurred in the upper 1000 m of ocean, temperature rise should have been close to 1K (thermal expansion coefficient of water is ~10^-4 in realistic temperature range). To warm up 10^6 kg water by 1K, 4x10^9 J is needed. It can be supplied by a constant global 1 W/m^2 excess flux, concentrated to the oceans for a century. Way too much for last century, therefore considerably less than half of supposed rise could be steric. #40 Jeff Freymueller at 16:03 PM on 5 March, 2010 "the coordinate system itself does not deform due to plate tectonics" The coordinate system used by TOPEX/POSEIDON/JASON does deform and not just because of plate tectonics. It is linked to a set of only 64 tide gauges. Marine Geodesy, 27, 79–94 Calibration of TOPEX/Poseidon and Jason altimeter data to construct a continuous record of mean sea level change Leuliette, E., R. Nerem, G. Mitchum, 2004 see 2.2 Tide Gauge Calibration (pp. 9), especially the part on Douglas rate. Satellite datasets are dependent on it, GPS & DORIS calibration just "should be used at every gauge, and work along these lines is proceeding". At the moment slope is based on a single global assessment (Douglas, 1997) and historic rates of gauges. Would like to see GRL A reassessment of global and regional mean sea level trends from TOPEX and Jason-1 altimetry based on revised reference frame and orbits B. D. Beckley, F. G. Lemoine, S. B. Luthcke, R. D. Ray & N. P. Zelensky Unfortunately it is behind a paywall. I could set up a university proxy and have a look of course, but I don't do that. IPR (Intellectual Property Rights) is a devastating thing when applied to science. On a public site, in public debate only publicly available material should be used. In fact it should be that way for each & every scientific publication.
    0 0
  5. #54, Berényi Péter I do satellite positioning for a living. You are confusing the coordinate system with the tracking network. The tracking network deforms, the underlying coordinate system does not. The tracking network is a means of accessing the coordinate system, not the system itself. The context of the Leuliette paper is that earlier work (like Douglas) simply omitted all tide gauges that were thought to have vertical motions. This may be fine for the global rate, but leaves large swaths of the globe (like the North Pacific) with no tide gauge data, which causes problems at the regional scale. Here's the abstract of the Beckley et al. paper, which you can access for free (as you know): Mean sea level trends from TOPEX and Jason-1 altimeter data are recomputed using unified geophysical modeling and the new ITRF2005 terrestrial reference frame for the entire altimetric time series, with consistent orbits based on satellite laser ranging (SLR) and DORIS tracking data. We obtain a global rate of 3.36 ± 0.41 mm/yr over the 14 year period from 1993 to 2007. The regional sea level trends computed with the new reference frame show significant north/south hemispherical offsets of ±1.5 mm/yr relative to trends based on the previous 1995-era frame. Regional sea level trend comparisons for the time periods of 1993–1999 and 1999–2005 reveal strong basin-scale polarities and pronounced inter-decadal variability, with a relative increase in the global mean sea level trend of 1.5 ± 0.7 mm/yr in the latter seven years. As for the "paywall", your objection is over-the-top given that you could buy this article for $9 from AGU if you wanted, and if you email one of the authors they will almost certainly email you back a PDF if they don't already have a preprint version on their website. It is hardly locked up. If there is a research university where you live, you don't even need to set up a proxy. You should be able to walk into the library, go to the journals section, and make a xerox copy of the article for just the cost of xeroxing. Or if you are really serious about things, you can join AGU for $20 a year (only $7 if you are a student, I think) and get a cheap personal subscription (very cheap for complete access to all back issues of all AGU journals). I view it as a subscription that provides the revenue that allows a non-profit scientific society to continue to publish and function. If you want all published articles to be available for free, I would not mind at all, but somehow at least non-profit scientific publishing has to remain viable, and nobody pushing free access has proposed a believable way to do that. I don't really care what happens with the for-profit publishers; they are the ones who charge very high prices for subscriptions and individual papers.
    0 0
  6. 51.RSVP at 22:02 PM on 5 March, 2010 How do they position the height of satellites anyway? 52.Riccardo at 23:36 PM on 5 March, 2010 RSVP, you can find a general discussion on satellite positioning "here" Riccardo I went "there" (ie NASA), and they explain that they use microwave altimeters, computers, etc., all good to determine how far up the satellite is. That was not my question. I guess its a chicken and egg thing. How do you know how much the sea has risen or dropped if all you know is how far away you are from the Earth (even if you know to within 1 mm)? Especially when satellites are continually losing altitude and requiring repositioning?
    0 0
  7. #56 RSVP. If you know the position of the satellite, and the distance from the satellite to the sea surface, then you know the position of the sea surface. So mainly you are asking about the first part. The two most important parts of determining the satellite orbit are the earth's gravity field, and the speed of light. Satellites can't wander about -- they obey the equations of motion subject to particular forces: earth's gravity field, solar radiation pressure on the satellite, etc. You integrate the equations of motion from a set of initial conditions, and then adjust the initial conditions (and, if needed, elements of the force model for drag, radiation pressure, etc) in order to fit data. The data here are your tracking data -- the satellite may have an onboard GPS receiver, or DORIS transponder, or a laser-ranging retroreflector. But you are measuring the distance between the satellite and various ground and/or space-based sites, and using this series of observations to estimate the satellite orbit.
    0 0
  8. Jeff, just to elaborate on your points a little, am I correct in stating that Jason 2 (for example) has all three tracking systems, (Dual GPS receivers, DORIS, and Laser ranging reflectors) and they are all independent? I know many of the 50 or so DORIS base stations are co-located (on the Earths surface) with GPS stations - some near tide gauges, and some of the handful of Laser Ranging stations are also co-located. The GPS receivers allow very high accuracy tracking of the altimeter satellites using the in view constellation of GPS satellites independent of the ground station data. Is it the case that tide stations and altimeters are ultimately independently locked into the GPS reference frame (for starters)? This detail is stretching my knowledge a bit thin...
    0 0
  9. #58 Peter Hogarth, I am pretty sure that Jason 2 has all three, although I would have to look it up. I don't know if every group that estimates orbits for Jason uses all of the available positioning systems, or if people use different combinations. Certainly you can use just one, and it is done to check that all are consistent with each other. The time series of positions for the ground stations that go into the ITRF definitely are produced independently. Each technique's solution is also a combination of multiple analyses. For example, the GPS time series for ITRF2005 was based on a combination of 7 separate analyses using 6 different software systems. Many of the DORIS stations are co-located with GPS, SLR, and/or VLBI stations (the general rule is that almost everything is co-located with GPS, because it is so relatively cheap). There are an increasing number of co-locations with tide stations (mostly with GPS), and the goal is to link together all of these systems.
    0 0
  10. Peter, yes Jason 2 has all three. The link below includes a drawing: http://www.nasa.gov/mission_pages/ostm/spacecraft/index.html
    0 0
  11. Berényi Péter at 02:16 AM on 6 March, 2010 I appreciate the need to dig deeper into the data underneath the visualisations in this post, and then question the validity of the data in an objective way. Is the weight of independent evidence presented above enough to address your doubts about absolute accuracy of the altimeters (tracking them, as well as altimeter data)? To provide some relief from all the diverting details of satellite technology, and some historical context, I offer the following link (free) which discusses global sea level estimates and science 30 years ago - before satellites were really contributing. The latest tide station and altimeter data really is "robust" in relative and absolute terms, but it can be argued that it has refined rather than significantly revised the global 1980 conclusions (at least in this paper). http://www.ncbi.nlm.nih.gov/pmc/articles/PMC350421/pdf/pnas00499-0031.pdf Emery 1980
    0 0
  12. Charlie A (#39) and others wonder about AGW and the rises seen in The Jenreva chart in comment #14. There is a striking similarity to the temperature rise in the arctic as in the recent report ( Kaufman et al. Science 2009): the temperatures are found to rise from about 1800, as does the sea-level. The temperature rise is, of course, attributed to AGW. (Sorry for the mishandled tags giving faulty posts above...)
    0 0
  13. Ian Love at 23:14 PM on 8 March, 2010 Kaufmann made a number of minor corrections, latest Feb 2010 but chart doesn't change much:
    0 0
  14. #62 Ian Love addresses some of my questions from #39 where I note that the sea level rise and acceleration in rate of rise dates back to 1700-1800. He says "( Kaufman et al. Science 2009): the temperatures are found to rise from about 1800, as does the sea-level. The temperature rise is, of course, attributed to AGW." Unfortunately, I do not have access to the paper since it is behind a paywall. Could you summarize briefly the anthropogenic effect that caused warming back in 1700-18000 period. Was it due to CO2 emissions ?
    0 0
  15. Péter Berényi, I think you should read this: Mitrovica et al. (2006). It revisits your Walter Munk "enigma" reference.
    0 0
  16. Thanks Martin. I have already figured this out. If 20th century melt was not polar, but mid latitude soot blackened glaciers, it would not have any measurable effect on Length of Day.
    0 0
  17. #55 Jeff Freymueller at 02:49 AM on 6 March, 2010 "I do satellite positioning for a living" Wow. In that case I have only questions. How rigid the satellite based coordinate system is? Accuracy? Precision? How recalibration is done? How clocks are synchronized in a rotating frame? Assuming accuracy of coordinates is better than 1 mm (relative error is on the order of 10-10), "solid" Earth is still extremely mercurial on this scale. When we are talking about "sea level rise" it is not meant to be relative to some external reference frame but to "average coastal elevation". How this latter quantity is measured? I would have a lot to say on the IPR thing as well, but don't want to be off-topic that much.
    0 0
  18. Jeff, I have found the answer to the clock synchronization question. Amazing. Relativity in the Global Positioning System by Neil Ashby However, I am still interested in how it works in practice. Looks like precision of position measurement is several centimeters. How do you measure velocity signals on the order of 10-10 m s-1 and frequency below nHz range immersed in a high frequency noise of much bigger amplitude?
    0 0
  19. @ Berényi Péter "When we are talking about "sea level rise" it is not meant to be relative to some external reference frame but to "average coastal elevation". How this latter quantity is measured?" If one is trying to figure out how much increase in volume in the sea has taken place, for example due to steric expansion and meltwater addition to the oceans, then one wants to reference to the bottom of the ocean. For this, one applies the Global Isostatic Adjustment of about 0.3mm/yr. If one is interested in relative sea level to coastlines, then one must adjust for the local elevation changes of the land. Or if one is just looking at global changes on the average, then one uses sea levels without the glacial rebound or global isostatic adjustment. Using this type of reference, the global mean sea level rate-of-rise is about 0.3mm/yr less.
    0 0
  20. @Berényi Péter -- See the webpage http://www.aviso.oceanobs.com/en/news/ocean-indicators/mean-sea-level/altimetry-data-and-images/index.html In the download options box, check the Time Series box and the Global Isostatic Adjustment option is enabled. That website probably has the answers to many of your other questions.
    0 0
  21. Charlie A at 17:07 PM on 9 March, 2010 Concentrating on the gentle start of rise in sea level from about 1800, this is attributed to warming. A recent paper examines the causes: Anthropogenic forcing dominates sea level rise since 1850 Jevrejeva, Grinsted and Moore 2009 “We show that until 1800 the main drivers of sea level change are volcanic and solar radiative forcings. For the past 200 years sea level rise is mostly associated with anthropogenic factors. Only 4 ± 1.5 cm (25% of total sea level rise) during the 20th century is attributed to natural forcings, the remaining 14 ± 1.5 cm are due to a rapid increase in CO2 and other greenhouse gases”.
    0 0
  22. It is interesting that in the 1980 report (#61, Peter Hogarth) the author discards all the tide gauge stations that do not show any significant trend, and keep those 247 stations out of more than 725 stations that do.
    0 0
  23. Argus at 03:22 AM on 12 March, 2010 Have a quick re-read of the report: "Of the records for more than 725 tide-gauge stations, most were too short, too interrupted, and too irregular for use in this investigation." Most (I interpret this as more than half?) of the records were discarded on these grounds. Clearly there were many issues with the data then and the authors do discuss these. However my point was to indicate how far the measurement technology and precision has moved on in 30 years.
    0 0
  24. Peter Hogarth: It has also now become possible to attempt to “close” the sea level budget, which has components of reported thermal expansion of the volume of water due to increase in accumulated heat energy, and also an increased component from melting ice from land based sources. Again refinements and corrections of recent datasets from GRACE (with GPS) and ARGO resolve previous and relatively recent difficulties, so that the sum of these climate-related contributions (2.85 ± 0.35 mm per year) is now comparable with the altimetry-based sea level rise (3.3 ± 0.4 mm per year) over the 1993 to 2007 period (Cazenave 2010, reporting a consensus of the Ocean Observing Community). Using these datasets it is estimated that around 30% of the observed rate of rise over the satellite altimeter time period is due to ocean thermal expansion and 55% results from accumulated melting land ice. There is evidence that the land ice melt contribution has increased significantly over the past five years. For about five years, the skeptics have argued both that the ice sheets aren't melting quickly, or even melting at all (in the case of Antarctica), while at the same time using Argo data to argue that the OHC has leveled off. I always found this a weird combination of claims, since the data is clear that SLR continues. If the ocean isn't heating, then the ice sheets and glacier would have to melting at an unbelievable rate. Or conversely, if the ice sheets weren't melting, then the ocean heating is just as unbelievably high. The only way to explain SLR is to use a both ice fairly high sheet melt and fairly high ocean heating. No other combination works. Your quote of 30% of SLR due to ocean heating and 55% due to melting land ice, while at the same time claiming these rates are consistent with SLR, is the first I have seen these numbers. But that still leaves us with a couple of problems... Assuming the planet's net energy imbalance isn't changing dramatically (without volcanic or solar changes), and SLR over the last 12 years is roughly the same rate as the last 30 years, then the ocean heating must be relatively constant. If land based melt is increasing dramatically, then the ocean heating rate must be falling dramatically; otherwise the rate of SLR would be increasing. So I am having a bit of a hard time understanding the statement of how land based ice melt is increasing is consistent with the rest of the analysis. It would help if I knew what the likely error band is for the 30% and 55% figures. Is it possible that long term ocean heating would be responsible for 50% instead of 30%, and more recently this has dropped to only 35-40% instead of 30% as this report suggests. I am just having a difficult time figuring out how the rate of ocean heating could swing as much as you seem to be suggesting. To look at it in slightly different way: If land based melt is increasing, then this is bad because we should begin to see even higher rates of SLR as the ice sheets become more and more unstable. But if land based melt is less than 55% as suggested here, then the ocean heating is much higher, which means the planet is heating much faster. As bad as increased ice sheet melt, the idea that the ocean heating is heating fast enough to explain 50% or more of SLR is even scarier. Attributing SLR and proportioning SLR to these two causes is very important. I think Trenberth is right with oft misquoted and misunderstood comment " Its a travesty ..."
    0 0
  25. zinfan94 at 05:05 AM on 22 March, 2010 There are of course uncertainties in both the ice melt and the steric contributions, and the fact that these components account for around "85%" of sea level rise, and this is regarded as "within the error bars" indicates that the numbers you mention are reasonable. I have also seen a number of papers indicating a decreased contribution to sea level from land run-off, as more of the river systems are dammed, and more water is used for irrigation etc. I'll look for some global estimates of this. The general view seems to be that Ice melt contributions are going to increasingly dominate sea level budget.
    0 0
  26. Sea level rise relative to what? Consider the following imege pair: The first one is Figure 3 from the post above while the second one is something completely different. Still, the overall pattern is rather similar. How can that be? Well, Geoid Height (undulation) is a tricky concept. GPS satellites provide heights above a reference ellipsoid, usually GRS 80. This ellipsoid is supposed to be a fair overall representation of the shape of Earth in a sense that it would be the closest (least squares) approximation of the actual gravitational equipotential surface defined by average sea level over all the oceans. In reality, this ellipsoid is defined by a standard adopted by the XVII General Assembly of the International Union of Geodesy and Geophysics in 1980. As such, it is a "frozen" approximation. Neither its accuracy is better than that of pre 1980 measurements nor does it follow changes in the shape of Earth. One would think there must be a secular change in the parameters of the best fit reference ellipsoid, glacial rebound alone should produce such an effect. Mantle material deep down is moving poleward, with time making Earth a bit more spherelike. Using a fixed reference surface like GRS80 this effect is ignored. Anyway, we are not interested in sea level change relative to an arbitrary reference surface, but to some equipotential surface instead. On such a surface there are neither ups nor downs, everything is on the same level relative to everything else. If sea level rises relative to it, it should get to a level of higher gravitational potential, i.e. it goes up. As the gravitational acceleration is fairly constant, this potential difference can be measured in milimeters as well. How do we define such a surface? In principle it is simple. It is enough to determine vertical direction above each point on Earth by local gravimetry. The equipotential surface is the one having a normal vector with the same direction as the local vertical at each point. In practice small pathes of an equipotential surface can be constructed this way (useful for e.g. mining operations), but due to undersampling and error accumulation, over longer ranges this method is useless. The problem is that inhomogenities in Earth density have a direct effect on local "vertical" direction, so the real equipotential surface is rather crinkly. As we move up (and get farther from local inhomogenities) the surface tends to get smoothed out. Satellite orbits are only sensitive to low spatial frequency changes in the verical. So. If we fancy the equipotential surface as a sum of spherical harmionic functions, lower order harmonics can be estimated from satellite orbits, higher (more crinkled) ones can not. The result is a surface which is close enough to the actual equipotential surface, althogh its individual normal vectors can differ considerably from the local vertical direction. The shape of the surface having a nominal zero potential, that is the same as average sea level at a particular time (as far as it can be determined) is called the geoid. For practical purposes this shape is not defined by spherical harmonic coefficients, but by geoid heights (also called undulations) relative to the reference ellipsoid. The second map above depicts this representation. Undulations have a fairly large (almost 200 meter) range, many thousand times larger than supposed changes in sea level. They are known with a rather low accuracy as well (estimated errors are sevaral meters). There is no legitimate reason to be a correlation between undulations and local sea level trends. If we do observe one (as we do indeed), it can only be due to a poor job done by Ssalto/Duacs products in separating true sea level trends from other factors. See also Determination of Global Sea Level Rise and its Change with Time by Martin Ekman
    0 0
  27. New Moore Island is now No More Island. Disputed Bay of Bengal island 'vanishes' say scientists
    0 0
  28. Peter Hogarth at 19:58 PM on 22 March, 2010 Where does your second image come from? it seems to link to Monty Python?! I disagree that the overall pattern is "rather similar", apart from the land/sea boundaries. I see as many differences as similarities. I disagree that the Ssalto/NOAA/NASA/ESA/CSIRO etc data products are wrong, and I think you are again confusing reference frames, but this is forgivable. Do you really think the positioning guys have got it so wrong?
    0 0
  29. #78 Peter Hogarth at 08:55 AM on 25 March, 2010 "Do you really think the positioning guys have got it so wrong?" Yes, I do. It happens all the time when trying to detect a tiny little signal submerged in a sea of noise. In this respect it is the same story as all the other empirical proofs of AGW except CO2 trends for the last fifty years. Poor S/N ratio, urgent drive to see something, sophisticated filtering strategies, mirage. The image is linked to Interactive Geoid Computation page, you can verify this claim by clicking on it. It is created by James R. Clynch, a geodesy professor, retired now, while working for the Naval Postgraduate School. It is part of the OC 2902 Web Based Course Reference Material. The Monty Python thing is something completely different.
    0 0
  30. Berényi Péter, I'm not sure I understand your point in this comment. You suggest there is a qualitative similarity between areas with positive geoid/ellipsoid separations and areas with high sea level rise. Maybe there is, and maybe there isn't -- the southwest Pacific and northeast Pacific seem to show that, but then look at the Indian Ocean, or the east vs. west coast of South America. But even if there were a moderate correlation, so what? You assert "There is no legitimate reason to be a correlation between undulations and local sea level trends" but you don't give any justification for that claim. Keep in mind that both geoid height and SLR exhibit very high levels of spatial autocorrelation.
    0 0
  31. Berényi Péter at 21:33 PM on 25 March, 2010 I can only suggest your skepticism about GPS is groundless and would be quite worrying to the surveying/military/geodetics community world wide. Please think about the implications. You should re-read your original reference from Ekman 2000, chapter 4 about the then emerging science of vertical GPS measurements and then update it by 10 years by reading the references I and others have supplied, and continuing with your online course. Your comments about “same story” indicate that you have some belief system against AGW which you are using here to discredit high precision geodesy and GPS. This is not evidence based. You have also seem to have confused differences between Geoid and real Earths surface, (which I agree can be very large), and the absolute measurement error in these differences, which is small. I have first hand experience of modern precision GPS base stations as used for Real Time Kinematic work, such as vessel positioning and real time tidal or even absolute heave corrections of vessel motion. If I place such a system on the Earths surface, turn it on, and then look at the diagnostics, I can see the RMS vertical error gradually reduce and settle over a few minutes to cm level or better. This is reported as a difference to geoid measurement (WGS84 usually) but is ultimately referenced to the ITRF Geocentric frame and GPS orbital parameters as already discussed at length. The Geoid is merely a useful tool (for charting etc). Local chart vertical datums are another story altogether! I appreciate you are learning about Geodesy, but a learner should be cautious about making sweeping generalizations based on casual reading. The following is a practical short introductory guide to real world height measurement, and it is already slightly dated as the technology advances rapidly: Heighting with GPS: Possibilities and limitations. The section on manufacturers quoted accuracy should be noted. These are real systems in everyday use. I can supply more detailed references if you wish, but please take time to absorb first and comment later? I have designed non-GPS cm level long range precision positioning/tracking systems down to component level, and these sometimes rely on GPS for absolute accuracy and repeatability over long periods so I have some hard won knowledge of many of the issues I am trying to explain. I still do not consider myself an expert, though I hope you realise that I answer your points constructively with science modulated by rational thought. If I am allowed an off topic comment your conclusions on GPS are indeed “something completely different!”
    0 0
  32. OK. I have visited the University of Colorado at Boulder Sea level change site and downloaded Global mean sea level satellite data (Inverted barometer applied, Seasonal signal removed, 1993-2009). It looks like this: I have calculated least square fit quadratic. It turns out sea level rise is actually decelerating in this 16 years long period. Acceleration term is -0.108 mm/y2. If linear term is also considered valid and current trend is extrapolated, sea level rise should stop by 2030 (21 mm above current level). Beyond that time it would start decrease. By 2100 sea level would be some 25 cm lower than now, decreasing at a 7.5 mm/year rate.
    0 0
  33. BP, you should take a look at David Roper's site: Sea Level Versus Temperature He's not in sync w/you regarding his conclusions but I'm pretty sure you'll enjoy looking at his methods.
    0 0
  34. #83 doug_bostrom at 02:20 AM on 9 April, 2010 you should take a look at David Roper's site Done. Same silly curve fitting I was trying to make fun of.
    0 0
  35. Berényi Péter at 22:28 PM on 8 April, 2010 If you extrapolate your curve backwards in time what happens?.... the curve I fitted to sea level rise is a fit to observed data, rather than an extrapolation. Anyway, first you need to get hold of The latest satellite altimetry data, as Jason 1 data has not been updated on the Boulder site since late 2009. Jason 2 and Envisat altimeters are both currently active. Now do your trend, but extrapolate the trend plus error contributions as well. To emphasise the danger in your treatment of the data, take the Envisat data which starts late 2002. Fit a second order curve to this and extrapolate. Better start building your ark. I suggest that the correct interpretation is that the overall satellite record trend is statistically indistinguishable from a straight line, but we have to remember the errors, consider the tidal data that allows us to look longer term, and extrapolate carefully, taking all known information and driving factors into account. I’m not clever enough to do that, but I can say the trend over past 200 years is accelerating, the indications are that it will continue to do so, and point to the data and peer reviewed analysis to support this statement.
    0 0
  36. How is it possible that the sea level is rising in one part of the Pacific, and at the same time falling in another part? Over a 15-year period? Can anyone explain that? - I would rather believe that the measurements are faulty. Also, how can we trust satellites to measure the sea level with millimeter precision? These satellites probably lose many millimeters in altitude for each time they circle the earth (the ISS typically loses two meters per orbital period - two meters per month).
    0 0
  37. #86 The last sentence should end: - two *kilometers* per month.
    0 0
  38. Argus, not to come off sounding all superior but the designers and operators of these satellites as well as consumers of the data they produce do actually take orbital mechanics into account. If we could wish for anything, it would be for satellites to have been in orbit 200 years ago so we had a better, longer set of data. Longer temporal satellite coverage would help to resolve the kinds of ambiguity you mention regarding regional variances in sea level, most of which are real by the way.
    0 0
  39. Argus, I should have mentioned that if you follow this thread of discussion from the beginning you'll pick up a lot of information about how satellite altimetry readings are calibrated. In particular see Peter Hogarth's remarks.
    0 0
  40. The IPCC AR4 report projects a sea level rise for this century of 18-59 cm. While the edges of both Greenland's and Antarctica's ice caps have obviously melted a bit, this should balance out by the predicted increase in snow in the greater interior for both icecaps. It will take thousands of years of continuous warming for both of them to melt even at the present rate of emissions of CO2. By the way, these emissions are projected to peak by 2100 and then decline. There is no near term threat of unprecedented sea level rise.

    0 0
    Moderator Response:

    [DB] Umm, not so much.  Greenland has been losing ice overall, with the rate of loss increasing each year:

    Greenland

    With Antarctica losing ice in a similar fashion:

    Ant

    No one is saying that these great ice sheets will disappear overnight. But the negative effects on sea levels will become apparent far before then, causing great distress to coastal populations throughout the world.

    "By the way, these emissions are projected to peak by 2100 and then decline."

    Got a source for that?  Because as it now stands, with no firm limits on global GHG emissions in sight it has about a snowflakes chance in...

  41. According to Steven Goddard at Real Science, the Envisat data is showing a drop in sea levels.Does anybody have any information on this?
    0 0
  42. shibui Try this one.
    0 0
  43. adelady, thank you ... I'll have to think about the explanation.
    0 0

Prev  1  2  

You need to be logged in to post a comment. Login via the left margin or if you're new, register here.


The Consensus Project Website

THE ESCALATOR

(free to republish)


© Copyright 2024 John Cook
Home | Translations | About Us | Privacy | Contact Us