Climate Science Glossary

Term Lookup

Enter a term in the search box to find its definition.

Settings

Use the controls in the far right panel to increase or decrease the number of terms automatically displayed (or to completely turn that feature off).

Term Lookup

Settings


All IPCC definitions taken from Climate Change 2007: The Physical Science Basis. Working Group I Contribution to the Fourth Assessment Report of the Intergovernmental Panel on Climate Change, Annex I, Glossary, pp. 941-954. Cambridge University Press.

Home Arguments Software Resources Comments The Consensus Project Translations About Support

Bluesky Facebook LinkedIn Mastodon MeWe

Twitter YouTube RSS Posts RSS Comments Email Subscribe


Climate's changed before
It's the sun
It's not bad
There is no consensus
It's cooling
Models are unreliable
Temp record is unreliable
Animals and plants can adapt
It hasn't warmed since 1998
Antarctica is gaining ice
View All Arguments...


Username
Password
New? Register here
Forgot your password?

Latest Posts

Archives

Hansen's New Climate Dice - Hot, Loaded, and Misunderstood

Posted on 15 August 2012 by dana1981

James Hansen's newest paper, Perception of climate change, has been published in the Proceedings of the National Academy of Science (PNAS).  In January 2012, Michael Sweet examined the draft version of this paper prior to its review and acceptance by PNAS.  The paper links increased heat wave frequency and intensity to human-caused climate change.  As a result, it has generated a great deal of mainstream media attention, and also a number of misinterpretations and misrepresentations which we will examine in this post.

Hansen's Findings

Hansen et al. examined the surface temperature record to determine how the distribution of temperatures has changed over the past six decades.  As we know, the average global temperature has increased approximately 0.7°C over that period, so not surprisingly, the distribution of temperature anomalies has also shifted towards warmer values on average, as illustrated by the animation below and Figure 1.

Source: NASA/Goddard Space Flight Center GISS and Scientific Visualization Studio 

This changing temperature distribution is a wholly empirical result, and has also been observed by Donat and Alexander (2012):

"The results indicate that the distributions of both daily maximum and minimum temperatures have significantly shifted towards higher values in the latter period compared to the earlier period in almost all regions"

and

"...these changes have had the greatest impact on the extremes of the distribution and we conclude that the distribution of global daily temperatures has indeed become “more extreme” since the middle of the 20th century."

This was also shown by Meehl (2009), which examined how the ratio of hot to cold records in the United States has changed over the past six decades (Figure 1).

hot to cold ratio

Figure 1: Ratio of record daily highs to record daily lows observed at about 1,800 weather stations in the 48 contiguous United States from January 1950 through September 2009. Each bar shows the proportion of record highs (red) to record lows (blue) for each decade. The 1960s and 1970s saw slightly more record daily lows than highs, but in the last 30 years record highs have increasingly predominated, with the ratio now about two-to-one for the 48 states as a whole.

This main conclusion that we are seeing more and stronger heat waves as a consequence of global warming is a clear, expected, empirical result which we would hope nobody will dispute.  The controversy comes in when these results are used to try and attribute individual heat waves to human-caused global warming.

Extreme Heat Waves - Anthropogenic and Natural

Martin Hoerling of NOAA criticized Hansen et al. for attributing several heat waves to global warming in the abstract of their paper:

"we can state, with a high degree of confidence, that extreme anomalies such as those in Texas and Oklahoma in 2011 and Moscow in 2010 were a consequence of global warming because their likelihood in the absence of global warming was exceedingly small."

and in Hansen's related New York Times (NYT) op-ed:

"The change is so drastic, the paper says, that scientists can claim with near certainty that events like the Texas heat wave last year, the Russian heat wave of 2010 and the European heat wave of 2003 would not have happened without the planetary warming caused by the human release of greenhouse gases."

Hoerling responded in a seperate NYT interview by stating that he had previously co-authored a paper which concluded that the Russian heat wave was largely a consequence of natural climate variability.  However, the paper in question is Dole et al. (2011), which contained some serious flaws, failing to account for a glitch in the Moscow July station temperature data, which saw an urban heat island correction erroneously applied, as discussed in detail by Stefan Rahmstorf at RealClimate.

Meanwhile the results of Hansen et al. are consistent with those of Rahmstorf and Coumou (2011), who concluded that the Moscow heat wave would likely not have broken the record without an assist from human-caused global warming.

"For July temperature in Moscow, we estimate that the local warming trend has increased the number of records expected in the past decade fivefold, which implies an approximate 80% probability that the 2010 July heat record would not have occurred without climate warming."

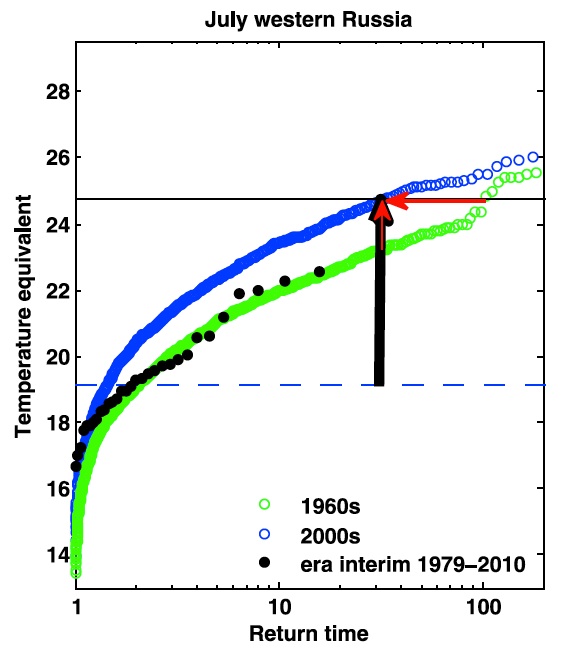
Otto et al. (2012) found that the Moscow heat wave was so intense that the human-caused warming alone could not account for it - in other words that it can be called "mostly natural".  However, they also found that the warming trend had caused a three-fold increase in the likelihood that the heat record would be broken (Figure 2); in that sense "supporting the assertion that the risk of the event occurring was mainly attributable to the external trend."

otto fig 4

Figure 2: Return periods of temperature-geopotential height conditions in the model for the 1960s (green) and the 2000s (blue) and in ERA-Interim for 1979-2010 (black). The vertical black arrow shows the anomaly of the Russian heat wave 2010 (black horizontal line) compared to the July mean temperatures of the 1960s (dashed line). The vertical red arrow gives the increase in the magnitude of the heat wave due to the shift of the distribution whereas the horizontal red arrow shows the change in the return period.  Figure 4 in Otto et al. (2012).

And Hansen's comments about the 2003 European heat wave are consistent with the results of Stott et al. (2004):

"we estimate it is very likely (confidence level >90%) that human influence has at least doubled the risk of a heatwave exceeding this threshold magnitude."

Drought Confusion

In his NYT interview, Hoerling claimed that Hansen's paper confused droughts with heat waves.  Patrick Michaels has also described Hansen's paper in similar terms:

"Hansen claims that global warming is associated with increased drought in the US....His hypothesis is a complete and abject failure."

It is a red flag when Patrick Michaels - who has become famous for deleting inconvenient data and distorting other scientists' results - agrees with your criticisms of another scientist's work.  It's an olympic-sized red flag when Anthony Watts also agrees.

Predictably, these claims are simply wrong, and entirely mischaracterize Hansen's paper, which focuses almost exclusively on temperature changes and barely even mentions droughts.  Watts' confusion came from this Associated Press article which does equate heat waves with drought several times.  However, nowhere in the article is Hansen quoted even mentioning drought.  Hoerling and Michaels may have confused Hansen's paper with his NYT op-ed, in which he said:

"Over the next several decades, the Western United States and the semi-arid region from North Dakota to Texas will develop semi-permanent drought, with rain, when it does come, occurring in extreme events with heavy flooding."

However, this comment came two paragraphs before Hansen began discussing his new paper, and note that the comment discusses future, not present droughts.  Hansen's comments on this matter are supported by the scientific literature, for example Dai (2010), which projects changes in the Palmer Drought Severity Index (PDSI), shown in Figures 3 and 4, concluding:

"Regions like the United States have avoided prolonged droughts during the last 50 years due to natural climate variations, but might see persistent droughts in the next 20–50 years"

Figure 3: PDSI 2030-2039. (Courtesy UCAR)

Figure 4: PDSI 2060-2069. (Courtesy UCAR)

Wehner et al. (2011) (related presentation here) arrived at similar conclusions, as did a new paper by Dai (2012)Joe Romm has a good roundup of relevant research.

Hoerling also quoted the IPCC Special Report on Managing the Risks of Extreme Events and Disasters to Advance Climate Change Adaptation (SREX) to support his point.  However, he quoted a section on floods instead of droughts.  Here is what the SREX says about US droughts in the next few decades:

"There is medium confidence that droughts will intensify in the 21st century in some seasons and areas, due to reduced precipitation and/or increased evapotranspiration. This applies to regions including...central North America".

Again, this is consistent with Hansen's comments.

Tamino on Variability

Tamino has pointed out that the change in the distribution of surface temperatures may not be due to increased variability, as Hansen et al. conclude, but rather simply due to a combination of different regions warming at different rates, and when their data are combined, the result looks the same as it would if temperature variability were increasing.  In other words, we don't know how much of the increase in hot weather events is due to weather becoming more variable, and how much is simply due to average temperatures becoming hotter.

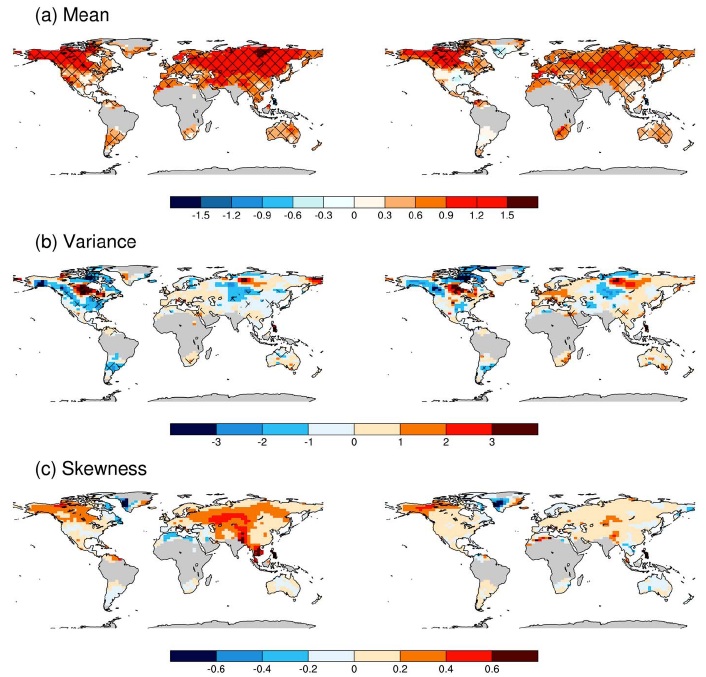
The results of Donat and Alexander (2012) lend some credibility to Tamino's comments regarding a lesser change in temperature variance, although they find that an increase in skewness (asymmetry) of the temperature distribution has probably contributed to the increased frequency of extreme heat events (Figure 5).

"The results indicate that the distributions of both daily maximum and minimum temperatures have significantly shifted towards higher values in the latter period compared to the earlier period in almost all regions, whereas changes in variance are spatially heterogeneous and mostly less significant.  However asymmetry appears to have decreased but is altered in such a way that it has become skewed towards the hotter part of the distribution."

donat fig 1

Figure 5: The differences in higher moment statistics of (a) mean, (b) variance, and (c) skewness for each grid box in HadGHCND for (left) daily minimum temperature anomalies and (right) daily maximum temperature anomalies for the two time periods shown. Hatching indicates changes between the two periods that are significant at the 10% level for the mean (using a Student’s t-test) and the variance (using an f-test) of the distribution. Figure 1 in Donat and Alexander (2012).

This is an issue we will be exploring in another post in the near future.  However, it does not impact the main result of Hansen et al., that global warming has caused extreme heat events to occur more frequently and to be more intense on average.  The question is more of a technical issue - whether the increase in extreme heat events is due more to an increased temperature variability, to the warmer shift in average temperatures, or to increased skewness in the temperature distribution.  In any case, human-caused global warming is responsible. 

More Mischaracterizations of Hansen et al.

In addition to the misrepresentation of Hansen's results from Michaels and Hoerling, Roger Pielke Sr. has endorsed an extremely poor critique of Hansen et al. by Mike Smith, which does not even address Hansen's new paper, but rather his 1988 paper, and does so by distorting reality as many others (including the aforementioned Patrick Michaels) have.  Hansen's paper created global warming projections based on three greenhouse gas emissions scenarios (A, B, and C).  Smith claims:

"Turns out that Scenario A turned out to be correct"

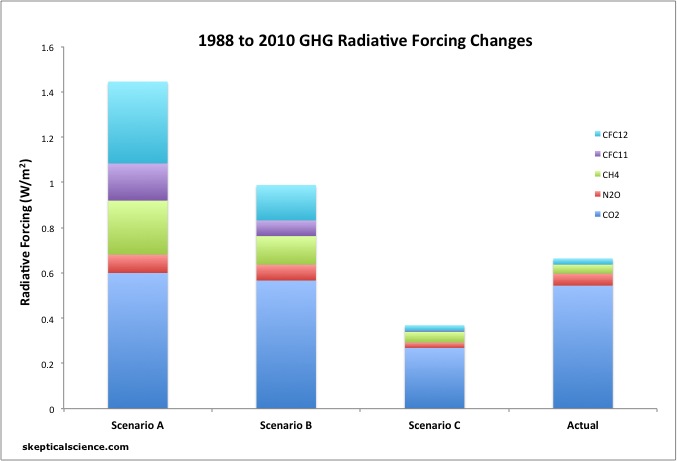
This is a false statement which we have debunked many times, most recently here, where we showed that Scenario A has actually turned out to be the furthest from reality (Figure 6).

updated GHG forcings

Figure 6: Radiative forcing contributions from 1988 to 2010 from CO2 (dark blue), N2O (red), CH4 (green), CFC-11 (purple), and CFC-12 (light blue) in each of the scenarios modeled in Hansen et al. 1988, vs. observations (NOAA).

Smith in turn (along with Watts, who also posted Michaels' strawman attack on Hansen et al.) endorsed another poor analysis of Hansen's work by Cliff Mass.  Mass grossly oversimplified the situation, for example trying to parse out what percentage of the heat waves could be attributed to global warming vs. natural variability by examining the mean annual temperature increase without recognizing that this increase varies over different seasons, different local regions, and possibly even different types of weather events.  A few people left good comments on Mass' post here and here, for further reading.

Mass generally misunderstood the arguments of Hansen et al. as well. In the end, Mass basically echoed part of the conclusion from Otto et al. (2012), that the heat waves could be described as "mostly natural".  However, the main point of Hansen et al. is that heat waves like those in Moscow, Texas, and Oklahoma will occur more frequently and on average be more intense than they would be without human-caused global warming.  As Tamino notes,

"Cliff Mass gives the impression that there’s nothing to worry about because our “3-sigma” events — the real killers — will only be one degree hotter, quite ignoring the fact that we’ll get 10 times as many of them."

Probability - the Language of Science

As the papers discussed here note, these issues boil down to probabilities.  Global warming has obviously made temperatures warmer, on average, which in turn has increased the odds of extreme heat events.  Hansen's argument is that without global warming, the probability of the Moscow and Texas and Oklahoma heat waves being so hot is so small, that it's safe to say that global warming was a contributing factor - that they would not have been as blisteringly hot in the absence of global warming. 

That's not to say that humans caused these heat waves - we didn't.  However, odds are very good that they wouldn't have been as hot or record-breaking without human influences, and human influences will also cause more frequent, hotter, record breaking heat waves in the future as global warming continues.

This is where the 'loading the dice' analogy comes in.  Hansen's point is that by increasing the average temperature, we are making the hotter temperatures more likely - effectively weighting the hotter values of the climate dice.  As a result, today's extreme heat will become the norm a few decades from now, just as what we considered extreme heat a few decades ago has now become much more commonplace.  As Tamino put it in a recent post:

"When a 3-sigma event happens, it’s a problem but we can deal with it and recover from it. When 10 (or more) times as many 3-sigma events happen … we have a problem.

That means we’re already in trouble. The really bad news is that we’re already in trouble from just the warming we’ve already experienced, but it’s going to get worse because it’s going to get hotter. You think the 2011 Texas-Oklahoma heat wave was bad? You think this year’s corn-belt heat wave was bad? You think the 2010 Russian heat wave was very very bad? You ain’t seen nothin’ yet."

Hot and Heavy Dice

To summarize, Hansen et al. showed that extreme heat events have become more common and more intense as a result of global warming.  While Hansen correctly noted in a NYT op-ed that droughts are expected to become more frequent in parts of the USA in the coming decades, aside from a brief discussion of the link between extreme heat and drought, Hansen et al. (2012) does not address droughts or attribute them to global warming.

Hansen et al. have shown that a number of heat waves such as the 2010 Russian event are very unlikely to have been as intense or record-breaking if humans weren't causing global warming.  Simply put, several recent heat waves have been so hot that the chances of a similarly intense heat wave happening several decades ago would have been very, very low.  We are loading the dice to make the chances of extreme heat waves happening much higher, which is why they are happening more frequently.

As Hansen et al. note, "public opinion about the existence and importance of global warming depends strongly on their perceptions of recent local climate variations."  This is undoubtedly why their paper has been the target of so many mischaracterizations by people who want public opinion to stay right where it is.

0 0

Printable Version  |  Link to this page

Comments

Comments 1 to 36:

  1. However, it does not impact the main result of Hansen et al., that global warming has caused extreme heat events to occur more frequently and to be more intense on average. The question is more of a technical issue - whether the increase in extreme heat events is due more to an increased temperature variability, to the warmer shift in average temperatures, or to increased skewness in the temperature distribution.
    Or to a combination of some or all of the aforementioned... In any case, human-caused global warming is responsible.
    0 0
  2. Bernard @1 - yes it will be a combination of effects, which is why I worded it 'whether the increase is due more to...'. We (specifically Kevin C) will be addressing that question in an upcoming post.
    0 0
  3. Looking at Figure 1 I was wondering if it is feasible and statistically valid to extrapolate from these data a projection of the further shifting of summer temperature anomalies into the future ?
    0 0
  4. Figure 1 is totally a blank to me ... though I can see four bell-curves at the bottom. The main rectangle is apparently empty.
    0 0
    Moderator Response: [DB] As Dana says below, possibly a plugin/browser issue (looks fine in FF 14). The URL for the animation is http://svs.gsfc.nasa.gov/vis/a000000/a003900/a003975/bell_final_comp.m4v.
  5. tony - I think you would probably have to answer the question regarding how much of the distribution is due to shifting means and how much due to increasing variance etc. in order to accurately extrapolate to the future (as well as knowing how much warming to expect). shoyemore - you may need some sort of plug-in to see the video, but it's essentially just an animation of the four bell curves below in Figure 1.
    0 0
  6. shoyemore On FF 14.0.1 here Figure 1 when right-clicked on indicates a Quicktime plug-in is required.
    0 0
  7. Tony #3, Not very scientific, but in the sense that any short curve can be approximated by a line, and projecting BAU, the eye-chronometer tells me that we will hit 20% land surface area covered by 3-sigma events (or greater) in about 25 years. Not much time all things considered.
    0 0
  8. Isn't it correct that the Russian heat wave of 2010, the US heatwaves of 2011 and 2012 as well as the miserable 2011 and 2012 summers for Northern Europe seem to have been mainly caused by the rather major changes in the jetstream, which is linked to the rapidly diminishing Arctic sea ice, whose disappearing act is very, very likely mainly due to AGW. Thus, I would think that the causal link between AGW and said heatwaves should be fairly solid?
    0 0
  9. dana1981, Lionel A & DB, The URL worked out and I saw the animation. Very impressive. Thanks.
    0 0
  10. I think Tamino has it. I think you can get the results that Hansen has if the cooler areas warm more than the warmer areas. Not that Hansen's results are inaccurate; I think you just have to understand them within the correct context. From a global context, the distribution has gotten hotter and flatter, which is what Hansen shows, but that does not imply that the change has to be spatially uniform. IDK, have to read his paper again, but it may be that is what he meant the whole time. Esop, I'm thinking 'yes', but there is more to it than that. The jetstream(s) pattern is determined by where the major convective patterns, Hadley, intertropical, and polar, meet at a downwelling. The latitude of the downwelling is affected by how long it takes to radiate off the energy gained at low altitude, and that is a function of GHG content, as well as how much energy is gained low altitude, which is affected by surface albedo. Someone please tell me if there is something wrong with my understanding. In any case, I can't see why anyone would doubt that an increase in energy content would manifest itself in the form of hotter temperatures, and you can't get hotter temperatures without shifting the distribution.
    0 0
  11. Just what is wrong with Cliff Mass's method of attribution can be seen by comparing it with a similar but statistically justified method as used in Otto et al, 2012. They calculate a mean increase in Moscow temperatures 1.9 times the GISTEMP 1200 km smoothed increase, or about 0.9 C for July. Using Cliff Mass's method of attribution, we would therefore attribute just 0.9 C of the 5 C anomaly in the Moscow 2010 heatwave to global warming. In fact, however, Otto 2012 shows an approximately 1.5 C increase relative to events of equivalent return interval in the 1960s as the Moscow heat wave had in the 2000s (as determined by models). That is, Mass's guesstimate would have been out by 40% for Moscow 2010. That does not mean it will be out by similar amounts for other heat waves. It may be out by smaller or larger amounts. Because of the crude nature of his method, we have know way of knowing in advance of a decent analysis just how much.
    0 0
  12. Esop, Yes, we have covered the Francis work here briefly at SkS. It is certainly worrying, but still on the cutting edge. What is worrying mostly is that even without the sea ice/jet stream connection we would still expect to see a shift in the distribution. It's more or less an 'Oh crap' thing. Since we have had blocking events and jet stream anomalies in the past, the shift in distribution will only make the weather within those events more extreme. If, and that's a big if at this point, those blocking events themselves are more extreme because of sea ice loss and Arctic amplification (and change the temperature gradient between temperate zones) then that is very alarming. And I'll leave it at that.
    0 0
  13. Bernard @1 - yes it will be a combination of effects, which is why I worded it 'whether the increase is due more to...'.
    Fair point dana. Mea culpa - I should paid greater attention to the adjectives!
    0 0
  14. Chris G: I've been working on this, and there are multiple confounding factors. But roughly speaking, if you correct for the change in local climatology over time, you still see broadening of the curve, but the broadening is reduced from ~30% to ~15%. Did Hansen get it wrong? The original paper was rather vague about what he was trying to measure, and he is measuring something meaningful, just not what Tamino or you or I expected. What he is measuring is precisely in line with his update however. That glosses over a lot of messy details. Dana and Tom want me to do a blog about it: They are probably right, but it's going to be dull and heavy. Against that I've got work pressures, and a much more important and exciting climate project which is just producing results.
    0 0
  15. For the doubting WUWT'ers here is hard data proof of the Hansen paper. Yesterday in Needles, CA when it was 118 deg F It RAINED. The rain was measured at 115 deg F - a world record The humidity was 11% - also a world record Previous world record was set on June 5, 2012 in Mecca, Saudi Arabia at a temp of 109 F Previous world record to that was Marrakech, Morocco on July 10, 2010 also at 109 F. Considering how far back such records go, just what do you think the odds of that was. A 9 deg F jump in a historical record only 2 months apart. Teh 3 hottest rains in history only 2 years apart. How many standard deviations out was that? The case appears to be closed. http://www.wunderground.com/blog/JeffMasters/comment.html?entrynum=2186
    0 0
  16. Wyoming (just north of me?), I appreciate your post, and your efforts; however, as this blog, among many other as scientifically robust, prove is that mere "facts" and "data" don't matter to WUWTers (I like that term!). If all it took was facts and data, we'd be well along a path of CO2 limitation. As it is, we're not. Kudos to all here who post (fight) the good fight. I simply cannot imagine being where the temperature of the rain approaches that of pain: here in Colorado, on the HOTTEST of days, if--IF--it rains, you'll freeze!
    0 0
  17. Followup on Tamino hypothesis: The increase in variation is even more apparent, if you look at the seasonal records, as was done in the first graph by Hansen. The NH mid-latitudes have cooled appreciably in the last 22 years in the NH winters. The cooling appears to be due to prolonged cold spells due to blocking events in the jet stream. If you remove the NH mid-latitude winter cooling from the records, the warming over the rest of the globe over the rest of the year, climbs over 0.20 deg C per decade, and the NH mid-latitude lands (where a lot of people live) are heated up by over 0.60 deg C per decade since 1979. In fact, the 3-season heating in the mid-latitude lands was so strong, it pushed the entire NH heating rate to about 0.40 deg C per decade during the spring, summer, and fall (See Cohen et. al. 2012, "Asymmetric seasonal temperature trends", Figure 3). The models have been spot on predicting the warming trend in the NH for these seasons, but blown the winter prediction (Figure 4). This information quite effectively silences much of the "lukewarming" promoters. The problem with lukewarming is illustrated by a comment of mine on another site: …
    Notice that even when we dilute the heat waves and cold waves across the entire NH mid-latitudes, the seasonal trends still show up. Only the NH winter mid-latitudes are heating less than forecast from the climate models. (and there seems to be a very good reason for that… think Arctic ice pack and NH snow cover). Now, most people would say, winters are currently getting colder with lots of cold spells, and summers are getting hotter with lots of heat waves, that ain't good! But not this site. Nah! That's just Lukewarming! (psst… wanna buy a mug?) After all, the chances the heating trend observed in the US over the last 13 months was a whopping 1 in 10, (oops, or maybe 1 in a 100,000… but not to worry, its clearly not one in a million or so!) Now most people who have one arm in a freezer, and their legs and other arm in an oven, would think there is a problem. But nope. According to this site, their average temperature is only rising 0.13 deg C per decade, instead of 0.20 deg C per decade, so its just Lukewarming! And the Midwestern farmers watch their fields die in the heat and drought. What can we tell them? You know: Its just Lukewarming! The uneven heating and variation is hiding a lot of useful, and worrying, information.
    0 0
    Moderator Response: [Sph] <blockquote> added for clarity.
  18. Thanks Dana good post. It is interesting that the mean is shifting a lot and the curve is flattening, a similiar thing has been noticed in the Indian Monsoon details. Is this pattern sort of a choatic shift pattern? As in when a choatic system approaches a shift in regime its variance increases and its self similiarity increases, which sort seems to be happening in several systems, e.g. Arctic Sea Ice melt time series. And therefore with the mean already shifted could all increasing weather extreme's (keeping in mind a 3SD cold event is know a 4SD cold event, so a 2SD cold event is a 3SD cold event), be a prelude to a regime shift? A shift to a Pliocene climate? Surely any chaotic energetic system will try and equalise itself in the quickest way possible? Just speculating, and things are bad enough already, but it does look more and more like a summer ice free Arctic is closer and closer, (2012 none optimum weather for melt, but record melting occuring), so does anyone have a low down on what an ice free Arcitc in summer might mean for the world's weather systems? Not to mention and expanding tropics and poleward shifting jetstreams?
    0 0
  19. Dana, I have read this post (which is very good) but you do not address storm intensity -vs- heatwave intensity? For example, why (as WUWT appears to show here) do changes in storm intensity appear to be cyclical (rather than steadily increasing)? How can Hansen et al (2012) and Watts et al (2012?) both be true? Also, what criticism by Muller was Mann was reacting to in the 'On the Green Front' broadcast (yesterday - as embedded on WUWT above)? That is to say, has Muller been attacking Mann because of the sarcastic Tweet (to the effect that Muller is likely to catch up with climate science eventually)? What have I missed?
    0 0
  20. Cliff Mass replies on his blog: "That skepticalscience piece is FULL of serious technical errors. They are a climate advocacy groups run by non-atmospheric scientists. Groups like that ( and others of similar ilk, et.gClimateCentral)are part of the problem..." I've suggested to Cliff (who is in fact an admirably skilled meteorological researcher and runs some very excellent modeling efforts here in the Pacific NW) that if we are to evaluate arguments by affiliation and specialty rather than specific analysis then of course we'll go with Hansen's results. Hopefully he'll offer something more tractable for purposes of discussion than a caps-lock invocation. For what it's worth, I don't think Cliff is very well calibrated against the nuances of this matter. He's nothing if not extremely enthusiastic and that energy shows in everything he writes, right or wrong.
    0 0
  21. @ Martin - For starters, it's Anthony Watts. He's been discredited so many times that nothing he says is worth listening to. If a person goes onto WUWT site not believing something, and then believing it after reading Watts, that person is most likely less intelligent than when starting, since he now believes something that isn't true. Now to your actual question - Watts posts some graphs about Northern Atlantic hurricane intensities. James Hansen is talking about an increase in high temperatures. I fail to see the connection here. Please explain if I'm missing something.
    0 0
  22. BWTrainer - I hope you do not mistake me for a fake skeptic? I am well aware of AW's track record of obfuscation, data misrepresentation, and support for conspiracy theory explanations for what is supposedly not happening. Therefore, returning to my actual question - why is the frequency and/or intensity of hurricanes not increasing? What form of data-mangling has AW performed in order to present this apparently well-supported conclusion? Presumably, whatever he has done, it is a similar trick as that performed to make it appear that tornadoes are becoming less frequent and less intense over time as well? I would therefore like to know how this trick is done (and I hope I do not need to join the Magic Circle to find out).
    0 0
  23. The WUWT Tips and Notes page really is a great place to find out about interesting stuff: e.g. It would appear that a Saudi Arabian computer hacker - with some emotional intelligence clearly - has taken over the website of the Global Warming Policy Foundation...
    0 0
  24. My first statement was just a standard rant any time Watts is brought up, especially because I was forced to actually go to his site to see what you were talking about. As for the second part, I go back to your original post - you questioned how Hansen and Watts could both be true. Given that they were talking about entirely different events, I don't necessarily see the correlation. One of them being right wouldn't preclude the other from also being right. RE: hurricane intensity and frequency. I don't know much about it to say if Watts is right or not. But remember the lag time in the burning of fossil fuels and its impact on short term local climate events. Given the warming we have in the pipeline, an absence of stronger and more frequent hurricanes over the past couple decades (if true) doesn't mean there won't be for the next century. This SkS page discusses the impact of global warming on hurricane frequency and strength.
    0 0
  25. Martin - as BWTrainer notes, Hansen did not discuss hurricanes, so Watts' comments are not in conflict with Hansen's. Hurricanes are a tricky matter because global warming is expected to cause both increased ocean temps (which make hurricanes stronger) and wind shear (which disrupts hurricane formation). So most likely hurricanes will become stronger but probably form somewhat less frequently. That's still a cloudy area of research however. Watts is focusing on Accumulated Cyclone Energy (ACE) - I don't recall exactly how this translates to hurricane intensity - and he also focuses mainly on the Atlantic. Research has shown that there does seem to be a long-term trend toward stronger hurricanes, i.e. see here. Also note that Watts is using the eyeball method - he hasn't actually shown what the long-term trend is in ACE. Long story short, Watts hasn't actually shown that hurricanes aren't getting stronger - he's just shown a graph and made an over-reaching assertion, and research suggests they are getting stronger. doug @20 - most of this post is just a summary of the peer-reviewed research, so as you note, if Mass thinks he's identified technical errors, his beef is probably with Hansen, Dai, Rahmstorf, Otto, Donut, etc., not with SkS. But if he would like to point out where he thinks we have made any technical errors, I'd certainly be open to constructive criticism, as opposed to the unconstructive vague criticism he seems to have provided thus far.
    0 0
  26. BWTrainer and Dana - Thank you for both of those replies. All - Sadly the messages warning of eternal damnation to all non-Muslims are no longer visible on the GWPF website but they were amusing while they lasted. No doubt, by tomorrow, they will be replaced with the normal comforting messages assuring all readers (Muslim and non-Muslim alike) that there is no cause for alarm...
    0 0
  27. @Martin - hurricane formation is inhibited by wind shear. I recall hearing that this was supposed to increase in a GW world, but don't recall the source. Here's one: http://www.nature.com/news/2010/100121/full/news.2010.24.html. What I'd expect to see with a hotter ocean is more years like 2005, placing 3 (Atlantic) hurricanes in the 6 most intense, and more rapid intensifications like Wilma's. 2005 was a WTF year for hurricanes.
    0 0
  28. Doug Bostrom @20, yesterday, I posted a comment at Cliff Mass's blog asking him politely to list the "serious technical errors" so that Dana could correct them. He has not bothered to list them, nor to allow my comment to be published. That failure is certainly not due to a lack of time or attention, as he has approved for publication another comment since then. I have repeated the request today. My repetition of the request was slightly less polite. I pointed out that without a listing of the errors, his comment amounts to an argument form authority followed up by an ad hominen. IMO his response is certainly worth no more than the detail he is provided to give.
    0 0
  29. Honestly, given the quality of the arguments Mass made in his blog post on the subject, he's in no position to criticize anyone else for making 'technical errors'. As noted above, his post was exceptionally oversimplified which made it technically quite wrong. For him to then write off our post, which is based on numerous peer-reviewed studies, as being 'full of serious technical errors' - pardon me for being less than concerned, especially as he seems unwilling to specify what errors he thinks he's identified.
    0 0
  30. As a frequent reader of Cliff's blog and admirer of his synoptic analysis and weather prediction modeling efforts I feel a little bit torn over his remarks about Hansen et al. Pondering on it, I really don't believe Cliff has a clue as to how frequently and deeply degraded is discussion around the topic of climate change; I think Dr. Mass is unwittingly emulating a lot of unworthy behavior, with basically good intentions but inadvertently poor results. If Dr. Mass has a fault, it's to do with dialing up his hyperbole to "11" a bit too often. Along those lines, I find Mass' description of Hansen's recent paper pointlessly offensive and insulting, and unfortunately harmful to his own credibility. I don't think Cliff understands how debased and empty words such as "deception" are when applied to climate researchers. It's much better to stick with specific complaints centered on specific facts. Mass published my remarks on his Hansen posts, except for one I invited him not to publish at all. Perhaps that's because I'm a bit more of a familiar presence at his blog? Tom, oddly enough Cliff appears to have published a reply to your comment that is free of content regarding your requests but does include another silly "appeal to authority" swipe at Skeptical Science. Oh, well. Nobody's perfect. :-(
    0 0
  31. Yes Doug, a whole lot of empty words from Cliff Mass thus far. The 'atmospheric science background' appeal to authority just demonstrates he has not grasped the concept of Hansen's paper.
    0 0
  32. Yes, nothing but a bunch of ad homs from Mass so far. Very disappointing. He's guilty of exactly what he accuses SkS of. Coincidentally, we just received some high praise from a rather prominent climate scientist regarding this post. I'm not going to name names, but he said this post is the best he's seen on the Hansen paper, most accurately reflects his opinions about it, and when he's asked about the paper by journalists, he refers them to this post. So it appears that Mass' criticisms aren't shared by those with expertise in the subject. Of course we already knew that, but as long as we're going to appeal to authority (as Mass does with his silly 'no graduate degrees in atmospheric sciences' jab), we've got Mass trumped there too.
    0 0
  33. And now my comments are not being posted at Cliff's site, not even an unrelated question about an image from a local modeling run. Geez. I suppose I invited this on myself but I thought Cliff had a thick enough skin to suffer a little criticism along with praise (and cash contributions to his modeling efforts, for that matter). Enough, time to move along.
    0 0
  34. Gavin Schmidt has posted a blog on Hansen 2012 and its critics at Real Climate. The early section contains little that is not seen above, although well worth reading for Gavin's clear exposition. The later section contains an interesting discussion of the non-linearity of impacts with increasing temperature, and the consequences with regard to criticisms like that of Cliff Mass.
    0 0
  35. Tamino usefully digs in to this issue with a new post: Risk.
    0 0
  36. When 3-sigma events occur 10x as often, they are no longer 3-sigma events!
    0 0

You need to be logged in to post a comment. Login via the left margin or if you're new, register here.


The Consensus Project Website

THE ESCALATOR

(free to republish)


© Copyright 2024 John Cook
Home | Translations | About Us | Privacy | Contact Us