Climate Science Glossary

Term Lookup

Enter a term in the search box to find its definition.

Settings

Use the controls in the far right panel to increase or decrease the number of terms automatically displayed (or to completely turn that feature off).

Term Lookup

Settings


All IPCC definitions taken from Climate Change 2007: The Physical Science Basis. Working Group I Contribution to the Fourth Assessment Report of the Intergovernmental Panel on Climate Change, Annex I, Glossary, pp. 941-954. Cambridge University Press.

Home Arguments Software Resources Comments The Consensus Project Translations About Support

Bluesky Facebook LinkedIn Mastodon MeWe

Twitter YouTube RSS Posts RSS Comments Email Subscribe


Climate's changed before
It's the sun
It's not bad
There is no consensus
It's cooling
Models are unreliable
Temp record is unreliable
Animals and plants can adapt
It hasn't warmed since 1998
Antarctica is gaining ice
View All Arguments...


Username
Password
New? Register here
Forgot your password?

Latest Posts

Archives

Matt Ridley - Wired for Lukewarm Catastrophe

Posted on 29 August 2012 by dana1981

Note: this post has been quoted in the November 2012 issue of WIRED magazine.

Matt Ridley has an article published in the September 2012 issue of WIRED magazine, which appears to be their cover story this month.  The article is full of misleading and inaccurate claims, logical fallacies, and quite frankly is little more than an attack on environmental concerns in general.  Not surprisingly, it was republished and hailed by the usual climate denial enablers.  The article essentially claims that every environmental concern over the past half century can be boiled down to 'alarmism'.

For example, Ridley pooh-poohs the adverse health effects of DDT, downplays the role of chlorofluorocarbons (CFCs) in ozone depletion, the health risks associated with air pollution, and so on.  The general theme of the article is that because these other environmental concerns did not result in catastrophic consequences, environmental concerns in general can be considered overblown alarmism.

Now, there is of course a glaring logical fallacy in this argument - we took action to address all of these prior environmental concerns.  We phased out the use of DDT and CFCs, passed Clean Air Acts to reduce air pollution, etc.  In fact, we recommend that anyone reading Ridley's article first put on a head vise, because he manages to undercut the premise of his own argument by making this very point:

"By the 1970s the focus of chemical concern had shifted to air pollution....driven partly by regulation and partly by innovation, both of which dramatically cut the pollution coming from car exhaust and smokestacks, ambient air quality improved dramatically in many cities in the developed world over the following few decades."

You might wonder how Ridley can make the argument that these prior environmental concerns were overblown because they did not have catastrophic results, when he himself admits that we took steps to stem their adverse impacts.  Please keep your head vise on while you try to figure out the answer to that question, and if you do figure it out, please let us know.  Chris Goodall debunks many of the claims Ridley makes with regards to past environmental threats in a good post at Carbon Commentary.

By this point you have probably guessed where Ridley's article ultimately ends up - claiming that concerns about climate change are overblown because these previous environmental concerns were supposedly overblown.  Ridley claims that the consequences of climate change probably won't be all that bad, and that based on the lessons of these previous environmental concerns (you know, the ones where we listened to the scientific experts and addressed the problem), we should start listening to the "lukewarmers", whose climate-related myths Ridley begins to reel off one by one.

Do "Lukewarmers" Ignore Scientific Data?

Here is how Ridley begins his discussion about what he calls "lukewarmers":

"We hardly ever allow the moderate “lukewarmers” a voice: those who suspect that the net positive feedbacks from water vapor in the atmosphere are low, so that we face only 1 to 2 degrees Celsius of warming this century"

It's rather strange that Ridley claims that we hardly ever hear from this group, considering how frequently the few climate scientist "lukewarmers" (i.e. Richard Lindzen and John Christy) are published in the mainstream media or invited to testify before Congress.  In reality the "lukewarmers" are disproportionately over-represented, particularly in the mainstream media.

Regardless, at this point we actually have a good amount of empirical data to measure the water vapor feedback.  For example see our discussion here, a list of relevant scientific papers here, and a new paper by Dessler (2012) here.  The literature consistently shows that the water vapor feedback is a positive strong one, as we expect.  Dessler (2012) described observational data from 2000 through 2010:

"climate variations were also amplified by a strong positive water vapor feedback (~ +1.2 W/m2/K)"

We are left wondering why "lukewarmers" supposedly suspect that the water vapor feedback is a weak one when the empirical data clearly indicate otherwise.  Ridley suggests that "lukewarmers" also think we only face 1-2°C warming this century, but under what emissions scenario does this belief apply?  For example, if we reach an atmospheric CO2 level of 900 ppm by 2100 (which is entirely plausible if we follow Ridley's advice and don't worry about global warming or take action to mitigate it), a resulting 2°C warming over the next century (~2.8°C since pre-industrial times) would correspond to a climate sensitivity of only about 1.6°C for doubled CO2. 

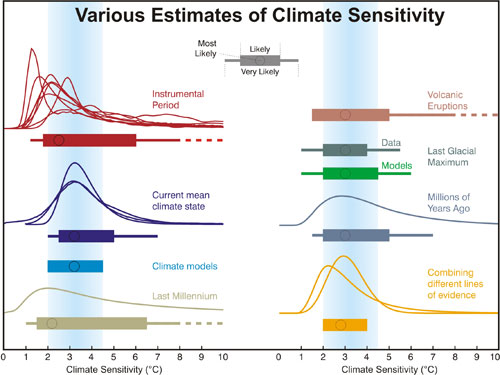
Do "lukewarmers" really believe that climate sensitivity cannot be higher than 1.6°C when the body of scientific literature puts the likely range between 2°C and 4.5°C for doubled CO2 (Figure 1)?
Various estimates of climate sensitivity

Figure 1: Distributions and ranges for climate sensitivity from different lines of evidence. The circle indicates the most likely value. The thin colored bars indicate very likely value (more than 90% probability). The thicker colored bars indicate likely values (more than 66% probability). Dashed lines indicate no robust constraint on an upper bound. The IPCC likely range (2 to 4.5°C) and most likely value (3°C) are indicated by the vertical grey bar and black line, respectively.  Adapted from Knutti and Hegerl (2008).

Lukewarm Greenland

According to Ridley, "lukewarmers" also believe

"that the Greenland ice sheet may melt but no faster than its current rate of less than 1 percent per century"

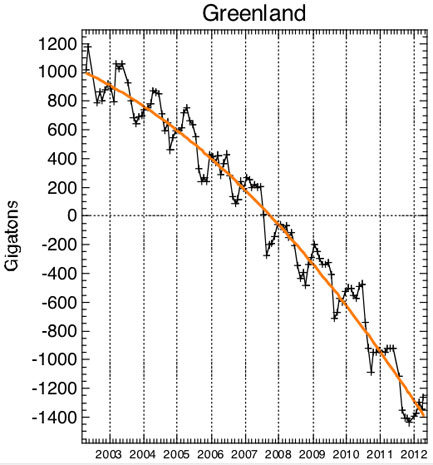
The problem with this particular statement is that the Greenland ice sheet is probably already melting faster than when Ridley wrote it (Figure 2).
greenland ice melt

Figure 2: Greenland ice mass anomaly - deviation from the average ice mass over the 2002 to 2010 period. Black line shows monthly values. Orange line shows long-term trend (John Wahr).

The Greenland ice sheet mass declined by approximately 250 billion tons per year from 2003 to 2009 according to Gravity Recovery and Climate Experiment (GRACE) data (Schrama and Wouters 2011), and the decline is accelerating by approximately 30 billion tons per year. 

We know Ridley expects global warming to accelerate, because we saw 0.8°C surface warming over the past century, whereas he expects 1-2°C warming over the next century.  So for "lukewarmers" to believe the current rate of Greenland ice sheet mass loss will remain steady over the next century, somehow the current accelerating mass loss will have to stop despite accelerating global warming.  Try explaining that one.

Lukewarm Agriculture

The next thing Ridley claims "lukewarmers" believe is

"that net increases in rainfall (and carbon dioxide concentration) may improve agricultural productivity"

It's true that some places will see increased rainfall while others will see a decrease.  Perhaps we should consult projections of future drought (via the Palmer Drought Severity Index [PDSI]) to determine how agricultural productivity might fare in a warmer world, from Dai (2010) (Figure 3).

pdsi dai

Figure 3: the potential for future PDSI worldwide over the decades indicated, based on current projections of future greenhouse gas emissions (Source)

This is not a pretty picture (except for the nice colors, of course).  By the 2030s most of the United States southern Europe, southeast Asia, northern and southern Africa, eastern Australia, etc. will regularly face droughts around the same severity as those which seriously adversely affected American agricultural productivity this summer.  Northern Canada and Siberia may become suitable for agricultural productivity - do we want to move all of our crops to those regions?

Low Lukewarm Standards and High Risk

Ridley also notes that "ecosystems have survived sudden temperature lurches before."  This is true, but is mere survival the standard we want to set for ourselves and the ecosystems on which we rely?  Moreover, there have been mass extinction events during which ecosystems did not survive sudden temperature lurches.  In fact, there is evidence we may be entering the sixth such mass extinction event.  Do we really want to take that risk under Ridley's reassurance that ecosystems might be able to survive it?

It is perhaps not surprising that Ridley advocates this high risk approach.  As Andy S previously discussed, Ridley  was the non-executive Chairman of Northern Rock, a British bank that, in 2007, was the first in over a century and a half to experience a run on its deposits.  The bank had allowed itself to become extremely over-leveraged, with debts more than 50 times its shareholder common equity.  Ultimately Northern Rock was bailed out, borrowing £3 billion from the Bank of England over the span of a few days in 2007. 

Unfortunately if Ridley is wrong in his foolhardy approach toward climate risk, there is nobody to bail us out when the climate goes awry.

Lukewarm Strawmen

Finally, Ridley says that "lukewarmers" believe

"that adaptation to gradual change may be both cheaper and less ecologically damaging than a rapid and brutal decision to give up fossil fuels cold turkey."

This is of course a strawman argument - nobody suggests that we should immediately cease burning all fossil fuels.  The transition away from fossil fuels will be a slow and difficult one, but we must do it as quickly as possible, because time is running out.  Additionally, the benefits of the solutions which have actually been proposed (i.e. carbon pricing) exceed the costs several times over (Figure 4).
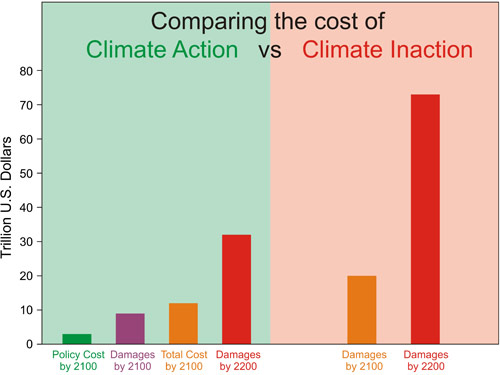
Figure 4:  Approximate costs of climate action (green) and inaction (red) in 2100 and 2200. Sources: German Institute for Economic Research and Watkiss et al. 2005

False Equivalence and Other Logical Fallacies

In general, Ridley's argument suffers from the fallacy of false equivalence.  For example, he equally criticizes concerns about ozone depletion and air pollution (real environmental hazards that caused measurable damage which we addressed by reducing emissions of the responsible substances) with predictions of December 2012 apocalypse (pure fiction) and concerns about climate change (a very real and very large threat which we have yet to address).

Ridley's dismissal of the climate change threat because past threats have not resulted in catastrophe is entirely illogical.  Consider a doctor treating a patient for a potentially deadly infection.  The doctor prescribes antibiotics, which successfully treat the infection, and the patient survives.  A few years later, the doctor diagonses the same patient with cancer.  If Ridley were the patient in this scenario, he would claim that the cancer is no threat because the infection did not kill him. 

Lukewarm Arguments at Best

Ridley has not painted those he describes as "lukewarmers" in a flattering light in this article.  Apparently they believe that climate change cannot possibly result in catastrophic consequences because no environmetal concern in modern times has resulted in catastrophe, ignoring the fact that we have taken steps to address all prior environmental threats.  "Lukewarmers" also apparently do not believe that the water vapor feedback is strongly positive, even though that is what the scientific data indicates, or that climate sensitivity could be within the likely range of values from the scientific literature.  They think that the Greenland ice sheet decline - which is already accelerating - will not accelerate.  They think agricultural productivity will increase despite measurements and projections of increasing drought.  And instead of considering serious proposals to mitigate global warming, they claim that we 'alarmists' want to immediately cease burning all fossil fuels.

As we noted when discussing a recent Wall Street Journal article from some other climate contrarians, the beauty of publishing articles in the mainstream media is that unlike in the scientific literature, you are not expected to support your assertions.  As a result, Ridley is able to make a mockery of all previous environmental concerns by rewriting history.  Ridley also manages to mostly ignore the fact that the reason these past environmental threats did not result in very bad consequences is that we took action to prevent that from happening (except when he undermines the entire premise of his article by making that very point). 

The exact same thing is true of climate change - if we take action to mitigate the problem, we can avoid catastrophic consequences.  We can also address the problem in a way that results in a net benefit not just for global ecosystems, but even for human economies (see this NY Times piece for a good discussion on the subject).  Unfortunately Ridley does not offer any constructive discussion about how we should address the problem; instead he continues his caricature of alarmist environmentalists by claiming that the only proposed solution to the problem involves immediately ceasing all fossil fuel use.  It is unfortunate that WIRED prominently featured such a counterfactual and unconstructive article.

0 0

Printable Version  |  Link to this page

Comments

1  2  Next

Comments 1 to 50 out of 66:

  1. MOTS. All we can hope is, this recent uptick in desperate dispersion of lies, half-truths, and logical fallacies in the denialosphere (aided and abetted by the near-worthless media) is a sign that recent climate events, plus the ever-growing support of climate change viz. AGW, is driving the denialists into ever-increasingly weird and tin foil-hatted tomfoolery. Give'em the rope with which to hoist themselves. Science moves forward....let's hope that rate of increase is ever slightly greater than the increase of folks like Ridley.
    0 0
  2. His part on acid rain effects on forests and lakes had me wondering what studies he was cherry-picking. I suspect he was looking at forests and lakes on more alkaline soils which neutralized some of the effects of rain. Up in Canada on the Canadian shield in the east, our soils are already naturally acidic with very little buffering capacity. They did sustain damage, and a large number of our lakes died. Plus the extra acidity leached mercury from the rocks/soil into the lakes so any fish still in the lakes were high in mercury content. Some of our most heavily effected lakes still haven't recovered. And in extreme cases where localized pollution made the rain even more acidic (Sudbury, for e.g.) the vegetation disappeared. Even with the regreening effort, you can still tell this area has been heavily effected (small stunted trees, small birch trees with many dying limbs).
    0 0
  3. To think I once purchased and read a book by Ridley where another reviewer also found political bias.
    So overall, an enjoyable, interesting, and informative book, however the more I became aware of the authors tendency to dress his own political agenda up as scientific fact, the more I began to question the perhaps misleading perspective on the subject that the book may be giving.
    Yes Ridley does have an agenda one displayed more strongly in 'The Rational Optimist'.
    0 0
  4. vroomie, I think you're right, and you're overlooking one other important factor--the economics are finally turning against them, too. We've already seen a drop in CO2 output this year as natural gas replaces coal based purely on cost, and renewables are becoming cheaper and more efficient every year. Technologies like solar shingles and miniturbines are becoming more cost-effective and will be more widely available in coming years. The only question is which governments will be subsidizing the research to make these products more affordable--will I be buying American, or Korean or German or Chinese products in 2022?
    0 0
  5. Dana, thanks again for a great article. Please correct me if I’m wrong, but I think you are still using the incorrect data from Dai’s 2010 paper. There was a recent retraction published by UCAR here , in which PDSI values of -20 really should have been more like -10. Recently Dai published a new paper this month in Nature Climate Change with what I guess are improved calculations. This is a critical issue – and as someone said in a very recent post in one of the comments – the key component in all of this is food, food, food. I still would like to see a post that explains the basic physics of drought – and specifically why the US is predicted to become increasingly arid while the Sahel region may actually have increased precipitation. In the post on new research for the last week there is the intriguing paper about Hadley circulation response to the greenhouse. I haven’t had time to look at it, but perhaps someone could inform us whether it sheds some light on what their findings might tell us about drought prediction. Thanks!
    0 0
    Moderator Response: [Sph]: Links fixed by request.
  6. Note the "driven partly by regulation and partly by innovation" statement. Another inaccurate separation. Regulation is often a strong incentive for technological innovation - something people like Ridley are loath to admit. This has been particularly true for pollution abatement. See the work of the excellent historian David Hounshell on this point.
    0 0
  7. ralbin@7: I am acutely aware of this, both in its verity and in how those who *hate* regulation are, as you say loathe to admit it. My experience was from many years in the car repair/racing/fabrication business, and through the 70s, when pollution controls were being implemented (and *nobody* knew what they were doing) I saw this very thing occur. Now, we have IC engines, even diesels, which run so clean as to defy belief: heck, ~I~ never believed there would be V8-engined cars that regularly get 30+ mpg, and make in excess of 500 hp. Then there are the numerous other technlogies, such as on coal-fired power plants, that run way cleaner than they did, 30 years ago, directly due to regulation. I firmly believe that had the government not stepped in and forced the issue, we'd all *still* be driving ca. 1965 cars, at least in terms of pollution controls. I also do not recall when the Cuyahoga River last caught fire....pollution regulations, by and large, work as intended. Regulation does indeed drive innovation, and I see the same opportunities in the crisis we face. this "regulation, *always bad*" meme is misguided and dangerous.
    0 0
  8. Even if Ridley was correct about seeing only 1-2°C warming this century, with the warming from the start of the Industrial Revolution to the turn of the century taken into account that brings us to 3°C warming. I don't think I'm going out on any kind of limb by saying that Ridley's projection still leads to disaster. Lukewarmer, indeed!
    0 0
  9. JoeT @5 - thanks, I've updated the PDSI figure as well. ralbin @6 - I also agree that regulation tends to drive innovation by increasing demand for low emissions products.
    0 0
  10. Dana @9 - you mean you actually updated your post to correct a figure based on new information, and the update made the situation less dire? But that goes against everything I've been taught by the deniers! I thought climate scientists were a bunch of alarmist, lying criminals trying to scare us all into Communism! Now I don't know what to think.
    0 0
  11. BWT @10 - yes, irrespective of caricatures of us, SkS is all about getting the science right :-) The picture still isn't pretty after the update. Basically we're looking at super extreme drought becoming the norm as opposed to super duper extreme drought.
    0 0
  12. Ridley's loathsome distortions made me so crazy I couldn't do anything when I read it other than click out and hope to forget by any means possible. However I think some of this rebuttal is less than complete. For instance this sentence which I suppose was meant facetiously, but could be construed as a real possibility: "Northern Canada and Siberia may become suitable for agricultural productivity - do we want to move all of our crops to those regions?" Regardless of warming, the soil and topography do not lend themselves to agriculture. As to this: "...nobody suggests that we should immediately cease burning all fossil fuels." Personally, I do - or at least, strict rationing. We've run out of time to wait for "carbon pricing" in the magic economic market or new "green" technologies to make a dent in the warming disaster already in the pipeline. We are in a global emergency and nothing less than drastic curtailment of consumption - serious sacrifice and a drastic reduction in the developed world standard of living will do. If we want to survive, that is. The mass extinctions have already begun...isn't that what the science says?
    0 0
  13. witsend @12 - we'll have a post on what the future climate might look like, on Thursday I believe. But we're not at a catastrophic point yet, and the idea is to avoid major disruptions to human society and economies. Immediately ending fossil fuel use would do just that. I think we have to be realistic about what we can do, and suggesting an immediate ceasing of all fossil fuel use is not at all realistic.
    0 0
  14. re: 12 Yes: the Canadian Shield in particular is rocks, with minimal topsoil, because the glaciers moved it down into the US, as far as ~Kansas. Try this for images. This is not farm country.
    0 0
  15. Some people, if they are remembered for anything, it will be: persistently, determinedly and loudly wrong about an important topic for which they had little expertise for a meaningful opinion.
    0 0
  16. In reality the "lukewarmers" are disproportionately over-represented, particularly in the mainstream media.
    This is an important point. I would like to see a graph comparing congressional testimony in the U.S. congress by AGW deniers, vs consensus climate scientists,and comparing that to their representative numbers i.e. 3% vs 97%. My guess is that the deniers are very much over represented in their place at the table.
    0 0
  17. I remember the alarmism of the CFC issue. I remember the alarming impression that even the proposed gradual phase out would see us scared to go out in the sun by about now. This was from a casual reading of local newspapers at the time and without any real detailed investigation of what was being said by reliable sources of scientific information. I also remember other alarming claims that action to combat CFCs would destroy our economy because CFS were in so many things that we take for granted on a day to day basis which would all become more expensive with further positive feedbacks resulting in economic catastrophe. Even our fast food was going to be more expensive as McDonalds used to use a CFC based styrofoam container, and the CFC based alternative would be more expensive. Until they decided to wrap the burgers in paper instead of a plastic box....
    0 0
  18. The 'lukes' and 'deniers' also have their own brand of alarmism that they rarely get called out on,concerning what they describe as "catastrophic" effects on the world wide economy and massive deaths to third world citizens if we turn our backs on petroleum fuels and pursue alternative energy.
    0 0
  19. tmac57 @18 - I agree they're not called out on their economic alarmism often enough, but it's something we at SkS call them out on quite frequently!
    0 0
  20. In general "lukewarmers" seem to be expecting a myriad of graphs to exhibit strange and unlikely bends, that we'll see a chorus line of knees cocked in a comforting and attractive pose, an artful arrangement of "up" and "down" reversals just where we'd like them most. How likely is that?
    0 0
  21. I think the reason that lukewarmers arguments are strong is because it is consistent with the actual measurements. I went though all major temperature indexes and they indicate a warming rate that will increase the temperature by 1.2 to 1.4 degrees centigrade by the year 2100. Here is my graph. Graph of GISS, HADCRU, RSS and UAH indexes
    0 0
  22. Joel @21 - it appears that you are assuming the warming over the next century will continue at a linear rate, which is not realistic, and doesn't tell us anything about climate sensitivity. As we showed here, actual measurements are consistent with a climate sensitivity of around 3°C for 2xCO2.
    0 0
  23. dana @21 - Even to support a linear increase in temperature we need to postulate a exponential increase in CO2. If CO2 continues to increase at 2ppm per year, then we the temperature would increase at a rate much less than 0.14 degrees per decade I get for a linear increase. To get a 3 degree increase, then we have to assume that CO2 would actually double between now and 2100. That works out to 4.4 PPM average for the rest of the century, which means that the rate of increase would have to quadruple by the end of the century. The current rate of increase (2000-2012) is about 45% by the end of the century.
    0 0
  24. Joel, CO2 emissions and concentrations are already accelerating, and have been for decades. You note the rate of increase is now 2 ppm/yr, in the 1980s it was 1.5 ppm/yr, in the 1960s it was 1 ppm/yr. Unless we do something about it, emissions are expected to continue accelerating (see my link @22). The only way 'lukewarmers' are right is if we take major steps to reduce our emissions.
    0 0
  25. As a reminder, there is nothing magic about 2100AD. Some people seem to want to act like "if we can only keep temperature rise to X by 2100, all is well." When the Earth gets to 2100, I'd guess there will still be much warming in the pipeline from the usual lags.
    0 0
  26. 23, Joel, And what if the system isn't so simple? What if the Arctic ice melt happens abruptly (as if that could ever happen), and the subsequent changes to the Arctic profile (absorbing radiation instead of reflecting it) ramps temperatures up in a sudden bump? And then that bump releases methane cathrates and melts permafrost in large quantities, causing another bump? What if the actual system moves in fits and spurts, bumping temperatures abruptly on timescales that a few decades cannot detect? In short, what if the science that suggests 2.4-4 C warming, based on a variety of disparate methods, is correct, and your simple projection based on a short period of observation is completely wrong? What if aerosols, a quiet sun, and a string a La Nina's are coincidentally and randomly holding warming to just 0.14 degrees per decade, but every down has an up, and there will be decades where the sun is hot, El Nino dominates, and China and other countries get their sulfide emissions under control? What if, as we already know, dimming aerosols provide a negative compensation for the radiative effects of CO2, and once those stop counteracting the GHG effect, a greater, fuller effect of CO2 is felt, well beyond 0.14˚/decade? What if the nice, simple, linear warming we've seen in just the first few decades since aerosols were reduced in the seventies is really just a blip in the process, and that when you add in real feedbacks, like the Arctic, things get more messy? And what if, as this year's extreme weather shows, the actual negative effects of even a small change in climate are far more deleterious than you or others expect, and that even "just" a 1.2 to 1.4 (or 2 or 2.5 or 3) degree increase has very, very frightening consequences? I think the problem with lukewarmers is that they are the worst of the deniers. They want to have it both ways, to accept the science but to be "reasonable" and dismiss any part of it which requires actual action. As John F. Kennedy said, “The hottest places in hell are reserved for those who in times of great moral crises maintain their neutrality.”
    0 0
  27. While others have pointed to some of the non-linearity in feedback system, it is worth also noting a couple of things. 1/ At moment, natural systems mop up more than half our emissions but there is doubt that the sinks can continue to do this 2/ Rising temperatures eventually cause natural increases in CH4 and CO2 from sea, tundra, swamps but this is a slow feedback. Fortunately, we can model these rather than just extrapolate temperature trends. The results arent pretty but that is no reason to ignore them.
    0 0
  28. dana @24 I am afraid the chart you are using is misleading. I downloaded the CO2 data for the same interval as my temperature chart and plotted a linear trendline and the fit is actually pretty good. There is nothing in the actual C02 data that supports an increase to 792PPM of CO2 by 2000, that would be necessary for a 3 degree increase by your own data. CO2 Chart The actual CO2 data, seems quite consistent with 1-2 degrees of warming by 2100 for 3 degrees per doubling.
    0 0
  29. Sphaerica @26. That is something you really need to take take up with the IPCC. They are the ones that insist that Greenhouse gases are the primary source of climate warming.
    0 0
    Moderator Response: (Rob P) - before you venture into sloganeering territory. Can you provide any peer-reviewed scientific literature that explain the suite of observations as well as the concentration of greenhouse gases in the atmosphere? A simple yes or no will suffice.
  30. We should implement strict rationing, because it's going to happen anyway. Better we should impose it, according to the Post Carbon Institute: http://www.youtube.com/watch?feature=player_embedded&v=4uKgU7krWzE
    0 0
  31. Joel@29; you're correct, and all available science supports that CO2 *is* the primary driver in this scenario. This is a seminal paper, and if you'd like more (e.g., being a true skeptic and not a denialist) I, and others here, can easily supply you many, *many* other peer-reviewed and very robust papers saying the same. CO2 Is The Principal Control Knob
    0 0
    Moderator Response: [DB] Fixed text and link. The lecture version is here.
  32. #28, why would you want to use half the Mauna Loa data to fit your trendline? Why not use all of it? The source of the graph is this post by Tamino. There's also a plot of the rate of increase. How does the rate of increase look over the longer timeframe - the rate is increasing, which means that CO2 output is in fact accelerating. This increase is present in your graph, but it's small because of the shorter timescale. Now we know why you only wanted to use data from about 1980... Also worth watching is this animation of CO2 increase (youTube video by Robert Way, data from NOAA). Pause the video at 1:27, see if you still contend that there has been no acceleration (assuming you can dislike Tamino's statistical analysis). Run the video on to the end, and then ask yourself what the apparently small wiggles appearing from the bottom left correspond to in terms of Earth climate changes. Still think the change is small? Plotting small, out-of-context snippets of data is a good way to fool yourself.
    0 0
  33. "half" should, in fairness, read "just over half"...
    0 0
  34. Joel @28 - I'm not really sure how to respond to your comment. How do you propose the chart I provided is "misleading" in any way? You seem to suggest it's misleading because a linear fit "looks pretty good" (ah yes, the ever reliable Eyecrometer). That's nice - did you try an exponential fit? If not, you're not being a skeptic - you're trying to justify your pre-determined conclusion instead of trying to find the right conclusion. Until you can accept the reality of accelerating CO2, it seems like a complete waste of time to continue this discussion. Sorry I'm being a little cranky, but I really don't appreciate being called misleading for presenting a very simple and clear graph to prove my point.
    0 0
  35. Moderator @29 . I think that is actually Sphaerica responsibility. He is the one is arguing that Greenhouse gases are not a primary forcing. I just kicked the ball to the IPCC.
    0 0
    Moderator Response: [DB] Umm, no. The IPCC is merely a collection/collating body that summarizes the primary literature. It is that selfsame literature that very clearly delineates GHG's as a feedback and forcing. Even skeptics and fake-skeptics such as Spencer, Singer, Lindzen, Evans, Monckton, Jo Nova and Christy acknowledge that.

    (Rob P) - a simple no would have sufficed.

  36. Joel - do you understand the difference between a forcing and a feedback? The change is CO2 by use of fossil fuel is the forcing (cause), atmospheric aerosols are negative forcing (but short-lived). Temperature-induced changes to GHG, albedo etc are feedbacks that amplify the forcings, work non-linearly and over very different timescales.
    0 0
  37. Skywatcher @32 I used 1979, because that is the same date I used for my post @21 for temperature. Using longer intervals actually results in a lower linear fit.
    0 0
  38. #37 - comment of the day! Yes, it produces a lower fit, because over the longer period, the concentration of CO2 is more clearly accelerating!. That would be exactly the point. As Dana suggests, what happens if you try an exponential fit?
    0 0
  39. dana1981 @34 . The first problem is the use of a bar chart. Anyone who is familiar with the work of Edward Tufte, will assume that anyone using a bar chart is trying to sell you something, since it is the 2nd worst chart after the pie chart. The 2nd problem is that there is no discernible algorithm for where the vertical bars are drawn. If you have access to the orginal source material, maybe you can post a link? I said 'looks pretty good' because the r-squared is .98, which I included on the graph. I spent a fair amount of my career writing programs to create graphs to support actual engineering decisions and tend to be pretty picky about graphs. I usually download the raw data and draw my own graphs. Wood for trees
    0 0
  40. I think debating what curve best fits the co2 emissions so far is missing the main point. The emission scenarios considered by the IPCC are found here. Note in figure 3, that none of the scenarios have a combined emissions that rises exponentially to 2100. It is wrong to claim that the predictions for temperature rise by 2100 is based on exponential emission increase. Feedbacks do that. Furthermore, as far as I know, none of the AR4 models even considered carbon cycle feedbacks as they were considered too slow to have an impact over such a short time frame. The effect of zero carbon and constant carbon emissions have been considered by published papers. These were discussed at Realclimate here.
    0 0
  41. Joel - so my graph is misleading because you don't like bar charts? Riiiiiiight. No algorithm? There's one vertical bar per year. If you mean the horizontal bars, they're one per decade. I really don't know how it could be any simpler or clearer. Not sure why you're asking for the data that you've already plotted yourself, but it's here. Still waiting for you to show some skepticism and do that exponential fit.
    0 0
  42. Joel, What did you misunderstand in my words that led you to believe that I was "arguing that Greenhouse gases are not a primary forcing"? There is no such statement or implication in anything I said. I spoke purely about feedbacks which are non-linear, as well as negative forcings which are (temporarily) masking current GHG forcings. What confused you?
    0 0
  43. dana1981 @41. Sorry typo. I meant horizontal bars. Your comments seem to all deal with C02 qualitatively. You haven't actually dealt with the data quantitatively. In your own article you speculate about greenhouse gas levels of 900ppm by 2100. "For example, if we reach an atmospheric CO2 level of 900 ppm by 2100 (which is entirely plausible if we follow Ridley's advice and don't worry about global warming or take action to mitigate it)" e That works out to an increase of 504PPM for the next 88 years. A simple doubling would be an increase 396ppm. I tried to follow skywatchers advice and fit an exponential curve on the CO2 data. When I tried to fit all the C02 data back to 1958, I actually got a very low value. The highest value I got was only using the CO2 data since 2000. That came out to f(x) = 0.0087800157 exp(0.0053225105x). This works out to 628PPM for 2100. That is a lot less than 900PPM or even 792PPM. If you think my math is wrong please correct me.
    0 0
  44. Sphaerica @42 I assumed that all feedbacks were included in Dana's number of 3K per doubling. It you think there are additional feedbacks, then you explain what number you are comfortable with.
    0 0
  45. Joel Upchurch - "Even to support a linear increase in temperature we need to postulate a exponential increase in CO2." Tamino has looked at this question - if you take the NOAA CO2 data, plot the log-transform of the data, and take a linear fit, you find that log-CO2 is increasing faster than linearly, and therefore CO2 is increasing faster than exponentially. [Source] Greater than exponential growth means greater than linear forcing by CO2, hence accelerating forcing and temperature change over time.
    0 0
  46. Joel Upchurch at #28, 10:59 AM on 30 August, 2012:
    dana @24 I am afraid the chart you are using is misleading. I downloaded the CO2 data for the same interval as my temperature chart and plotted a linear trendline and the fit is actually pretty good. There is nothing in the actual C02 data that supports an increase to 792PPM of CO2 by 2000 [sic], that would be necessary for a 3 degree increase by your own data. The actual CO2 data, seems quite consistent with 1-2 degrees of warming by 2100 for 3 degrees per doubling
    I presume that Joel Upchurch means "...an increase to 792PPM of CO2 by 2100...", but that aside, I do think that his "math[ematics are] wrong". A few years ago I had an enchange over at Deltoid (with Tim Curtin, if I recall correctly) about the trajectory of CO2 through to the end of the 21st century. I won't go just now into the nuts and bolts of how I constructed the curve I posted back then: because I am curious to see if Joel Upchurch believes that this is a reasonable projection. And if not, why not? To give a few clues, I used the entire Mauna Loa dataset available at the time, and I used the data itself to determine the best projection, rather than directly assuming a linear, exponential, or other fit. I did this by using a process similar to that illustrated by Dana on this very thread, and by using the most parsimonious approach in that analysis to subsequently arrive at the 21st century extrapolation. The result: assuming future human emissions of CO2 at the same rate of emission to date, there would be a hair over 800 ppm CO2 by 2100. And this with an R2 coefficient greater than derived from either a linear or an exponential fit... This completely contradicts Joel Upshore's claim that "[t]here is nothing in the actual C02 data that supports an increase to 792PPM of CO2 by 2000 [sic]...". Indeed, the "actual data" suggest almost exactly this amount of increase, and with the accompanying temperature increase of 4.5 C above pre-Industrial Revolution baseline if I calculate it correctly for a 3 C sensitivity. If Joel Upchurch has any quibble with my graph, and simply cannot replicate something similar himself, I will describe the several steps I used to obtain it, but first I want to see just how he uses "math" to conduct his own explorations of the data.
    0 0
  47. Joel Upchurch - As a followup to my previous post, your estimate of 628 ppm by 2100 using the most recent CO2 growth exponential fit can only be an underestimate. Given that CO2 is growing faster than exponentially the concentration will be well above the your prediction by 2100 if we continue on this path. In other words, Joel, your math is wrong; an exponential fit is incorrect. [ I see that Dana had previously pointed to the Tamino post discussing faster-than-exponential CO2 growth; perhaps seeing the graph may make the point more clearly. ]
    0 0
  48. John Mashey @14: While the Canadian Shield areas may not be suitable for agriculture in a warmer world, northern expansion of agriculture in the praries (not on the shield) may be possible. I don't think we can rule out some northern expansion of agriculture just because the shield areas are not good growing areas. Also, Is any thought given to the northern expantion of the tree line in Canada and what this means for additional carbon sink.
    0 0
  49. Smith, the geometry of moving north means that there is less area for farming than previously, even if soil conditions and other factors were benign. As to a moving tree line, the release of methane and of soil CO2 from warmed and oxidising organic matter would oustrip any nacent tree carbon sink. Oh, and there's the small matter of disrupted ecosystems, which is actually not that small...
    0 0
  50. 44, Joel, My points have nothing to do with the final degree of warming, but rather with your focus, which was on the rate of warming. The two are very distinct. The main takeaways for you (now that I understand your confusion): 1) Rate of warming is not necessarily going to remain linear 2) Rate of warming has nothing to do with final the destination, only how fast we're getting there. [But your explanation still doesn't explain your comment that "They are the ones that insist that Greenhouse gases are the primary source of climate warming." I'm afraid your train of thought there is leaving me utterly confused.]
    0 0

1  2  Next

You need to be logged in to post a comment. Login via the left margin or if you're new, register here.


The Consensus Project Website

THE ESCALATOR

(free to republish)


© Copyright 2024 John Cook
Home | Translations | About Us | Privacy | Contact Us