Climate Science Glossary

Term Lookup

Enter a term in the search box to find its definition.

Settings

Use the controls in the far right panel to increase or decrease the number of terms automatically displayed (or to completely turn that feature off).

Term Lookup

Settings


All IPCC definitions taken from Climate Change 2007: The Physical Science Basis. Working Group I Contribution to the Fourth Assessment Report of the Intergovernmental Panel on Climate Change, Annex I, Glossary, pp. 941-954. Cambridge University Press.

Home Arguments Software Resources Comments The Consensus Project Translations About Support

Bluesky Facebook LinkedIn Mastodon MeWe

Twitter YouTube RSS Posts RSS Comments Email Subscribe


Climate's changed before
It's the sun
It's not bad
There is no consensus
It's cooling
Models are unreliable
Temp record is unreliable
Animals and plants can adapt
It hasn't warmed since 1998
Antarctica is gaining ice
View All Arguments...


Username
Password
New? Register here
Forgot your password?

Latest Posts

Archives

What CO2 level would cause the Greenland ice sheet to collapse?

Posted on 23 March 2010 by John Cook

A matter of concern is the potential instability of the Greenland and Antarctic ice sheets. If the Greenland ice sheet was to completely collapse, it would contribute as much as 7 metres sea level rise. Similarly, the West Antarctic ice sheet would contribute around 6 metres sea level rise. East Antarctica would contribute 70 metres of sea level rise but is less prone to collapse. Consequently, how these ice sheets respond to warming temperatures is a crucial area of research. A new paper (Stone 2010) has been published that estimates that the CO2 level that will lead to collapse of the Greenland ice sheet is between 400 to 560 parts per million (ppm). At our current rate, we should pass 400 ppm within 10 years.

While there are uncertainties over the specifics of ice sheet behaviour, there are several lines of independent evidence that paint a consistent picture of how ice sheets will respond to global warming. Focusing on Greenland, what do observations tell us has been happening to the Greenland ice sheet? Satellites use gravity data to measure the total mass balance and have found the ice sheet is losing ice mass at an accelerating rate (Velicogna 2009).
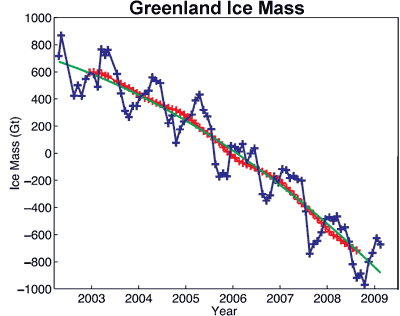

Figure 1: Ice mass changes for the Greenland ice sheet estimated from GRACE satellite measurements. Unfiltered data are blue crosses. Data filtered for the seasonal dependence are shown as red crosses. The best-fitting quadratic trend is shown as a green line (Velicogna 2009).

How can we know how the Greenland ice sheet will behave over a longer time period? We can determine this by looking at how the ice sheet has responded in the past. Some of the more optimistic emission scenarios from the IPCC predict warming of 1 to 2°C. The last time temperatures were this high were 125,000 years ago. At this time, sea levels were over 6 metres higher than current levels (Kopp 2009). This tells us that the Greenland and Antarctic ice sheets are highly sensitive to sustained, warmer temperatures and that in upcoming centuries, we can expect sea level rise in the range of metres, not centimetres.

Further light is shed on Greenland ice sheet stability in a new paper The effect of more realistic forcings and boundary conditions on the modelled geometry and sensitivity of the Greenland ice-sheet (Stone 2010). This paper uses updated data on bedrock topography and ice thickness to produce more accurate modelling results of Greenland ice sheet behaviour. They model how the Greenland ice sheet will respond to three different scenarios with atmospheric CO2 held at 400 ppm, 560 ppm and 1120 ppm. The simulations are run over a 400 year period.

Although not completely collapsed, the 400 ppm ice-sheet loses ice mass in the north of the island, with a total reduction in ice volume ranging between 20 to 41%. Note - due to the large inertia of the Greenland ice sheet, this mass loss doesn't happen at the moment CO2 levels reach 400 ppm but over a period of centuries. Under a 560 ppm climate, the Greenland ice sheet loses between 52 to 87% of its ice volume. If CO2 reaches 1120 ppm, there is almost complete elimination of the Greenland ice sheet with loss between 85 to 92%. The important result from this paper is that there is a critical threshold where the Greenland ice sheet becomes unstable somewhere between 400 and 560 ppm.

This is a large uncertainty range and one imagines there will be much research in the next few years to reduce the uncertainty. However, the 400 to 560 ppm range is put into perspective when you look at the projected CO2 levels for the various IPCC scenarios. The business as usual scenario has CO2 levels reaching 1000 ppm by 2100. Even the most optimistic scenario tops 500 ppm by 2100.
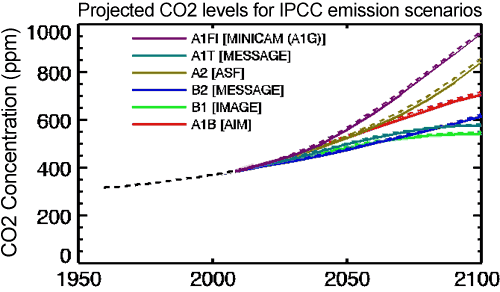
Projected CO2 levels for various IPCC emission scenarios
Figure 3: Atmospheric CO2 concentrations as observed at Mauna Loa from 1958 to 2008 (black dashed line) and projected under the 6 IPCC emission scenarios (solid coloured lines). (IPCC Data Distribution Centre)

Of course, Figure 3 displays projected scenarios. What has been happening in the real world? Observed CO2 emissions in recent years have actually been tracking close to or above the worst case scenario.
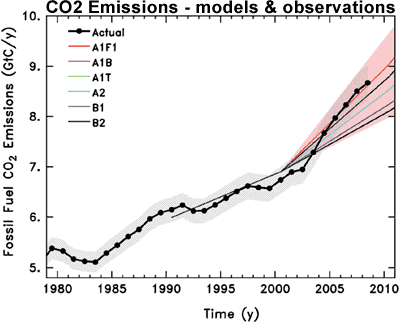

Figure 4: Observed global CO2 emissions from fossil fuel burning and cement production compared with IPCC emissions scenarios. The coloured area covers all scenarios used to project climate change by the IPCC (Copenhagen Diagnosis).

Satellite measurements, paleoclimate data and ice sheet modelling all paint a consistent picture. Global warming is destabilising the Greenland ice sheet which is highly sensitive to sustained warmer temperatures. Our current trajectory with CO2 emissions will likely cause at least several metres sea level rise from the Greenland ice sheet over the next few centuries. Of course, we shouldn't forget that this estimate doesn't include Antarctica - the Antarctic ice sheet is also losing ice at an accelerating rate.

0 0

Printable Version  |  Link to this page

Comments

Prev  1  2  

Comments 51 to 74 out of 74:

  1. My apologies, Camel - I mixed CO2 predictions with temperature, I suspect due to reading too many climate papers at once. Slapping head now... must get more caffeine! The IPCC models fit the total data for CO2 quite well, and previous predictions from those models were quite accurate. Loehle can't argue that arbitrary curves (from a recent subset of the data) invalidate the IPCC model unless he can argue that the IPCC model doesn't fit (it does) and supplies a possible alternative model with superior data fit and prediction accuracy for consideration (he doesn't). I believe he's just over-fitting a short segment of the data to argue that the IPCC model lacks predictive power, and he hasn't made that point at all convincingly. The existence of alternative theories, such as this interesting one on space/time and metaphysics have no impact on the consensus - unless there's actual evidence for them. Some 'guesses' are indeed better than others.
    0 0
  2. KR (#50), Peace! You are right, it makes absolutely no sense to exclude a large proportion of the data from the statistical analysis. On another thread I was asking how one could justify discarding 80% of the surface weather stations (the station drop off problem). Most of the folks on this blog thought that was fine because Tamino (a statistician) assured them the answer was not affected. Picking up on your mystic connection, William Blake (1757 - 1827) already imagined that a truly wise individual could do a great deal with very little information, maybe as little as one weather station or one grain of sand: "To see a world in a grain of sand and a heaven in a wildflower, hold infinity in the palm of your hand and eternity in an hour." Until we get much smarter we are going to need all the data we can lay our hands on and a bunch of statisticians to sort it out for us. scaddenp (#49), statisticians as you insist can be very useful. Just be careful not to trust them if what they are telling you defies reality or common sense. My point about the CO2 concentration was that we are living in a low CO2 era. In the past there have been periods with >4,000 ppm concentrations. In this context a few hundred ppm is just "noise". Getting back to the context of this thread, suggesting that the melting of the Greenland or polar ice caps is a "catastrophe" is Alarmist nonsense. The negatives of reduced glaciation are more than offset by the benefits.
    0 0
  3. I see that the "they are throwing data bit" has been answered for you before but you obviously havent accepted. Tamino correctly answers the charge that there was no fraud - the data is not "selected" to show warming. Reduced glaciation MIGHT be a benefit - but only if it happens slowly. Do you seriously believe that 10mm/year would be a good thing? How many refugees from salt-poisoned deltas is your country going to take?
    0 0
  4. gallopingcamel at 14:29 PM on 25 March, 2010 The negatives of reduced glaciation are more than offset by the benefits. GC, would you care to quantify that? Are you making a prediction based on analysis, or instead stating your opinion without support?
    0 0
  5. Camel, #52: "suggesting that the melting of the Greenland or polar ice caps is a "catastrophe" is Alarmist nonsense. The negatives of reduced glaciation are more than offset by the benefits." Melting ice is a symptom, not the disease. Unfortunately there are an enormous number of other symptoms. Excuse the length of this post, but I've compiled a mere handful for reference: Warming and earlier spring increase western US forest wildfire activity "large wildfire activity increased suddenly and markedly in the mid-1980s, with higher large-wildfire frequency, longer wildfire durations, and longer wildfire seasons. The greatest increases occurred in mid-elevation, Northern Rockies forests, where land-use histories have relatively little effect on fire risks and are strongly associated with increased spring and summer temperatures and an earlier spring snowmelt." Drought's growing reach "the fraction of global land experiencing very dry conditions (defined as -3 or less on the Palmer Drought Severity Index) rose from about 10-15% in the early 1970s to about 30% by 2002. Almost half of that change is due to rising temperatures rather than decreases in rainfall or snowfall," Global warming increases flood risk in mountain areas "if global temperatures increase by 2 degrees Celsius (3.6 degrees Fahrenheit), then large floods that occurred about once every 100 years could occur up to 5 times more often." Climate change amplifying animal disease "The World Animal Health Organisation said a survey of 126 of its member-states found 71 percent were "extremely concerned" about the expected impact of climate change on animal disease. Fifty-eight percent said they had already identified at least one disease that was new to their territory or had returned to their territory, and that they associated with climate change." Public health-related impacts of climate change "The population of many pathogens increases at higher temperatures, and this is likely to occur in lakes, streams and coastal zones as water temperature increases. In the coastal zone, toxic algal blooms will likely be more frequent as ambient, and consequently water, temperature rises, increasing the risk of illness originating from aquatic recreation, such as swimming and surfing, and from contamination of seafood (Rose et al., 2001)." Ecological responses to climate change "We have reviewed merely a portion of the enormous body of basic research on ecological and physiological processes that are sensitive to climatic variables such as temperature and precipitation. The evidence indicates that only 30 years of warmer temperatures at the end of the twentieth century have affected the phenology of organisms, the range and distribution of species, and the composition and dynamics of communities." Evidence from a wide range of unrelated disciplines points in the same direction. Many of the symptoms are already here - and the disease remains untreated and often is flat-out denied. Unrelated to topic, but here's a story of warnings ignored, or what would have been called at the time 'Alarmist nonsense'.
    0 0
  6. gallopingcamel writes: On another thread I was asking how one could justify discarding 80% of the surface weather stations (the station drop off problem). Most of the folks on this blog thought that was fine because Tamino (a statistician) assured them the answer was not affected. Er, no. Your questions about declining station numbers were addressed repeatedly by many commenters, including me here and here>. There are now at least four separate replications of this (Tamino, Zeke Hausfather, Ron Broberg, and now Joseph at "Residual Analysis"), all of which show no significant difference between stations that stopped reporting and those that kept reporting. Watts and D'Aleo made some ugly accusations that have been shown to be incorrect. I would suggest that unless you're prepared to offer some actual evidence, you should probably stop promoting their claims. Continuing, gallopingcamel writes: My point about the CO2 concentration was that we are living in a low CO2 era. In the past there have been periods with >4,000 ppm concentrations. Right ... several hundred million years ago, when the sun was significantly dimmer, and yet the world was quite a bit warmer thanks to all that CO2. This is dealt with in John's article Does high levels of CO2 in the past contradict the warming effect of CO2?.
    0 0
  7. I seem to be drawing a crowd here so I will try not to disappoint anybody. scaddenp (#53), with regard to the rate of sea level rise the current rate is quite low at ~320 mm/century. Since the end of the last Ice Age, sea levels have risen by ~120 meters, often at rates exceeding 10 mm/year. There were periods when sea levels rose very rapidly indeed as mentioned in earlier posts on this thread. According to the USGS, the melting of all the remaining ice sheets and glaciers would raise sea levels by another 80 meters. A serious matter for folks like me who live in Florida. The catch is how long will it take? You seem to believe the IPCC who predicted that the Himalayan glaciers would disappear by 2035. This nonsense has been dubbed "Glaciergate". You ask me what rate of rise I would like which seems to imply that you think mankind can control sea levels. I seriously doubt this but we can probably do a great deal of harm just by trying! There was an old lady who swallowed a fly.......
    0 0
  8. muoncounter (#55), Sure there are negatives to a warmer climate but longer growing seasons in the higher latitudes is such a huge positive that it completely swamps the negatives. There is plenty of evidence for longer growing seasons in the Medieval Warm Period and the prosperity that resulted. What if temperatures go much higher than recent "Climate Optimums"? Then we have to look back to the Eocene and there is plenty of room for debate about conditions back then. It is very well documented that a cooler climate increases stresses on humanity through glacial advances, famines, pestilence, bad weather and much more. Asking for a cooler climate makes no sense at all given that we know what to expect.
    0 0
  9. If sealevel rise stayed at 320/c then I would agree. However at end of last glaciation, while there was a lot more glaciers to melt, the rate of temperature rise was much lower. We dont know how fast sealevel will rise with various scenarios but best guess is in 80-150cm by 2100. This puts you up around the 1000/c level. Not a problem for you or I but one for our descendents. You dont think mankind can control sealevel? We are raising temperatures so we just stop doing it. Or do think sealevel rise is due to some other unknown factor other than ice melt and ocean warming? I think we can control but I dont think we can impact GHG gases quickly which is why we start acting now for the sake of the future. And I think Florida problems are pretty trivial compared to Bangladesh and Nile. As to whether warm is good or bad - how many times do people have to tell you its all about rate of change not what you change to. And on weather stations - why dont you read the what people have pointed to you about "selecting" weather stations and the process by which station data is gathered instead of making inane comments?
    0 0
  10. Gallopingcamel, you are sliding toward irrationality and, well, alarmism, with your post #58. Let's not oversimplify things, shall we? Pestilence: Yersinia Pestis multiply in the digestive tracts of fleas, whose blood diet leads to fibrin plug obstructions. The fleas become active above 10 degC. Warmer spring temperatures and wetter summers lead to greater incidence of the disease. http://www.pnas.org/content/103/35/13110.abstract The pestilence of the Black Death is not a companion of cold times. It is interesting to note that wet summers, which tend to be have less very hot days, are especially conducive to greater rates of infections, since the fibrin plugs dissolve above 27.5 degC, temp less likely to be reached consistently for a number of days in a wet summer. As for famine, the potato blight has made a comeback recently, and has been associated with the hairy nightshade, which is well suited to benefit from a longer growing season too: http://www.sciencedaily.com/releases/2007/01/070102132649.htm http://www.jstor.org/pss/4046887
    0 0
  11. scaddenp (#59), The idea that humans are a significant factor in raising global temperatures rests on a very shaky foundation as "Climategate" has shown. Unless better evidence is presented I will continue to believe that natural factors dominate. The "Copenhagen Diagnosis" mentioned at the top of this thread encapsulates the IPCC's over reaching and exaggeration of mankind's influence. This is what I call the "Catastrophe de Jour" approach which has damaged the IPCC's credibility beyond repair. The IPCC's Alarmist predictions for 2100 depend on climate models (GCMs) and Michael Mann's adherents who cling to tree ring temperature proxies. One of the many scientists who doubt mankind's ability to affect climate is Roy Spencer: QUOTE There is no question that great progress has been made in climate modeling. I consider computer modeling to be an absolutely essential part of climate research. After all, without running numbers through physical equations in a theoretically-based model, you really can not claim that you understand very much about how climate works. But given all of the remaining uncertainties, I do not believe we can determine — with any objective level of confidence — whether any of the current model projections of future warming can be believed. Any scientist who claims otherwise either has political or other non-scientific motivations, or they are simply being sloppy. UNQUOTE For more information check out: http://www.drroyspencer.com/ On the weather station drop off issue, nobody has addressed my question. How can you justify throwing away most of the data? In my business there are thousands of scintillation detectors counting energetic photons. We could have saved millions of dollars by dispensing with 80% of the detectors but instead we squirelled away money to buy more!
    0 0
  12. Philippe Chantreau (#60), Guilty as charged! Yes, I find the prospect of a cooler world much more scary than a warmer one. When populations are stressed they are more prone to disease be it the Black Death, Malaria or a 'flu pandemic.
    0 0
  13. Yet the prospect of a cooler world is both less likely and a lot more remote in time. Milankovitch cycles won't bring glaciation until 10s of thousands of years from now, way more time than civilization has existed. It is not assured that Humans will still be around by then. If they are, I'd like to think that they'll be able to deal with it with science and technologies that were tens of thousands of years in the making. You are entitled to your opinion, but I do not find it to be based on an objective assessment of the existing science and neither is Roy Spencer's opinion. He has demonstrated that through many of his writings and a few blunders too, not the least being related to his own UAH erroneous data, which had to be corrected by others. Unlike his blog posts or opinion pieces, Spencer's record of scientific publications does little (if anything) to undermine the consensus model of Earth' climate. I am unimpressed.
    0 0
  14. gallopingcamel writes: Yes, I find the prospect of a cooler world much more scary than a warmer one. Perhaps, but the former isn't a realistic danger while the latter is. You might also find the prospect of being chased down Main Street by a hungry T.Rex "much more scary" than the prospect of being killed in an auto accident on Main Street ... but which eventuality is it worth expending effort to prevent? In addition, gallopingcamel writes: On the weather station drop off issue, nobody has addressed my question. How can you justify throwing away most of the data? Yes this has been addressed repeatedly and very specifically. You simply keep ignoring the answers. In very plain terms: No data are being "thrown away." Neither NASA nor NOAA are "eliminating" weather stations -- they use the data that are provided to GHCN by participating national meteorological programs in other countries, and in some cases those stations are dropped by their home countries or there are delays in reporting. For example, with Canada, there are many more stations with data currently through 2008 which presumably will be providing updated data at some point. If you have a problem with this, complain to Canada, not to NASA or NOAA. I do not understand why you persist in accusing the honest, hardworking scientists of NOAA and NASA of "throwing away data" that they were never given in the first place ... particularly when many different, independent analyses of the data show there is no effect on the end result.
    0 0
  15. Ned wrote : "I do not understand why you [GALLOPINGCAMEL] persist in accusing the honest, hardworking scientists of NOAA and NASA of "throwing away data" that they were never given in the first place ... particularly when many different, independent analyses of the data show there is no effect on the end result." For the very same reason that he/she keeps repeating things like : 'The idea that humans are a significant factor in raising global temperatures rests on a very shaky foundation as "Climategate" has shown.' I.E. A few emails/files (none of which actually relate to the science of AGW, unless you believe in cherry-picking words and quotes) are enough for some to carry on denying. 'Unless better evidence is presented I will continue to believe that natural factors dominate.' I.E. With reference to the previous excuse : 'I don't want to accept AGW and will use any straws to clutch at.' 'The "Copenhagen Diagnosis" mentioned at the top of this thread encapsulates the IPCC's over reaching and exaggeration of mankind's influence.' I.E. 'I don't understand/want to wilfully misinterpret the IPCC and what they do and don't do..because I don't want to accept AGW.' 'This is what I call the "Catastrophe de Jour" approach which has damaged the IPCC's credibility beyond repair.' I.E. 'I must join in with those who want to destroy the credibility of the IPCC and we will use any small errors to try to do so; or, at least, to make sure that we can justify our denial of AGW.' 'The IPCC's Alarmist predictions for 2100 depend on climate models (GCMs) and Michael Mann's adherents who cling to tree ring temperature proxies.' I.E. The conservative projections based on GCM and AOGCM models from 10 different countries are, supposedly, all based on Michael Mann and his friends. Hmm. And, supposedly, they are the only ones using tree-ring temperature proxies. Hmm 'One of the many scientists who doubt mankind's ability to affect climate is Roy Spencer:' I.E. One of the very few, but a trusted expert to those who wish to clutch at straws and deny. And one who is presently struggling to explain the high UAH anomalies without reference to AGW. All the statements are trying to justify denial, and neither facts, figures nor reality will be allowed to get in the way of that. That means constant repetition, ignoring others, repetition, repetition, etc., etc.
    0 0
  16. Philippe Chantreau (#63), Here is NOAA's view on the last million years: http://www.ncdc.noaa.gov/paleo/ctl/clisci100k.html It looks as if the present warm temperatures are unusual. Much colder temperatures seem to dominate, so please tell me where you get the idea that we can look forward to "10s of thousands of years" before the next glaciation. I really hope you are right but the ice core record from Antarctica suggests that we are still in an Ice Age with short inter glacial periods.
    0 0
  17. Not really. http://www.nature.com/nature/journal/v429/n6992/full/429611a.html
    0 0
  18. gallopingcamel wrote "Please tell me where you get the idea that we can look forward to '10s of thousands of years' before the next glaciation." Okay: Berger and Loutre (2002) explained why this interglacial could last 50,000 years past today. I found that article's citation easily, by entering "Milankovitch" in the Skeptical Science "Search" field at the top left of every page, which yielded several pages that explain all this.
    0 0
  19. Philippe Chantreau, (#67), Thanks. This is really good news. Let's hope they are right!
    0 0
  20. Tom Dayton (#68), The paper you referenced is new to me. The idea that the present inter glacial could extend for another 130,000 years is exciting to say the least (British understatement). If the paper is well founded there will be a sudden temperature rise of about six degrees Celsius. Such a rise would melt all the remaining major ice sheets in a century or two, increasing the planet's albedo and raising sea levels by 75 meters. As there will be no ice at either pole we will have emerged from the present Ice Age. Is that how you see it? Am I missing something?
    0 0
  21. My my... I find this site quite disturbing. I have been watching the ice move since 1999, when I first located information of its acceleration. I have been dismayed since that day to see all forecasts of ice ignore the acceleration factors and end up giving linear conclusions which do not fit the trend lines curving motions. However this is the first time I have seen evidence of the Eastern Ice Sheet becoming unstable. A fact I find unsettling. Likewise I find the curve posted. The green line does not appear to be interested in hanging around until the year 2100 from its appearance, but looks more interested in becoming vertical long before then. I am sorry to ask so simple a question, but I am a laymans layman, and your graphs beg the question: How long before the land ice becomes zero density and speed becomes maximum? To the eye it appears about 2022 to 2025 or so(ish). Its not just an issue of sea level rise at that point... but of splash as well. Information which should be understood and shared I would think.
    0 0
  22. It is worth noting the sensitivity of northern Greenland to the 400 ppm scenario. Think about the Petermann Glacier as an indicator of this. http://glacierchange.wordpress.com/2010/03/27/petermann-glacier/
    0 0
  23. and i would add that accelerated ice loss appears to be spreading throughout northwest Greenland as a whole.
    0 0
  24. Phillipe (#67) and Tom (#68). Thanks for the links. I have not been able to access the Berger & Loutre paper so I have been reading everything I can find from David Archer and his various collaborators. Considering the huge implications of these papers it is surprising that there has been so little coverage in the media. If these folks are right: 1. It is already too late to prevent the Greenland ice cap from collapsing. 2. Mankind has the power to delay the next Ice Age almost indefinitely. From my perspective this is wonderful news. Maybe that is why it has been ignored by the "Main Stream Media". One of the worst things about being a sceptic is that you distrust the good news as much as the bad news, so I tried to pick holes in Archer's case. Archer's main planks are: A. CO2 is a dominant driver of global temperature. B. CO2 residence time in the atmosphere is orders of magnitude longer than the 35 to 100 years assumed by the IPCC and others. It is not likely that we will agree on point "A" so let's look at the CO2 residence time issue. Archer is a chemist so it was no surprise that I cannot fault his arguments relating to ocean absorption and the weathering of silicate rocks. The complexities of the various models he mentions (CLIMBER etc.) are way beyond my pay grade. Hopefully, Berenyi Peter will be able to comment. There appears to be a carbon sequestration process with a short time constant that Archer & Co may have overlooked. As my lab shares a car park with the folks running the relevant experiment, I forgot about chasing gamma rays for long enough to find out what my tree hugger colleagues have been up to. Take a look at the FACE experiment: http://c-h2oecology.env.duke.edu/site/face.html My hypothesis is that plant growth will accelerate as CO2 concentrations rise, thereby sequestering carbon rapidly (decadal time constant). If true, this effect would overwhelm the longer term processes described by Archer et al. Unfortunately (from my point of view), the FACE experiment is inconclusive. The trees exposed to CO2 at levels predicted for 2050 did grow very rapidly for several years but then slowed down owing to lack of nutrients (primarily nitrogen). Your comments would be appreciated.
    0 0
  25. gallopingcamel, I'm glad you seem to mostly trust Dr. Archer's judgment about how long it takes for increased CO2 level to fall back to its original value. But note that I did not write "residence time" of CO2, nor "lifetime," because those terms are ambiguous and have been misinterpreted by "skeptics." What matters to climate is how long it takes for the total number of CO2 molecules in the air to drop from its increased value back to its pre-increased value. During that process, some individual molecules that were added by the initial event A (e.g., oil burning) are removed very quickly, but they are immediately replaced by other molecules from sources other than event A (e.g., the ocean). When the latter swap happens, the total number of molecules does not decrease. So the "residence time" or "lifetime" of an individual CO2 molecule is irrelevant. What matters is how long it takes for the total number of molecules to decrease. That was explained briefly by Chemist Dr. Doug Mackie in his Question and Answer 1. More details and references (including links to full text for most of them) are in the caption of the Global Warming Art image Carbon Dioxide Residence Time. What the IPCC "and others" actually wrote is not "35 to 100 years assumed by the IPCC and others" as you asserted. Their actual statements are extracted as snippets, with links to the full texts, by Dr. Lisa Moore in her post Greenhouse Gases: How Long Do They Last?" Additional links to papers by Archer, Solomon, and others are on the Global Warming Links page here on the Skeptical Science site, in the Links for "CO2 Has a Short Residence Time" page. (That skeptic argument does not yet have its own, full page, so it appears only in the Links page, which you can get to via the "Links" link in the blue horizontal bar at the top of every Skeptical Science page.)
    0 0
  26. The soot that lands over Greenland from forest fires, industrial activity and burning methane clathrates and methane releases from permafrost fires in peatbogs and fires in tropical rainforests will likely speed up the melting of the ice, along with the melting of the Arctic ice cap which will leave more open ocean in the north of Greenland. When the ice melts, the greatest sea level rise will be seen near Nova Scotia, Boston and New York. At the current rate the sea level rise globally from Greenland will be 0.8 cm by 2020.
    0 0
  27. Tom (#75), I was hoping for a comment on the FACE experiment or even on the idea that mankind has the power to defer the next Ice Age. My take on the latter point is that it can't be that easy. Imagine driving around in your SUV or Gulfstream IV (if you are Al Gore) because it is your duty to save the planet from the big freeze?
    0 0
  28. Ned (#64) and JMurphy (#65), You say that NOAA is not throwing away station data. There is a simple way to test this statement. I have emailed the Canada Weather Office to ask them what station data they are currently providing to NOAA, NASA and UEA/CRU. If it turns out that they are sending data on more than one station (Eureka) above 65N and three stations between 60N and 65N (WITHEHORSE, DAWSON and CORAL HARBOUR) I hope you guys will be gracious enough to apologise.
    0 0
  29. gallopingcamel, the FACE experiment's topic of CO2 being sequestered by CO2-enhanced growth of trees is off-topic for this thread, so I've replied over on the thread CO2 Is Not A Pollutant.
    0 0
  30. gallopingcamel writes: You say that NOAA is not throwing away station data. There is a simple way to test this statement. I have emailed the Canada Weather Office to ask them what station data they are currently providing to NOAA, NASA and UEA/CRU. Just out of curiosity, would you mind posting the text of the email you sent? I'm curious about how you worded it. You should be aware that there are actually around 100 stations in Canada north of lat. 60 that have contributed data to GHCN in the past. The problem is that only four of those have been updated with new data since 2008.
    0 0
  31. Ned (#80), My apologies for taking so long to get back to you. The response from Environment Canada arrived a few minutes ago. Here it is: From: Env Canada Weather-Météo In 1996, the World Meteorological Organization (WMO) created the Global Climate Observing Stations Surface Network (GSN), a global network of about 1000 stations to serve as a basis for climate analyses.  These stations, a subset of all surface weather stations around the world, have the highest quality data and the longest history at a single location. Data from these stations are available in real-time to climate scientists around the world and some agencies, such as National Oceanographic and Atmospheric Administration (NOAA) and United Kingdom Meteorological Office, compile these data into global climate data sets.  Canada has 86 GSN stations of which 37 are in the Arctic. The global data sets maintained by NOAA/GHCN, NASA/GISS and the UEA/CRU contain subsets of the total amount of data available from around the world. They select the data that they want for their own trend research and, in most cases, make it available to others. If they are doing an analysis of the Arctic, then that data set should only include the 37 GSN stations from Canada. While we control what goes in our own archive and what we give to WMO, we have no control over which Canadian data go into the NOAA/GHCN, NASA/GISS or UEA/CRU. Hope this helps! Regards, Sylvain Boutot, Meteorological Inquiry Specialist MSC National Inquiry Response Team (NIRT) ISO 9001:2008, Environment Canada This makes it quite clear that plenty of station data is available above 60N in Canada. Maybe you can tell me why only one (Eureka) shows up in GHCN v2.
    0 0

Prev  1  2  

You need to be logged in to post a comment. Login via the left margin or if you're new, register here.


The Consensus Project Website

THE ESCALATOR

(free to republish)


© Copyright 2024 John Cook
Home | Translations | About Us | Privacy | Contact Us