Climate Science Glossary

Term Lookup

Enter a term in the search box to find its definition.

Settings

Use the controls in the far right panel to increase or decrease the number of terms automatically displayed (or to completely turn that feature off).

Term Lookup

Settings


All IPCC definitions taken from Climate Change 2007: The Physical Science Basis. Working Group I Contribution to the Fourth Assessment Report of the Intergovernmental Panel on Climate Change, Annex I, Glossary, pp. 941-954. Cambridge University Press.

Home Arguments Software Resources Comments The Consensus Project Translations About Support

Bluesky Facebook LinkedIn Mastodon MeWe

Twitter YouTube RSS Posts RSS Comments Email Subscribe


Climate's changed before
It's the sun
It's not bad
There is no consensus
It's cooling
Models are unreliable
Temp record is unreliable
Animals and plants can adapt
It hasn't warmed since 1998
Antarctica is gaining ice
View All Arguments...


Username
Password
New? Register here
Forgot your password?

Latest Posts

Archives

10 key climate indicators all point to the same finding: global warming is unmistakable

Posted on 29 July 2010 by John Cook

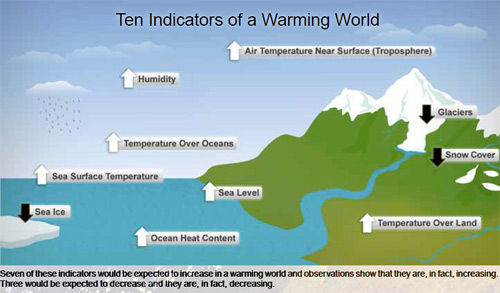
A common theme expressed at Skeptical Science is that to understand climate, you need to look at the full body of evidence. To help people assess the evidence, NOAA have just published State of the Climate 2009. The report defines 10 measurable planet-wide features used to gauge global temperature changes. All of these indicators are moving in the direction of a warming planet.

Seven indicators are rising: air temperature over land, sea-surface temperature, air temperature over oceans, sea level, ocean heat, humidity and tropospheric temperature in the “active-weather” layer of the atmosphere closest to the Earth’s surface. Three indicators are declining: Arctic sea ice, glaciers and spring snow cover in the Northern hemisphere. Jane Lubchenco sums it up well:

"For the first time, and in a single compelling comparison, the analysis brings together multiple observational records from the top of the atmosphere to the depths of the ocean. The records come from many institutions worldwide. They use data collected from diverse sources, including satellites, weather balloons, weather stations, ships, buoys and field surveys. These independently produced lines of evidence all point to the same conclusion: our planet is warming."

I suggest checking out the site as it has some great resources. There's a short video introducing the report. My favourite line from this is Deke Arndt's line, "Climate trains the boxer but weather throws the punches". If you want a quick summary, jump to the press release. There's DIY Climate Indicators with interactive displays and access to data set. And of course there's the full report (6.6Mb PDF).

0 0

Printable Version  |  Link to this page

Comments

Prev  1  2  

Comments 51 to 92 out of 92:

  1. Want a couple extra Eleven; Tropopause is higher, while stratopause and mesopause are lower. Pretty good indicator that the cause is man. Twelve; Habitats are moving Thirteen; Flowering dates are changing. Poor little flowers do not know what season it is. Fourteen; Trees are dying. Yes I know it is the bugs, but it is the lack of deep cold not killing the bugs. Is ya gonna make quote papers?
    0 0
  2. JMurfphy, CBDunkerson et al: Actually, you're right about NH ice - the graphic as displayed on the WUWT page does omit the 2 standard deviation error bar which is naughty of them - it's not immediately obvious when you glance at the display on their Sea Ice page. I stand corrected. My apologies, gentlemen. Nevertheless, the NH sea ice is doing a touch better or even reasonably well (considering earlier predictions of collapse of Arctic ice) depending on the metric - for example the DMI 30% sea ice, Jaxa, Norsex - area and extent. However, for Antarctic sea ice, see the University of Bremen site and the Cryosphere Today Antarctic Sea Ice Anomaly which are quite positive. If you look at the Cryosphere Today Global Anomaly, it's comfortably centred on normal. So is the glass half full or half empty? I don't pretend to know. As regards sea ice volume, I echo John Russell's question and additionally wonder whether the jury is still out if we have only just started looking at this metric. I recall earlier disputation about sea ice thickness.
    0 0
  3. “So while there are many skeptics who agree that global warming is happening but question the cause ...” Are we really the minority? We only have claim to the importance of the fact that "the CO2 concentration increases humans derived from burning fossil fuels." And we have arguments. “Recent Changes in Phytoplankton Communities Associated with Rapid Regional Climate Change Along the Western Antarctic Peninsula”,Montes-Hugo, et al, 2009, “The climate of the western shelf of the Antarctic Peninsula (WAP) is undergoing a transition from a cold-dry polar-type climate to a warm-humid sub-Antarctic–type climate. Using three decades of satellite and field data, we document that ocean biological productivity, inferred from chlorophyll a concentration ( Chl a ), has significantly changed along the WAP shelf.” “Paleo-records show that analogous climate variations have occurred in the past 200 to 300 years, and over longer 2500-year cycles, with rapid (decadal) transitions between warm and cool phases in the WAP. In this study (~30 years), the Chl a trend evidenced in the southern subregion of the WAP presented similar characteristics to those trends detected during typical interneoglacial periods (~200 to 300 years) (ie, high phytoplankton biomass, and presumably productivity, due to less area covered by permanent sea ice).” That is further evidence that the current warming, then what happens to the ice, these "10 key climate indicators - to change them, is not limited to: „CO2 concentration increases derived from humans burning fossil fuels.” The 1,800-Year Oceanic Tidal Cycle: A Possible Cause of Rapid Climate Change Charles D. Keeling (!!!) and Timothy P. Whorf - “Variations in solar irradiance are widely believed to explain climatic change on 20,000- to 100,000-year time-scales in accordance with the Milankovitch theory of the ice ages, but there is no conclusive evidence that variable irradiance can be the cause of abrupt fluctuations in climate on time-scales as short as 1,000 years. We propose that such abrupt millennial changes, seen in ice and sedimentary core records, were produced in part by well characterized, almost periodic variations in the strength of the global oceanic tide-raising forces caused by resonances in the periodic motions of the earth and moon. A well defined 1,800-year tidal cycle is associated with gradually shifting lunar declination from one episode of maximum tidal forcing on the centennial time-scale to the next. An amplitude modulation of this cycle occurs with an average period of about 5,000 years, associated with gradually shifting separation-intervals between perihelion and syzygy at maxima of the 1,800-year cycle. We propose that strong tidal forcing causes cooling at the sea surface by increasing vertical mixing in the oceans. On the millennial time-scale, this tidal hypothesis is supported by findings, from sedimentary records of ice-rafting debris, that ocean waters cooled close to the times predicted for strong tidal forcing.” The origin of the 1500-year climate cycles in Holocene North-Atlantic records, Debret, 2007: “Since the first suggestion of 1500-year cycles in the advance and retreat of glaciers (Denton and Karlen, 1973), many studies have uncovered evidence of repeated climate oscillations of 2500, 1500, and 1000 years. During last glacial period, natural climate cycles of 1500 years appear to be persistent (Bond and Lotti, 1995) and remarkably regular (Mayewski et al., 1997; Rahmstorf, 2003), yet the origin of this pacing during the Holocene remains a mystery (Rahmstorf, 2003), making it one of the outstanding puzzles of climate variability.”
    0 0
  4. muoncounter @ 9 Phew! It was pretty torrid 125,00 years ago with a lot of CO2 in the air - well within the span of human habiation and ceratinly not a young sun phenomenon. Was it maybe a Dansgaard-Oeschger event? We've had just 85 of these and the little ice age has been interpreted by some as the cold phase of such a cycle. Of course, a possible current Dansgaard-Oeschger event does not exclude anthropogenic forcings - clearly you can have both. Significantly, however, the Antarctic and Greenland icecaps reamined intact through this time - hence our ability to extract ice cores. Food for thought.
    0 0
    Response: What happened to sea levels 125,000 years ago certainly is food for thought. Sea levels were at least 6 metres higher than current levels. That tells us much about how Greenland and Antarctica react to just a degree or two of warmer temperature.
  5. HumanityRules at 14:55 PM on 29 July, 2010: "Cherry-picking? Global sea ice seems to have had little trend over the past 30 years . . ." **************** If this game is going to be played then focusing on Global Sea Ice is cherry picking itself. Why are you not including TOTAL Global Ice? Besides the corn in Kansas does not care what is going to be happening in the Southern Hemisphere in the next ten years. It is the Arctic Ice Cap's disappearance that is going to alter our weather systems in the Northern Hemisphere.
    0 0
  6. chriscanaris and others who might be interested: There's a great paper out this month on the history of the Greenland ice sheet: Alley, R. 2010. History of the Greenland Ice Sheet: paleoclimatic insights. Quaternary Science Reviews, 29: 1728-1756. Here's a brief excerpt dealing with the shape and extent of the Greenland ice sheet during the previous interglacial: =============================== "The MIS 5e Greenland Ice Sheet covered a smaller area than now, but by how much is not known with certainty. The most compelling evidence is the absence of pre-MIS 5e ice in the ice cores from south, northwest, and east Greenland [...] In contrast [...] the ice cores from central Greenland [...] and north-central Greenland (the NGRIP core) do contain normal, cold-environment, ice-sheet ice from MIS 5e. [...] The central Greenland cores do reveal that MIS 5e was warmer than MIS 1 (oxygen-isotope ratios were 3.3‰ higher than modern ones), and the elevation in the center of the ice sheet was similar to that of the modern ice sheet, although the ice sheet was probably slightly thinner in MIS 5e (within a few hundred meters of elevation, based on the total gas content). Thus, if we consider also evidence from the other cores, the ice sheet shrank substantially under a warm climate, but it persisted in a narrower, steeper form. [...] The efforts summarized above suggest that melting of the Greenland Ice Sheet contributed as little as 1–2 m or as much as 4–5 m to sea-level rise during MIS 5e, in response to climatic temperature changes of perhaps 2°–7 °C. The higher numbers for the warming are based on estimates that include the feedbacks from melting of the ice sheet, and the associated sea-level estimates are strongly favored by the statistical/modeling analysis of Kopp et al. (2009). Therefore, central values in the 3–4 m and 3°–4 °C range may be appropriate. =============================== Based on this and other things I've read, I would guess that roughly half of the 6 meter increase in sea level at the last interglacial came from Greenland, less than half from West Antarctica, and the remainder from other sources. Here's a nifty figure from the Alley et al. paper, showing a comparison of the shape of the ice sheet today vs. during the last interglacial: Fig. 7. Modeled configuration of the Greenland Ice Sheet today (left) and in MIS 5e (right), from Otto-Bliesner et al. (2006).
    0 0
  7. Chriscanaris, @ "Nevertheless, the NH sea ice is doing a touch better or even reasonably well (considering earlier predictions of collapse of Arctic ice) .... " This is very loose. Arctic ice extent is at its second (or maybe third) lowest ever recorded for this time of year. You have to looking at the data with rose-tinted spactacles to see a "recovery". A "recovery" apparently means "not a complete collapse". Complete collapse seemed warranted in June, when the extent was dropping at the fastest rate ever. Meanwhile ice volume is still at the lowest ever. There is nothing in the Arctic Ice data to argue "global warming is not happening". Hopefully, CryoSat-2 will put some matters beyond dispute. Antarctic ice loss is mostly a land phenomenon - sea ice extent does not mean much there.
    0 0
  8. miekol at 5 - Query for the moderators and posters. I agree that this is a science site. But it's also a site dedicated to persuading others that climate science is valid and the deniers' arguments are not accurate. Of course a huge part of the effort is establishing that in fact the deniers' arguments are not accurate. Does it end there? Or does this site ALSO want to discuss how to argue that in the most effective manner? If so, isn't a discussion of soft science ALSO relevant?
    0 0
  9. #28, CC: I'm sorry you felt grumpy; I did not mean to diagnose anyone or anything (and actually I did not do anything of the sort). "I'm aware that the Greenland ice cap and Antarctic ice cap may be losing mass. I do my best not to cherrypick." By reiterating that the SH and NH show different trends, as if that somehow alters the alarming problem in the Arctic, you just did. "We frequently hear about record high Arctic temperatures in the Arctic when in fact our instrumental record for the Arctic is very slim and calls for enormous extrapolations." Check the UAH/RSS graphs of satellite temperatures for the northern latitudes. See Ned's recent temperature compendium and the graph of north polar temperature data I presented here. Not slim, little or no extrapolation needed.
    0 0
  10. I agree that in order to best educate skeptics and others is to show consistent, reliable evidence pointing to how much humans are contributing to Climate Change. Most of the skeptics I come across pretty much know the Earth is warming but they think it's "Just natural so there is no sense worrying about it." If agencies like NASA, NOAA and others focus more on human caused Climate Change I think that would go a long way toward helping people realize that we should focus on possible solutions. As far as "deniers" go nothing will convince them. I really think if there is more focus on data that tells us humans are a main cause we might get closer to finding viable solutions. I will look more into NOAA's new pages to see how much they focus on human causes... I am on vacation right now! My friends are calling me to get off this computer as I write this but I felt it is important.... bye for now! David
    0 0
  11. #54: "Was it maybe a Dansgaard-Oeschger event? We've had just 85 of these" I was under the impression these were events during glacial periods: Climate during the last glacial period was far from stable. Two different types of climate changes, called Heinrich and Dansgaard-Oeschger events,. What relevance does that have to the current temperature increase? After all, geologists have know for a long time that glacial periods are not monotonically cold.
    0 0
  12. chriscanaris's claims "recovery of NH ice", and is nicely skewered by the inclusion of the current NSIDC sea ice extent plot. It's true, however, that extent is declining much more slowly than over the last few years. That's due largely to thin ice being blown around - increased extent, lower concentration. You can get a feel for that by looking at the JAXA area graph, which shows arctic sea ice area now dropping very sharply:
    0 0
  13. Tony O at 23:07 PM on 29 July, 2010: "Thirteen; Flowering dates are changing. Poor little flowers do not know what season it is." Flowers shouldn't be trusted. Remember what they made us do in the Sixties? Surely proves they're part of the AGW-conspiracy! :P *wonders how long it will take until this'll show up in the Skeptic Arguments list*
    0 0
  14. chriscanaris: Antarctic sea ice is behaving about as predicted by the scientific community. Most people, when confronted with predictions borne out by future observations, understand that this *strengthens* the scientific case (in this case, climate science). WUWTians and the like say "antarctic sea ice isn't melting, climate science is a fraud!", in other words, a system behaving as predicted means that the science underlying the prediction is fraudulent. Kinda weird, no?
    0 0
  15. It's true, however, that extent is declining much more slowly DURING JULY than over the last few years.
    Added two crucial words ...
    0 0
  16. Further to John Russell's remarks, it seems to this layperson that where there is no ice visible there can be no ice volume. Unless the subsurface arrangement of ice is remarkably plastic and/or ice volume can increase and decline with amazing speed, steadily larger annually periodic swings in visibility of ice by us air-breathers seem to me a reasonable hint as to ice volume.
    0 0
  17. This story is linked off the front page of today's CNN, which is good to see. It also made yesterday's Fox News, including the fact that the 80's, 90's, and last 10 years are, in order, the three hottest decades on record.
    0 0
  18. I just went through some of the comments @ the CNN piece... nice to see so many people taking issue with the fact that the interviewed skeptics were: 1. someone from the Competitive Enterprise Institute, 2. someone from the Cato Institute, 3. "a blogger" and 4. "a financier who follows climate science as a hobby" instead of some, well, real climate scientists. ;)
    0 0
  19. @Berényi Péte Do you not realize that over the past year skeptics and others have taken the raw, unadjusted data and found that the results closely fit the formal records closely. You can switch out airports, or cities or rural areas and you get the same results. The satellite records are close to the surface records for the last 30 years. Anyone who has actually crunched the numbers, replicating GISS/CRU methods, or making up their own, is finding that the adjusted records are not significantly different from that produced with raw data. To return to the point of the post here, 8 or 9 other indicators corroborate the conclusion. There really is no wiggle room left for a rational mind. The planet has been warming.
    0 0
  20. Chriscanaris - "Phew! It was pretty torrid 125,00 years ago with a lot of CO2 in the air - well within the span of human habiation" Sure, if you consider less than 300ppm of atmospheric CO2 a lot. Aren't we near 390ppm now?. Chriscanaris - "and ceratinly not a young sun phenomenon." Certainly not, more like a greater insolation due to orbital eccentricity of the Earth phenomemon.
    0 0
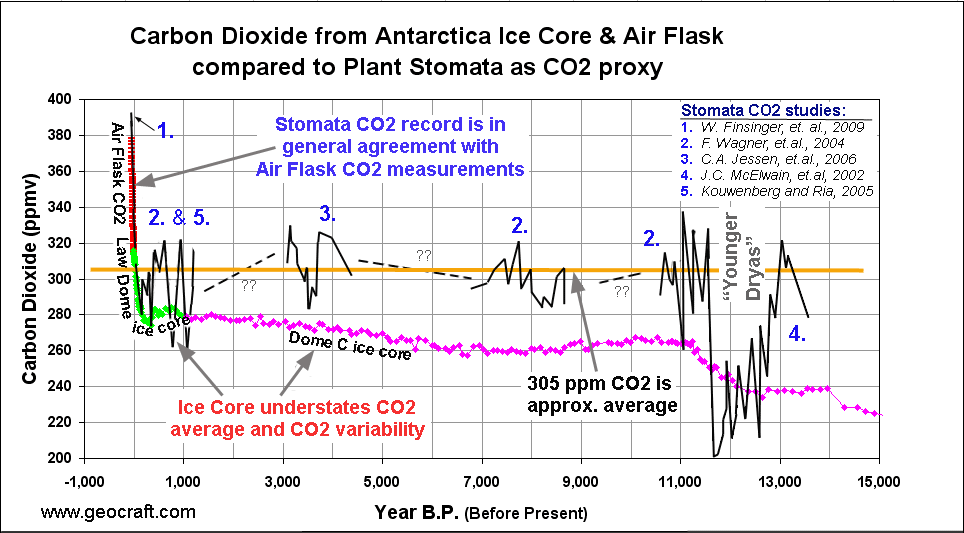
  21. Muoncounter # 9 - The premise of the stomata studies is that the calculated atmospheric CO2 is determined to be significantly higher than that determined from ice core data. What this discrepancy says is the historical amounts of CO2 in our atmosphere are subject to debate and until a more accurate determination can be made, we should not soley rely on just one method. In addition, the assessment of atmospheric CO2 over geological time gives a more accurate picture of the temp-CO2 relationship. Climate had changed regularly over time (geological time) and so studies that address those changes over such a time scale give us a more comprehensive picture than taking data that reflects a smaller time period. For instance if you were to focus on the Permian-Triassic period, one could easily surmise a positive correlation between CO2 and temperature. On the other hand, data from a 150 million year time frame (Cretaceous-Tertiary) reveals an inverse relationship with atmospheric CO2 on a clear downslope while temperatures rise and then stay steady. Also note that the CO2 content of the atmosphere over geological time has been well above the current levels, rising as high as 7,000 ppm in the Cambrian and falling to current levels only once before during the carboniferous. As for including plate tectonic events, while they do play a role in climate, the main periods of such activity were the upper cretaceous lasting for about 100 my. Since volcanoes contribute to cooling (due to a air), one might surmise that period of volcanic activity actually prevented the temperature from increasing further than data suggests, at a time when CO2 was on a sharp decrease. Canbanj # 14 - No I do not. You can contact Sootese directly and I am sure he will enlighten you. . Dan Olner # 27 - I agree to a certain extent. Many people seem to be convinced that since the global temperatures appear to be warming, that is a direct result of man-made CO2. To be there is a wide leap of faith between one (global warming) and two (it is due to man-made CO2). While science may be somewhat exact, the application of Science is where things tend to fall apart - something many people posting to this blog seem to be unable to comprehend. Glenn Tamblyn # 29 - my point for the post was to present a view that extends over the geological time scale. As you can see, in the diagram there are periods where CO2 and temperatures appear to correlate with one another (late Permian to early Triassic) and there are times when they have a negative relationship (early Cretaceous to about 1 million years ago. To fully assess the relationship, we need to see how it was over geological time and not during very small time periods. muoncounter # 21 - I am not sure what you mean by "the plot" as I posted several plots. If you are referring to the Stomata studies, the analysis is different from the one you lists which dealt with a specific plant species. Instead of accusing a person of cherry picking, step back and realize studies exist that have conclusions that conflict with one another - that is a part of science. To understand the way in which stomata are studied from a climate perspective, read this brief article on the method used: http://evolution.berkeley.edu/evolibrary/article/0_0_0/mcelwain_03 Glenn Tamblyn # 29 - It is hard to determine exactly what the sun's output has been over geological time given that we have only developed the methods to measure solar output. in the past 40 years or so. While there may be proxies used, as with all proxies there is a significant margin of error with any such data. As for Monte Heib's site, I feel he has some good arguments that need to be addressed instead of being discounted as frivolous. The focus on man made CO2 causing the warming trend many people go to great lengths to argue (notwithstanding they tend to prove that the earth is warming and not prove that the warming is attributable to man made CO2.) As a geologist I have spent my life assessing past environments and as such those who say the current warming trend is solely due to man made CO2, have to, in my mind, come up with stronger arguments to disprove that the warming is not linked to some of the many natural phenomenons that contribute to climate change. davidpalermo # 60 - I fully agree. I wonder if they have tried and not been able to come up with the answer they would like to have?
    0 0
  22. GeoGuy - regarding manmade CO2 causing the warming: Are you familiar with the following: - Isotope evidence for human driven CO2 increases in the last 150 years? - The many records indicating high CO2 concentrations now, and correlations between CO2, solar output, and temperature in the past, since CO2 isn't the only driver of climate? The 'warming sun', incidentally, is determined by not only proxy records but by clean-slate physics of fusion reactions and fusion by-products in the sun. - Correlation between CO2 and temperature in the current era? - Measured entrapment of IR at CO2 and H2O (feedback) wavelengths, with accompanying energy imbalances? Given these, it's difficult for me to see how you could come to the conclusion that manmade CO2 isn't causing the current warming. As to Monte Heib - I would take his statements with a large block of salt (or more properly coal). His website contains lots of mis-information; he seems more than a bit biased, and doesn't provide numeric support for his statements.
    0 0
  23. BP #50 I see that you have continued with off topic posting, and that you have chosen to completely ignore the substantitive parts of my argument. I can only assume that this means that you are conceding that your attitude to the analysis of the scientific big picture is lacking in logical rigour, preferring as you to to focus on isoloated bits of information where you can magnify all perceived uncertainty out of all proportion to its importance.
    0 0
  24. muoncounter @ 59: By reiterating that the SH and NH show different trends, as if that somehow alters the alarming problem in the Arctic, you just did. Damned if you do and damned if you don't. There are different trends in the two hemispheres which warrant scrutiny. Pointing this out is not cherrypicking - just statainbg a fact which is then open to a range of intepretations. Dappledwater @ 70: So inolation can matter an awful lot. I'm aware we are currently at a periood of relatively low insolation. I have never suggested that any of these phenomena negate AGW - merely that the picture is more complicated than it may appear at first sight. dhogaza @ 62: So which of the various extent metrics should we rely on? The point is that there are several of which JAXA happens to give the most pessimistic view (yet not without grouinds for optimism). New ice may eventually become old ice.
    0 0
  25. John: In light of the stir Judith Curry has created over at Real Climate and at Climate Progress (see this post here: Consensus on a scientific issue is established as science evolves through the following successive stages (Funtowicz and Ravetz, 1990) ), perhaps this would be a good time for Skeptical Science to weigh in with a post on the current scientific consensus on anthropogenic global warming today in those same terms. The National Academy of Science recently touched on this back in May in their report Advancing the Science of Climate Change - Settled Facts. But as usual, the media failed to follow up on it. Such a post would go a long way towards reducing the noise level being generated here at Skeptical Science by the usual denialist sites and their denizens. Cross-posted this at RC as well, in case you want to touch with Gavin et al to avoid duplication of effort. The Yooper
    0 0
  26. #71 "premise of the stomata studies is that the calculated atmospheric CO2 is determined to be significantly higher than that determined from ice core data." See a nice debunking of said premise. Also see another and yet another. "I am not sure what you mean by "the plot" as I posted several plots." Go back to your post where this is labeled as "The Plot" What bothered me in this 'geocraft.com' plot was the conspicuous absence of the CO2 lows mentioned by Kouwenberg etal in the 2005 paper, as shown below in their Figure 3. The geocraft.com plot cites Kouwenberg and Ria (?) from the same year; did anyone check for other work by Kouwenberg's group? So my statement was simply that whoever put together 'The Plot' used only a portion of the available data. And that the conclusion reached by Kouwenberg etal. is the polar opposite of that reached by geocraft. "studies exist that have conclusions that conflict with one another - that is a part of science" I couldn't agree more. But it is also a part of science to follow all available data trails. Unfortunately, this stomata business was picked up by the usual suspects, notably WUWT; I've already found 5 others that I won't give free publicity. And of course, WUWT gives a link back to the article at geocraft.com. This is a great illustration of the denial machine at work.
    0 0
  27. 36.CBDunkerson at 21:18 PM on 29 July, 2010 To be clear those aren't measurements you're talking about they are modelled data.
    0 0
  28. 39.Dappledwater at 21:29 PM on 29 July, 2010 It always strikes me there is no real point arguing about SH sea ice. If it's increasing it's AGW. The year it starts to shrink it will be AGW. Having all the bases covered means there is no room for anything else.
    0 0
    Response: You don't need to be so cynical. There's been a number of peer-reviewed examinations of southern sea ice which carefully and meticulously account for the various regional trends in sea ice across the Southern Ocean.
  29. 49.CBDunkerson at 22:51 PM on 29 July, 2010 A new study says that phytoplankton in the oceans have decreased by 40% since 1950. We'd better pray this is erroneous because if it isn't we're looking at a massive decrease in human population within this century. It doesn't seem to be the way the data is moving in this report!
    0 0
  30. 55.villabolo at 01:32 AM on 30 July, 2010 I live in Melbourne, weather affected by antarctic conditions. If you're going to take that position then I'm happy not to give a stuff about what's occuring in the Arctic :)
    0 0
  31. I know I'll get accused of straw men or cherry-picking or evading the issue or whatever but I think it's still worth focussing on the antarctic just because many aren't and also because I also think it goes some way to explaining what we are seeing in the arctic as well. The melt season section of the 2009 report (page S129) is interesting. This year show's a melt season in the antarctic 50% shorter than the long term average, a continuation of the recent declining trend. When highlighting extreme climate metrics I wonder why that particular one is ignored? The seesaw nature of the poles seems un-avoidable. As does the natural variability associated with that.
    0 0
  32. HR #81 The behaviour of complex systems is less linearly predictable than you might suppose from thinking about it intuitively. Have a look at this paper from Nature on Early-warning signals for critical transitions for a detailed exposition. As well as this, the sheer amount of ice at the Antarctic, dampens the effect of global warming on the weather systems around the continent, and the sheer amount of ice and its high enthalpy of melting means that we can expect rather counterintuitive weather around Antarctica for quite some time to come.
    0 0
  33. Humanity Rules @ 78 - If both poles were similar in geography, I'd expect sea ice trends would be similar, however they're not, and the situation in the Antarctic is exacerbated by the ozone hole. And yes, with continued global warming the sea ice trend will eventually reverse and begin to decline.
    0 0
  34. kdkd @ 82 Early-warning signals for critical transitions in Nature This paper has been posted on this site before. Basically, it says it's all very hard to predict. Isn't that the problem we're currently grappling with? I think a teeny weeny bit of humility is called for when looking at extraordinarily complex systems.
    0 0
  35. chriscanaris #82 "This paper has been posted on this site before. Basically, it says it's all very hard to predict." Nope. Basically it says that things are somewhat unpredictable, but expect perturbations cyclic behaviour during the transitional stage, just like the kinds of things we're observing with the sea ice extent measurements in the antarctic. It's a fascinating paper, and well worth a read. Google scholar tells me that pdfs are accessable without a subscription.
    0 0
  36. GeoGuy #71, the paleoclimate CO2 record is established by multiple lines of proxy evidence in addition to DIRECT measurements from the ice core samples. For instance isotope analysis of pedogenic minerals, long-chained alkenones in haptophytic algae, marine carbonate, and liverworts are all CO2 proxies which match the ice core results. The stomata proxy you cite assumes that CO2 levels are the only factor which can have a significant impact on the plants. Given the disparity between those results and the other sources I'd have to doubt that. It seems plausible that airborne particulates (from volcanoes or humans), insolation, humidity, rainfall, soil quality, and any number of other things could play a part. There are also several stomata studies which AGREE with the prevailing CO2 record (e.g. Van der Burgh et al., 1993; McElwain and Chaloner, 1995). Thus, this is not a question of one CO2 proxy vs another. It is one dubious writeup on a WEB-SITE vs overwhelming evidence to the contrary.
    0 0
  37. HumanityRules #77, to be CLEAR those are results modeled based on the available measurements. Hence my calling them estimates. Also note that when IceSAT was online we DID have direct measurements of ice volume... and they matched the PIOMAS estimates very closely. Thanks to CryoSAT II we'll know in a few months whether PIOMAS has continued to be that accurate, but given the complete collapse of ice thickness and concentration (as shown even on the PIPS site you have previously preferred to cite) it is clear that ice volume has undergone a huge collapse. As to 'cherry picking' when talking about ice melt... by all means let's look at the full picture; NH sea ice: Declining NH land ice: Declining NH all ice: Declining SH sea ice: Increasing SH land ice: Declining SH all ice: Declining Global sea ice: Declining Global land ice: Declining Global all ice: Declining Yep, the 'alarmists' sure are 'cherry picking' by not concentrating on that SH sea ice.
    0 0
  38. Why does The State of the Climate 2009 document state in one line that Arctic ice multiyear ice has increased by 11% from 2008 to 2009 then move on in the next line to state that these two numbers are similar? (S113-114) Increased multiyear ice doesn't fit the complete story of unidirectional metrics. [pointless speculation about motivations deleted]
    0 0
    Moderator Response: Please bear in mind that if you mix potentially useful questions about science with speculation about conspiracies and the like, you may end up wasting the time of other people when entire swathes of comments are removed. Try your best to stick with discussing science.
  39. HumanityRules at 22:07 PM on 30 July, 2010 "Why does The State of the Climate 2009 document state in one line that Arctic ice multiyear ice has increased by 11% from 2008 to 2009 then move on in the next line to state that these two numbers are similar?" You're contriving confusion by imprecise precis HR. The full paragraph of which you speak is reproduced below [*]. "What does this mean?" (i.e. re data available for bona fide research purposes). The first answer is that you could enquire to the NOAA for their precise reason for that statement. However there are lots of possible reasons. In my experience that sort of statement comes up quite frequently in various contexts; e.g.: (i) Publically-funded research is specifically made available for research purposes (even if there may be some increasingly out-dated "embargos" involving commercial publishing of publically-funded research). However it shouldn't be used, for example, by commercial organisations to advance their interests (e.g. climate data used by a company selling weather forecasts). (ii) protection of intellectual property and copyright. For example as a "bona fide" researcher, I can download figures from other peoples published papers and to display these in lectures (e.g. for teaching or for scientific presentations). However I am not allowed to do this for commercial gain. etc. etc. "If your looking for reasons I express cynical statements... I get the impression that the "reasons [you] express cynical statements" may be because you like to maintain a"rolling boil" of contrived indignation about science that happens not to suit your fancy! (in the UK we call that behaviour "Daily Mail syndrome"). Thus your tendency to false precis. Generally scientists go to some efforts to state clearly what they mean. it's unfortunate when others incorrectly precis their writing in order to contrive an impression of confusion! ---------------------------------------- [*]STATE OF THE CLIMATE IN 2009 p S113-S114
    In the past decade, the extent of multiyear sea ice rapidly reduced at a rate of 1.5×10⁶ km6 per decade, triple the reduction rate during the three previous decades (1970–2000). Springtime multiyear ice extent was the lowest in 2008 in the QuikSCAT data record since 2000 (Nghiem et al. 2007). QuikSCAT results in March 2009 showed a multiyear ice extent of 3.0 ± 0 .2 million km2. This was 0.3 million km2 larger (11% increase) than the multiyear ice extent on the same date in 2008, even though the total sea ice extent was similar in the spring of 2008 and 2009. While the multiyear ice extent was similar in March 2008 and 2009, its distribution was quite different. More specifically, in 2008 there was a significant amount of multiyear ice in the Beaufort Sea and in 2009 there was a large amount of multiyear ice in the central Arctic Ocean.
    0 0
  40. HumanityRules at 13:55 PM on 30 July, 2010 If one is interested in the polar response to global warming, it's helpful to know that we have long expected that the Antarctic response would be delayed compared to the rapid Arctic response. For example, modelling from the early 1980's predicted that enhanced greenhouse-induced warming would be focussed in the Northern polar regions leaving the Antarctic regions relatively unaffected for considerable periods. A recent review of early modelling of the ocean response to global warming described predictions from early modelling: S. Manabe and R. J. Stouffer (2007) Role of Ocean in Global Warming J. Meterolog. Soc. Jpn. 85B 385-403 Here are some excerpts from the sections of this article describing the predicted hemispheric asymmetry (much greater N. hemispheric polar warming and delayed Southern polar warming). So, discussing the early models of Schneider and Thompson (1981) to evaluate the delay in the response of the sea surface temperature to gradual increase in CO2, Manabe and Stouffer say:
    "Their study shows that the time-dependent response of zonal mean surface temperature differs significantly from its equilibrium response particularly in those latitude belts, where the fraction of ocean-covered area is relatively large. Based upon the study, they conjectured that the response in the Southern Hemisphere should be delayed as compared to that in the Northern Hemisphere because of the inter-hemisphere difference in the fraction of the area covered by the oceans.”
    In a later model Bryan et al (1988) made the same sort of analysis, investigating the role of the oceans in modulating the response of surface warming to enhanced greenhouse gases.
    “They found that the increase in surface temperature is very small in the Circumpolar Ocean of the Southern Hemisphere in contrast to high latitudes of the Northern Hemisphere where the increase is relatively large.”
    It’s not just the oceans per se of course. It’s also ocean and air currents, and particularly the mechanisms governing the efficiency of surface heat transfer into the deeper oceans. If this is efficient, the deep oceans will absorb heat and there might be little measured surface warming, at least for a while. So (speaking of Bryan et al (1988)) again:
    “However, the detailed analysis of the numerical experiment reveals that the absence of substantial surface warming in the Circumpolar Ocean is attributable not only to the large fraction of the area covered by the oceans but also to the deep penetration of positive temperature anomaly into the oceans.”
    Later models predict the same hemispherical asymmetry that is seen in the real world. e.g. discussing the simulations of Manabe et al (1992):
    “Figure 3 also reveals that there is a large asymmetry in surface warming between the two hemispheres. In the Northern Hemisphere, the surface warming increases with increasing latitude, and is particularly large in the Arctic Ocean. This is in sharp contrast to the Southern Hemisphere, where warming is relatively large in low latitudes and decreases with increasing latitudes. It becomes small in the Circumpolar Ocean of the Southern Hemisphere, particularly in the immediate vicinity of Antarctic Continent.”
    Why is this, one might ask?! Here’s what Manabe and Stouffer say:
    “One can ask: why the polar amplification of warming does not occur in the Southern Hemisphere, despite the existence of extensive sea ice which has a positive albedo feedback? As discussed in the following section, the absence of significant warming in the Circumpolar Ocean of the Southern hemisphere is attributable mainly to the large thermal inertia of the ocean, which results from very effective mixing between the surface layer and the deeper layers of ocean in this region. This is in sharp contrast to the Arctic Ocean, where very stable layer of halocline prevents mixing between the surface layer and the deeper layer of the ocean.” and “In view of the absence of significant surface warming, it is not surprising that the area coverage of sea ice hardly changes in the Circumpolar Ocean despite the CO2-doubling.”
    (n.b. remember this is a prediction from a model; we’re nowhere near CO2 doubling yet!). However that's what we're seeing in the real world. So the delayed warming in the deep Southern oceans and Antarctic is consistent with models/predictions from more than 20 years ago.
    0 0
  41. #87 CBDunkerson at 21:51 PM on 30 July, 2010 Yep, the 'alarmists' sure are 'cherry picking' by not concentrating on that SH sea ice OK, let's have a look at NH snow cover trends. Spring snow cover in the Northern hemisphere is declining indeed. However, it is not the end of story. NH snow cover trend for weeks of year, in km2/year units (1972-2009) Not all "forcings" are born equal. They act on different parts of the climate system, therefore their strength expressed in W/m2 units does not fully determine their effects. The NH snow cover annual trend graph has a sharp minimum at week 23.5 (summer solstice is week 24.5), while its maximum is at week 52 (winter solstice is week 51). What we can see here is that snow cover trends are almost exactly in phase with insolation. As surface temperatures lag insolation by almost two months due to high heat capacity of the climate system (mostly oceans), the trend observed is not caused by temperature (that is, by trapping outgoing longwave radiation), but by increased absorption of incoming shortwave radiation. It is a big difference. One might even call it the smoking gun of climate science. It is all the more important because unlike most other climate indicators it is not lost in noise, but stands out very clearly. Snow cover is increasing through mid October to January, when Northern Hemisphere insolation is low, decreasing otherwise. Therefore it is some immediate effect of sunshine, not a delayed one like the alleged thermal radiation trapping effect of carbon dioxide. For thermal radiation getting available to be trapped, surface temperatures have to be increased first. But that does not happen until later in the year. The most probable candidate for increased SW absorption is decreasing snow albedo due to black carbon (i.e. soot). There is also a positive albedo feedbeck at work here. The more snow is melting, the more bare soil is exposed to the sun. This very albedo change can explain glacier and ice sheet phenomena as well. The good news is that residence time of soot in the atmosphere is very low (around 1 week), so as soon as emissions are decreased, the effect vanishes. It is also much cheaper to reduce soot emissions than carbon dioxide, as the technology is already available and is mostly installed throughout developed countries. What about a soot duty on Chinese products? And a ban on small Diesel engines perhaps (like those in cars). Or help to replace heavy soot generating biofuels (like dung) as cooking materials in India and Africa by natural gas or electricity? Or to introduce reasonable woods maintenance practice in North America by making removal of dead wood from managed forests compulsory (as it is done in Europe)?
    0 0
  42. Not another smoking gun? It's hard to force my way out the door in the morning because of all the smoking guns laying about. In fact, thinking along Peter's lines, all the smoke from the smoking guns very well may save us yet.
    0 0
  43. BP writes: What we can see here is that snow cover trends are almost exactly in phase with insolation. As surface temperatures lag insolation by almost two months due to high heat capacity of the climate system (mostly oceans), the trend observed is not caused by temperature (that is, by trapping outgoing longwave radiation), but by increased absorption of incoming shortwave radiation. That is what in science is called a hypothesis. It is not a conclusion or a smoking gun or anything else. You really need to stop leaping to inappropriately vast conclusions based on pure speculation.
    0 0
  44. Very often I see the better-informed skeptics expressing frustration that we don't deal with their more sophisticated and reasonable claims, instead of spending so much time correcting the same basic and obviously-wrong nonsense ("Is the greenhouse effect real? Is the CO2 increase real? Wasn't CO2 a lot higher before WWII?" etc.) I can understand that. It must be frustrating to have what seem to you to be sensible, serious questions about climate that just get drowned out in all the noise about whether CO2 is actually a greenhouse gas (it is) and whether the greenhouse effect violates the second law of thermodynamics (it doesn't). The problem is that as long as intelligent and competent skeptics can't bring themselves to stop writing things like [...] the alleged thermal radiation trapping effect of carbon dioxide [...] we're never going to get very far. Maybe there is something interesting about the role of soot in the timing of snowmelt, and the implications for climate. Maybe it would be fun to talk about it. But why would I waste my time discussing that with someone who apparently refuses to acknowledge fundamental science that has been understood since the mid-1800s? Reading BP's comment just makes me feel very discouraged about the idea of any meaningful discussion with "skeptics". Here's a serious question. Is there any "skeptic" reading this thread who is willing to categorically state that yes, CO2 is in fact a greenhouse gas? No caveats, no "allegedly", no "for the sake of argument". Just "yes".
    0 0
  45. BP, you've apparently forgotten that we've discussed that snow melt graph before. Had you remembered you'd likely realize that I'd point out the same flaw in your logic that I did last time. Specifically, the minimum (i.e. greatest rate of decrease) comes a week BEFORE the Summer solstice... yet the insolation a week AFTER the Summer solstice would be just as great and falling onto snow with two more weeks of accumulated soot. Ergo, if your 'insolation + soot = cause of melt' hypothesis were accurate we should be seeing the minimum AFTER the solstice, not before it. The other thing I believe many people pointed out the last time you trotted this out was something called precipitation. There is alot of it in the form of rain in the Spring which accelerates snow retreat and alot of it in the form of snow in the Winter which decreases (and indeed reverses) snow retreat.
    0 0
  46. Another thought on snow melt... by the time Summer comes around most snow is GONE. Ergo, it is not surprising that the rate of snow decline in Summer hasn't grown as much as the rate of snow decline in Spring. 'Smoking gun' go 'poof'.
    0 0
  47. CBDunkerson # 86 - It is hardly one dubious writeup that I posted the link to. It was an analysis of the approach and if you took the time to scroll down to the bottom to review the references and then followed up by reading some of the references, you will learn that what can be determined by stomata analysis is that the past amounts of atmospheric CO2 fluctuated a great deal more than has been proposed by groups such as the IPCC. I have always had a problem with ice core analysis because of the complex pressures and temperatures that any trapped gasses would undergo over time. There are valid critiques of ice core analysis available to read for those who are interested in doing so. My position is that when you look at both sides of the argument, you will find valid research to support both sides. This tells me the issue is more complex than many people seem to accept and therefore warrants further research by BOTH sides. In the end we need to focus on adapting to climate change as simply curtailing our carbon footprint (if we could ever achieve that) would not work if climate change is being driven primarily by factors beyond our control.
    0 0
  48. Ned # 94 - Yes, Yes, Yes...I do know that CO2 does have characteristics similar to a greenhouse. I first learned about the greenhouse gas effect nearly 40 years ago as an undergrad in geological engineering. Hence I am a believer of the greenhouse gas effect and any geologist would certainly agree. However the greenhouse gas effect is not what is at play here. From strictly a thermodynamics perspective, a single degree increase in atmospheric temperatures is not to account for the melting of the glaciers etc. I believe that Berényi Péter's post (#91) is closer to the truth. What I fail to accept is the strength many are attributing rising atmospheric CO2 has in driving climate change - that is what I am debating. Too often those on one side argue about how the planet is warming and come to the conclusion that it is man made CO2 that is driving that warming. I have yet to see any consequential evidence to support that position, particularly given that data exists to support the contention that other factors could be at play here. Many of the indicators of climate warming, as posted in this particular blog do not in any way relate to increased CO2 as being the cause. In fact the authors of the report failed to identify the cause for the warming.
    0 0
  49. Geo Guy at 07:22 AM on 30 July, 2010 Geo Guy at 03:17 AM on 31 July, 2010 It's hard to believe that a Geologist would consider the Scotese graph of any value in considering the relationships between Earth temperature and atmopheric [CO2] in the deep past. You must be aware, for example, that there is zero [CO2] data presented there. The apparent [CO2] data is from Berner's model of possible [CO2] based on an analysis of weathering rates and such like. Each data point is 10 million years apart. Broad swathes of vast geological time are sketched as having a single temperature...I'm sure Dr. Scotese never meant his sketch to be used in lieu of the scientific data, to assess these relationships! It should be obvious that the relationship between atmospheric CO2 levels and paleotemperature can only be assessed at those specific time points where paleotemperature and paleoCO2 data are contemporaneous. Where we have data points for paleotemperatures and paleoCO2 levels that match in time, the evidence is rather strong for a CO2/temperature coupling. Where paleo temperatures are high paleoCO2 levels are high and cold/glacial periods are associated with low CO2 levels. There's now extremely abundant information on this dating back many hundreds of millions of years. A recent review compiles much of the data and some of this has been discussed in detail elsewhere on this site. D.L. Royer (2006) "CO2-forced climate thresholds during the Phanerozoic" Geochim. Cosmochim. Acta 70, 5665-5675. a wealth of more recent data provides additional evidence for a strong relationship between [CO2] and temperature in the deep past. See for example: R.E. Carne, J.M. Eiler, J. Veizer et al (2007) "Coupling of surface temperatures and atmospheric CO2 concentrations during the Palaeozoic era" Nature 449, 198-202 W. M. Kurschner et al (2008) “The impact of Miocene atmospheric carbon dioxide fluctuations on climate and the evolution of the terrestrial ecosystem” Proc. Natl. Acad. Sci. USA 105, 499-453. D. L. Royer (2008) “Linkages between CO2, climate, and evolution in deep time” Proc. Natl Acad. Sci. USA 105, 407-408 Zachos JC (2008) “An early Cenozoic perspective on greenhouse warming and carbon-cycle dynamics” Nature 451, 279-283. Doney SC et al (2007) “Carbon and climate system coupling on timescales from the Precambrian to the Anthropocene” Ann. Rev. Environ. Resources 32, 31-66. Horton DE et al (2007) “Orbital and CO2 forcing of late Paleozoic continental ice sheets” Geophys. Res. Lett. L19708 (Oct. 11 2007). B. J. Fletcher et al. (2008) “Atmospheric carbon dioxide linked with Mesozoic and early Cenozoic climate change” Nature Geoscience 1, 43-48. And so on…..
    0 0
  50. Geo Guy at 03:42 AM on 31 July, 2010 I believe that Berényi Péter's post (#91) is closer to the truth. Great, but what's your evidence? It's all very well to state that black carbon has a contribution to global warming. No one doubts that. However its influence has to be quantitated if we wish to have a reliable assesment of contributions to warming. This quantitation has been (and continues to be) done, and black carbon is incorporated into scientific assessments of the contribution to 20th century and contemporary warming (e.g. here and here). It's a significant but small fraction of the forcing from enhanced [CO2].
    0 0

Prev  1  2  

You need to be logged in to post a comment. Login via the left margin or if you're new, register here.


The Consensus Project Website

THE ESCALATOR

(free to republish)


© Copyright 2024 John Cook
Home | Translations | About Us | Privacy | Contact Us