Climate Science Glossary

Term Lookup

Enter a term in the search box to find its definition.

Settings

Use the controls in the far right panel to increase or decrease the number of terms automatically displayed (or to completely turn that feature off).

Term Lookup

Settings


All IPCC definitions taken from Climate Change 2007: The Physical Science Basis. Working Group I Contribution to the Fourth Assessment Report of the Intergovernmental Panel on Climate Change, Annex I, Glossary, pp. 941-954. Cambridge University Press.

Home Arguments Software Resources Comments The Consensus Project Translations About Support

Bluesky Facebook LinkedIn Mastodon MeWe

Twitter YouTube RSS Posts RSS Comments Email Subscribe


Climate's changed before
It's the sun
It's not bad
There is no consensus
It's cooling
Models are unreliable
Temp record is unreliable
Animals and plants can adapt
It hasn't warmed since 1998
Antarctica is gaining ice
View All Arguments...


Username
Password
New? Register here
Forgot your password?

Latest Posts

Archives

The Past and Future of the Greenland Ice Sheet

Posted on 31 July 2010 by Ned

Guest post by Ned

The Greenland ice sheet has a negative mass balance, meaning that it is losing ice (Velicogna 2009, Jiang 2010).  This loss occurs because the gain of new ice (in the form of snowfall within the ice sheet's interior zone of accumulation) cannot keep up with the rapid loss of ice through melting and the discharge of ice by marine terminating outlet glaciers (van den Broeke 2009).  Figure 1 shows the overall downward trend in the ice sheet's mass:
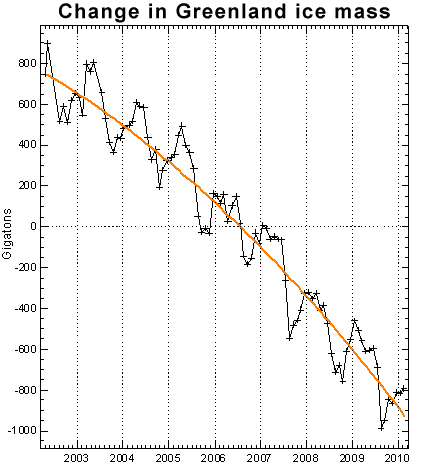

Figure 1: Greenland ice mass anomaly (black). Orange line is quadratic fit (John Wahr).

As recently as the 1980s Greenland's ice was probably more or less in equilibrium (Rignot 2008, Jiang 2010). But by the late 1990s and early 2000s this ice began to retreat, and the rate of retreat may be accelerating (Velicogna 2009, van den Broeke 2009).  Some claim that there's no need to worry about this, since only a tiny fraction of the total ice mass is being lost each year.  Others point out that the accelerating rate of loss means that there may be trouble ahead

Who is right, and how can we tell?  There are two ways of answering this question - we can look at the history of the Greenland ice sheet to see whether past episodes of warmth have led to extensive loss of ice, and we can use physical ice sheet models to predict the future behavior of Greenland's ice in a warming climate.

Pleistocene history of the Greenland ice sheet

 A new paper published this month in Quaternary Science Reviews (Alley et al. 2010) provides a very comprehensive overview of the history of the Greenland ice sheet over the past half-million years.  In general, the further back we look in time, the less certainty there is about the condition and extent of Greenland's ice.

Paleoclimate scientists divide the Quaternary cycles of glacial cooling and interglacial warmth into a series of Marine Isotope Stages (MIS).  The Holocene, the current warm stage in which our civilization has arisen and flourished, is MIS-1.  The most recent glacial episode (from approximately 110,000 to 14,000 years ago) is divided into MIS-2, -3, and -4.  The last previous interglacial, from 130,000 to 110,000 years ago, is referred to as MIS-5e.  Looking back further in time, glacial and interglacial episodes alternate, with MIS-6, -8, and -10 being glacial and MIS-7, -9, and -11 being interglacial. 

Note that the earliest of these interglacial episodes (MIS-11, around 400,000 years before present) is believed to be the best analog to our current MIS-1 interglacial climate, based on the geometry of the Earth's orbit (Berger and Loutre, 1991).

History of the Greenland ice sheet prior to the last interglacial:  Greenland's ice is believed to have shrunk during warm interglacial episodes MIS-11, -9, and -7.  During MIS-11, the most similar to our current interglacial, sea levels were much higher, probably enough to necessitate the near-total loss of Greenland's ice (Alley 2010), and ancient DNA found at the bottom of ice cores likewise suggests an ice-free Greenland at this time (Willerslev 2010).  Likewise, during glacial advances MIS-10, -8, and -6, Greenland's ice expanded and global sea levels dropped.  The greatest expansion of ice may have occurred during MIS-6, just prior to the last interglacial (Alley 2010).

Greenland during the last interglacial (120,000 years before present):   The Greenland ice sheet did not entirely disappear during MIS-5e, though it was smaller and steeper.  There is no ice predating MIS-5e at the bottom of cores from south, northwest, and east Greenland, but older ice is present in central and north-central Greenland ice cores, where (based on the gas content of bubbles in the ice) it appears to have been close to or slightly thinner than today's ice sheet (Alley 2010).  Figure 2 shows a model comparison of today's ice sheet with the ice sheet during MIS-5e. 
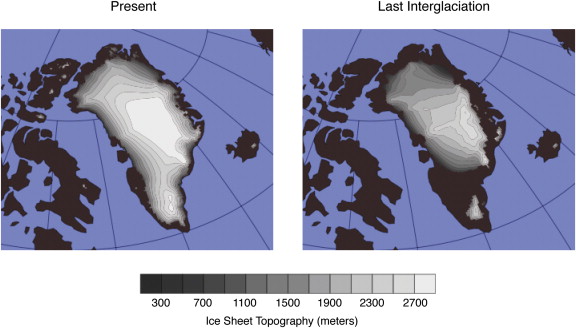
 

Figure 2: Modeled configuration of the Greenland Ice Sheet today (left) and in MIS 5e (right), from Otto-Bliesner (2006).

Alley (2010) conclude that it is probable that the loss of ice from Greenland during this time period contributed approximately 3–4 m to global sea levels, in response to a local warming of around 3°–4 °C in Greenland.  This nicely fits with our understanding that sea levels were at least 6 m higher that today;  the remainder of that rise would have come from the loss of ice in West Antarctica, mountain glaciers, and thermal expansion of seawater.

The last 100,000 years:   The Greenland ice sheet expanded during the final Pleistocene glacial advance (MIS-4, -3, and -2), until around 24,000 years before present, when it covered an area 40% larger than its current extent.  With the end of this last glacial episode the world warmed, the other large continental ice sheets in North America and Eurasia retreated, sea levels rose by tens of meters, and Greenland's ice sheet shrunk significantly. However, superimposed on this broad pattern of expansion and contraction were a large number of shorter-duration (millennial-scale) increases and decreases in ice mass, generally associated with changes in North Atlantic circulation and other regional climate transitions. 

The future of the Greenland ice sheet

Stone (2010) have used models to simulate the likely future loss of ice from Greenland in response to anticipated future warming.  The loss of most of the ice sheet would likely occur at atmospheric CO2 concentrations somewhere between 400 and 560 ppm, a rather disturbing finding given that we are currently at 392 ppm and will probably exceed 560 ppm later this century, as shown in Figure 3. 
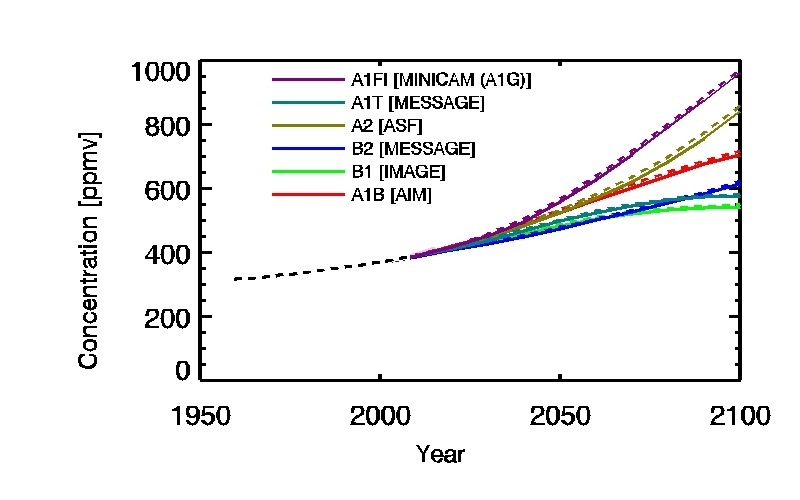
 

Figure 3: Atmospheric CO2 concentrations as observed at Mauna Loa from 1958 to 2008 (black dashed line) and projected under the 6 SRES marker and illustrative scenarios.  From IPCC.

This loss of ice from Greenland alone would be enough to raise sea levels by roughly six meters.   This process would probably take centuries or millennia.  The fact that Greenland was largely free of ice during the previous interglacial episode MIS-11 (Alley 2010) confirms that this is not an unrealistic scenario.

Some people find the subject of post-2100 climate changes rather abstract.  In contrast, 2100 itself is not that distant -- based on life expectancy data, the average girl born in Japan in 2015 will still be living in 2100.  So what are the likely outcomes for Greenland (and global sea level) over the remainder of this century? 

An accurate answer to this question requires consideration of the physical constraints on the discharge of ice from Greenland into the surrounding ocean.  Figure 4 shows some of these constraints, including the locations of marine terminating glaciers and the fraction of Greenland's bed that is below sea level.  Realistic modeling of the kinetics of glaciers suggests that a total increase in sea level of 0.8 m from all sources is likely by 2100, with increases of up to 2 m possible but increasingly unlikely (Pfeffer 2008).  This matches closely the results of another semi-empirical study (Vermeer and Rahmstorf 2009) of the relationship between temperature and sea level. 

The uncertainty in this range mostly relates to the rate at which ice is lost through calving by Greenland's marine-terminating outlet glaciers; the surface mass balance (between precipitation and melting/runoff) is much more predictable.  The 0.8 to 2 m range of global sea level rise by 2100 would imply 7.1 cm of sea level rise from Greenland's surface mass balance, plus 9.3 to 46.7 cm from ice discharged into the ocean by Greenland's outlet glaciers (Pfeffer 2008). 
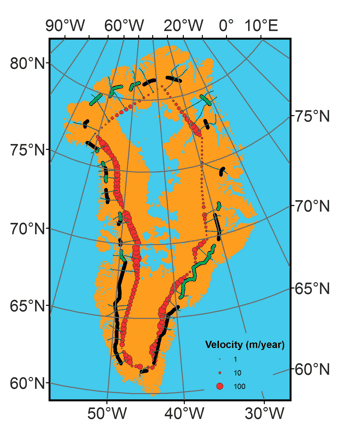
 

Figure 4: Map showing Greenland and outlet glacier gates; marine-based gates are shown as dark green and nonmarine as black. Regions below sea level are colored blue. Ice velocities at ~2000 m elevation shown by red dots (Pfeffer 2008).

In conclusion, a pessimistic but reasonable scenario would produce the melting of somewhere around 5% of the Greenland ice sheet by 2100, contributing 16 to 54 cm to global sea level rise (which in turn would then total 80 cm to 2 m from all sources).  However, at that point the collapse of Greenland's ice sheet would just be getting started - failure to constrain CO2 concentrations below 400-560 ppm would almost certainly lead to the near-total loss of the ice sheet, as we have seen from both model results and comparison to the MIS-11 interglacial climate of 400,000 years ago.

0 0

Printable Version  |  Link to this page

Comments

1  2  Next

Comments 1 to 50 out of 58:

  1. Excellent summary Ned. Do we also have a good handle on fluctuations in the more recent period? Your "around 24,000 years before present, when it covered an area 40% larger than its current extent" implies that since then it has gradually retreated to its present extent, but I assume not below? Obviously I ask because of the constant and long standing denier refrain about Greenland being "green" 400 years or so ago - the implication being that the ice sheet rebuilt to its present extent in just the last 200 or so years - an astonishing achievement!
    0 0
  2. Has anyone figured out what temperatures were achieved in the models used by Stone 2010? Specifically I am wondering about the 400 ppm scenario and how it would get so warm as to melt a lot (or most in one particular case) of Greenland's ice by 400 years from the present.
    0 0
  3. Is there anyway of knowing how much this stuff is in the Greenland? http://www.reuters.com/article/idUSTRE66S57H20100729 I would believe part of the meltpools drain in this kind of reservoirs, once filled, they'll burst like some subglacial volcano lake.
    0 0
  4. If you can handle a question from a real beginner, what, if anything, is the relationship between the Greenland ice sheet, carbon dioxide, plate tectonics, and sea level rise?
    0 0
  5. Hunt: The latest paleo records indicate that the last time CO2 levels were similar to today's was about 15,000,000 years ago. Ellesmere Island in the Canadian Arctic sported boreal forests and enjoyed winters similar to parts of Southern Canada or Southern Alaska (mild winters, but still some snow). Greenland would have been largely ice-free, resulting in a nearly 6-meter sea level rise. Of course, this much of a rise from Greenland's ice loss would have already triggered a commensurate ice loss from the WAIS in Antarctica (conservatively, a composite 9 meter sea level rise - not that the extra 3 meters would matter). Remember, central Greenland is below sea level, so once the sea makes a meaningful entry through the coastal mountain ranges, it's game over for the ice sheet. With no way to reverse CO2 rises from current levels (we can't even figure out how to slow emissions, let alone how to make CCS work), the Greenland ice sheet is Dead Man Walking. How quickly? (shrugs) No one knows. The rate of mass loss is rising quickly, with no indication that it will stay uniform. Some indication in the paleo record indicates severe losses have occurred in less than a century's time (multiple-meter rises in sea level). Again, once the sea gains access through the coastal ranges, it's done. As the sheet offloads the ice, isostatic rebound of the basement rock increases (it is already doing so). Ice quakes on the sheet are recorded routinely (none significant). Possible tectonic activity could occur at some point in response to the offloading. As the Guardian link mentions, as far as sea level rise is concerned, the 1st meter of rise is the most important. If it happens too quickly, every sea level city in the world is done. Mark Lynas' 6 Degrees is a must-read (link to review provided). We are basically at 1 degree now, locked in for 2 more; the remaining debate is if it's possible to avoid the Full Monty discussed in the link. Alley's Biggest Control Knob lecture a must-see (link also provided) for an internalizing of the effects of CO2. Check out these references (not a comprehensive listing, of course, but representative of 15-minutes searching can provide): Why Greenland's ice loss matters Greenland ice sheet won't collapse Is Greenland gaining or losing ice? Greenland used to be green What links the retreat of Jakobshavn Isbrae, Wilkins Ice Shelf and the Petermann Glacier? Glaciers melting so fast, a generation will be too late Six steps to hell CO2 biggest control knob The Sermilik fjord in Greenland: a chilling view of a warming world Ice Sheets Can Retreat 'In A Geologic Instant,' Study Of Prehistoric Glacier Shows Greenland - No Ice Greenland - IPCC - Ice Melt I remember bookmarking a rotatable 3D animation someone had created of Greenland with no ice, but no luck on finding it with this tired brain tonight. Dig through this stuff for a start. Digest what you don't already know. Anything I can help you with, let me know. The Yooper
    0 0
  6. For Daniel (no. 5): Thanks very much. I'm writing an introductory survey on sea level rise and, being a mere generalist, need to rely on the kindness of strangers like you. Would you have any interest in reading (I can't pay you anything) my draft Preface, which describes the IPCC; draft Introduction, which tries to be a primer on global warming; and/or Chapter 1, which seeks to explain why sea level rise is important. If interested, please contact me off line at huntjanin@aol.com
    0 0
  7. I'm pretty sure that the figures (from a 2008 pub) for the portion of mass balance loss due to melt runoff are dated. Newer studies indicate that the runoff is moving closer to half of the mass balance decline. This makes sense since the edges of the ice sheet are retreating rapidly, reducing feed to the outflow glaciers, while at the same time the melt lakes and moulins are increasing in size and quantity, and quite rapidly these days. Sorry, I don't have that study at the tip of my fingertips, it's somewhere on my blog, for sure, but others may be aware of it.
    0 0
  8. Sorry, forgot to say that this was a really excellent post.
    0 0
  9. Exc. post. I just returned from 9 days on the Greenland ice sheet at the NEEM drill site. They succeeded in bringing up the oldest ice ever recovered from Greenland. The Eemian and even the penultimate ice age before it is represented. There are some surprises in the ice core. There seem to be some rapid descents into colder conditions than are normally seen. The rapid (very rapid) warmups are also seen. They were able to do do 018 measurements as the core came up and the Eemian shows up very clearly. I have a tiny vial of water with me (Still travelling toward home) that was from ice at the bottom of the core. The water is from snow that fell in Greenland 150K years ago! dan
    0 0
  10. Perhaps your data period is too short for a reasonable comparison of recent Greenland warming? Chylek et al (2006) show that the rate of warming in, “1920-1930 was about 50% higher than that in 1995-2005.” They conclude that ,”… the current Greenland warming is not unprecedented in recent Greenland history. Temperature increases in the two warming periods are of a similar magnitude, however, the rate of warming in 1920-1930 was about 50% higher than that in 1995 - 2005.” They summarise that they, “… find no direct evidence to support the claims that the Greenland ice sheet is melting due to increased temperature caused by increased atmospheric concentration of carbon dioxide…The temperature trend during the next ten years may be a decisive factor in a possible detection of an anthropogenic part of climate signal over area of the Greenland ice sheet.”. They conclude that current temperatures are, “well below” those reached in the 1930s and 1940s. I enclose a copy of their chart of Greenland temperatures from 1900–2005 which appears to support their conclusion. Figure 1: Comparison of Current Greenland Temperatures with Previous Temperatures (Chylek et al, 2006) Perhaps we should wait until definitive records over a longer timescale are available before we reach unwarranted conclusions about AGW causing melting of the Greenland icecap?
    0 0
  11. angusmac at 00:24 AM on 1 August, 2010
    They conclude that current temperatures are, “well below” those reached in the 1930s and 1940s.
    No, angusmac, that's a false précis. The term “well below” was used only once in Chylek et al. 2006, and refers specifically to the years 2004 and 2005 in one location (Ammassalik)! The passage containing “well below” is reproduced below and we can look at those two words in context [*]. It’s obvious from the Figure you reproduced that current temperatures in those coastal sites in Greenland are similar now to temperatures in the 1930’s/1940’s. [*] (my highlight) [see near start of section 5. of Chylek et al (2006)]
    ”The year 2003 was extremely warm on the southeastern coast of Greenland. The average annual temperature and the average summer temperature for 2003 at Ammassalik was a record high since 1895. The years 2004 and 2005 were closer to normal being well below temperatures reached in 1930s and 1940s (Figure 2).
    Otherwise it’s worth being a little more considered about the data on the progression of Greenland temperatures during the 20th century which indicates: (i) Current Arctic temperatures are warmer now than during the 1930's/40's, (ii) early 20th century Greenland temperature rise likely had different causes to current warming, and (iii) the evidence supports the conclusion that Greenland will continue to warm quite a bit further in the coming decades ( barring large volcanic events): (i) A recent multiproxy temperature reconstruction (Kaufmann et al, 2009) indicates that the last decade was the warmest in the Arctic for the last 2000 years, and 20th century warming has reversed a long term (and extremely slow 0.22 oC per mellenium) cooling trend. Contemporary temperature measures indicate that the Arctic as a whole is warmer now than during the mid-20th century, even if Greenland itself may be not much warmer (and accordingly Arctic sea ice retreat was likely minimal during the time of the apparent Greenland summit temperature max). (ii) The Greenland ice sheet is very sensitive to volcanic (and also solar and aerosolic) variability, with volcanic activity greatly suppressing temperature responses to global warming. A recent study of Greenland temperature (Box et al, 2009) also found that Greenland was around as warm (and possibly a tad warmer) during 1930-40 than now. The rapid rate of warming during late 20's to late 30's almost certainly had a strong contribution to the suppression of temperatures associated with the prolonged period of high volcanic activity from the late 19th century through the first decade of the 20th century (e.g. see Figure 11 of Box et al, 2009). We should also consider black carbon (BC) which has a strong warming effect when it's deposited on snow/ice; BC levels are identified in Greenland cores (McConnell et al, 2007) and were high through the period of rapid warming (they dropped in Greenland once Western industrial nations cleaned up emissions in the 50's, and BC is largely from Asia now,and mostly affecting the Himalayas). (iii) So one does need to be careful with attributing temperature variations in Greenland. These are not necessarily related to phenomena that influence Arctic temperatures overall. Obviously in the present widescale warming both Greenland and the Arctic as a whole are warming. One of the potentially concerning observations of Box et al is that Greenland tends, as a result of “polar amplification” to retain a phase relationship with overall N. hemispheric warming, such that it eventually rises to a temperature anomaly around 1.6 times that of the N. hemisphere. It’s way below that now, and if this relationship holds up Greenland has got quite a lot of warming (1-1.5 oC) just to “catch up”. Kaufman DS, et al. (2009) Recent warming reverses long-term Arctic cooling. Science 325:1236–1238. Box, J. E.et al (2009) Greenland Ice Sheet Surface Air Temperature Variability: 1840–2007. Journal of Climate, 22, 4029-4049. McConnell et al (2007) 20th-Century Industrial Black Carbon Emissions Altered Arctic Climate Forcing Science 317, 1381 - 1384
    0 0
  12. sorry, I mangled a sentence and didn't spot it before posting. Under (ii) it should say. "The rapid rate of warming during the 20's to 30's almost certainly had a strong contribution from the recovery following the suppression of temperatures associated with the prolonged period of high volcanic activity from the late 19th century through the first decade of the 20th century (e.g. see Figure 11 of Box et al, 2009)."
    0 0
  13. I have a tiny vial of water with me (Still travelling toward home) that was from ice at the bottom of the core. The water is from snow that fell in Greenland 150K years ago!
    Dansat is way cooler than the rest of us put together ... What were you doing there?
    0 0
  14. I'd be grateful if someone could help answer a question put to me by a denier regarding Greenland ice mass. He used an illustration from one of Monckton's lectures showing photographs of radar stations sitting on top of the ice sheet where the ice was purportedly a mile thick. The slide showed photos of the radar stations when they were first built, sitting on top of the ice, and then ten years later (and the same month of the year) buried in deep snow. Monckton -- and my denier friends's -- argument was that it was blindingly obvious proof that the ice sheet was not melting but was in fact accumulating. My counter was that A) soft snow would be removed before a structure was erected, and then re-accumulate. B) Snow packs down, so it's quite likely that the radar station would settle and soft snow would accumulate. And C) why would the ice melt from the top? Melting polar ice melts, and moves, down towards the sea and the radar stations could all now be lower than they once were -- even though snow still falls (because more snow falls as temperatures rise). Of course my response was purely conjecture -- and thus unconvincing -- but I couldn't find anything on-line that specifically addressed this anecdotal 'evidence'. Any thoughts/links/whatever, gratefully received.
    0 0
  15. #14 The key is that the radar station is built in the accumulation zone where the snow pile up every year slowly burying any object place on it. Eventually this object will move into the ablation zone where melting dominates every year. If an object placed in the accumulation zone does not get buried we are in trouble.
    0 0
  16. Tomorrow I leave for the 27th consecutive glacier mass balance field monitoring season. I should note that even on small North Cascade glaciers we hope our stakes in the accumulation zone get buried and do not reappear for many years until they move down glacier. Unfortunately in 2005 and 2009 even the accumulation zone lost all of its recent snowpack.
    0 0
  17. Further to mspelto, key concepts: Accumulation zone, ablation zone. Easy enough, once it's pointed out. The example is helpful in determining the utility of Monckton's presentations.
    0 0
  18. mspelto at 05:26 AM on 1 August, 2010 Thanks for the response. Hope you get time to answer this before you leave! The way you describe it -- and certainly the way it looks on the diagrams -- it sounds like the whole of central Greenland (where ice is a mile thick?) is an accumulation zone. Is this correct? Is, in fact, the whole of Greenland, in effect, one big glacier that radiates out in all directions? Is that a good way to visualise it? If so has anyone mapped the direction of travel of the ice around that continent? Sorry if the questions seem naive to the experts but it's important that we laypeople understand the way the mechanism works.
    0 0
  19. dansat says: "I have a tiny vial of water with me (Still travelling toward home) that was from ice at the bottom of the core. The water is from snow that fell in Greenland 150K years ago!" This is proof that Greenland ice loss isn't being caused by global warming. The real cause is all these scientists who are trying to get rich off of global warming carrying the ice away themselves.
    0 0
  20. Robert Wray just recently did a nice post here on SkS on "how ice sheets lose ice." Worth a look in reference to John Russell's questions.
    0 0
  21. #16: "Unfortunately in 2005 and 2009 even the accumulation zone lost all of its recent snowpack." Forgive the anecdotal evidence, but I was up in the Cascades yesterday. Temps in the 80s, precious little snow visible from the road; none at all in this pic from Stephens Pass.
    0 0
  22. Veering slightly OT, for those unfamiliar w/the U.S. Pacific Northwest muoncounter's photo looks more like mid-summer Siskiyou Mountains in southern Oregon, not North Cascades in mid-summer. Last-minute shot of snow did not last. California's going to be really sad when we have to stop exporting power. Plans until late winter this year were to cut exports by 50%, which would have raised rates up here since the utility would lose that revenue. Push comes to shove, we'll get the juice, California won't. They should consider very carefully whether to vote to reverse already-agreed efficiency improvements in this year's election. Coal companies interfering in the referendum process will be quite happy to sell more coal to make up for a poorly thought-out decision. Things do get complicated when all the cards are thrown in the air.
    0 0
  23. #11 chris at 02:25 AM on 1 August, 2010 Thanks chris for pointing out the "well below" typo. Perhaps I should have said Figure 1 shows that current temperatures are similar to those reached in the 1930s and 1940s. Nevertheless, Chylek et al (2006) state that, "... almost all post-1955 temperature averages at Greenland stations are lower (colder climate) than the pre-1955 temperature average." This is the opposite of global temperature measurements. Only longer-term measurements will determine if Greenland "catches up" the 1-1.5°C suggested by you (after Box et al, 2009). Until then, I reiterate that Chylek et al (2006) state that Greenland is colder now than it was pre-1955.
    0 0
  24. Angusmac, Looking at the data you posted, it is clear that the temperature in Greenland in 2006 is the same as it was in the 30's and 40's. Chris's quote shows 2005 as a record year, and it has been warmer than that in the years since 2005. The current trend now is clearly warmer. Model data give reasons for the high temperatures in the 30's and 40's. I think you are optimistic about the future of Greenland based on the data you posted.
    0 0
  25. #22: "muoncounter's photo looks more like mid-summer Siskiyou Mountains in southern Oregon" No, I'm in Washington state; took that on Friday at the turnout on Stephens Pass. Here's a link to their snow report for last season (68" below average). Flew over the Rainer area on this past Tuesday; not much summer snow up there either. Here's a webcam. Anyone doubting the severity of glacier melt should look at mspelto's website, especially the graph shown below.
    0 0
  26. No, I'm in Washington state; took that on Friday at the turnout on Stephens Pass. Duly noted; North Cascades should -not- look like Siskiyous, I could have been more explicit. Snow-free N. Cascades seem in keeping with predicted latitude migration of dynamic natural features.
    0 0
  27. O/T, but michael sweet's comment is numbered 20,000. Is that really the 20,000th comment ?
    0 0
    Response: Why so surprised? You lot sure love to talk climate :-)
  28. Very good overview. I was wondering about the following. The most credible model forecast seems to be the one due to Stone etc. However, according to Bell (the paper was discussed in an earlier, equally interesting guest post by Robert Way), subglacial water plays an important role "lubricating" the glaciers, increasing the ice flow. I get the impression that such effects are not included in the model studied by Stone et. al. Maybe this is related to their statement that "Current ice-sheet models lack higher-order physics". If Bell is right about the importance of sub-glacial liquid water, this could mean that Greenland would loose even more ice than Stone thinks.
    0 0
  29. Both the mentioned papers talk about "mass balance" but unfortunately apparently don't include any discussion of the input side of the equation. Has there been any measurement of the amount of precipitation? Has it changed? Why?
    0 0
  30. Re: Tenney Naumer:"Newer studies indicate that the runoff is moving closer to half of the mass balance decline." were you thinking of Broeke et al., Science, Vol. 326. no. 5955, pp. 984 - 986, 2009 "Partitioning Recent Greenland Mass Loss" from the abstract: "The total 2000–2008 mass loss of ~1500 gigatons, equivalent to 0.46 millimeters per year of global sea level rise, is equally split between surface processes (runoff and precipitation) and ice dynamics." Certainly makes me look at Figure 4 from Pffefer above in a whole new light. http://www.sciencemag.org/cgi/content/abstract/326/5955/984 sidd
    0 0
  31. @Chris - We refresh “a little bit” of literature - references: A. Regarding MIS 11: Sea level 400 000 years ago (MIS 11): analogue for present and future sealevel?,Bowen, 2010; and: Comment on D. Q. Bowen (2010); by Hearty, 2010. B. Most global causes of melting ice in Greenland: Millennial scale climatic variations and bipolar seesaw pattern, Capron et al., 2010: “NorthGRIP records enable us to depict the sub-millennial scale variability during the GIS of MIS 5 and thus, to highlight new type of features (GIS 21, 23) observed also during MIS 3 (GIS 11, 12, 13–14, 16). These new patterns appear as (i) precursor-type events prior to the onset of GIS (ii) rebound events at the end of GIS and (iii) centennial-scale cooling during the long and warm GIS 24. In addition to the internal forcing of ice-sheets on the climatic evolution during these events, we have proposed the external influence of the summertime insolation at 65 N. [!] Disentangling the main processes leading to these sub-millennial scale structures (ice-sheet, insolation, sea-ice, and hydrological cycle forcing) will require dedicated modelling studies. Through our results, we assume that orbital-scale variations play a role in rapid climate change but, also, the millennial-scale variability may hold clues to the long term climatic changes (i.e. Weirauch et al., 2008; Wolff et al., 2009b). Comparing Antarctic and Greenland behaviour over the succession of AIM/DO back to MIS 5 provides a more complete description of the bipolar seesaw pattern. As expect from the bipolar seesaw concept, a linear relationship between AIM amplitude and preceding GS duration only holds for shorter events, while for extraordinary long GS a new heat flux equilibrium between the Northern and Southern Hemisphere is obtained (EPICA c.m., 2006, Stocker and Johnsen, 2003) and the Southern Ocean warming ceases. The conceptual model of Stocker and Johnsen (2003) for a thermal bipolar seesaw is able to represent most of the variability of the north-south relationship depicted in Greenland and Antarctic isotopic records, even at sub-millennial timescale. However, it is not able to depict the delay of Antarctic warming after the beginning of the GS during the periods associated with large ice sheets (i.e. during MIS 2 and the end of MIS 4). It shows that Greenland ice core temperature proxy records cannot be taken as direct proxy for AMOC changes as suggested from the conceptual model. To go beyond our description and the conceptual model of Stocker and Johnsen (2003), the new types of DO events identified during MIS 5 should be studied with more complex models (e.g. Ganopolski and Rahmstorf, 2001; Knutti et al., 2004). This would allow quantification of the influence of insolation, ice-sheet volume, sea-ice and hydrological cycle on sub-millennial-scale variability (precursor and rebound events). This should provide also a better understanding of the response of Antarctica to these types of events.” Influence of solar variability, CO2 and orbital forcing between 1000 and 1850 AD in the IPSLCM4 model, Servonnat et al. 2010: “With a signal-noise ratio (SNR) estimate we found that the temperature signal of the forced simulation is significantly different from internal variability over area wider than ~5.106 km2, i.e. approximately the extent of Europe. ORBITAL FORCING PLAYS A SIGNIFICANT ROLE in latitudes higher than 65° N [! - Greenland !] in summer and supports the conclusions of a recent study on an Arctic temperature reconstruction over past two millennia. [...] The forced variability represents at least half of the temperature signal on only ~30% of the surface of the globe. This study suggests that regional reconstructions of the temperature between 1000 and 1850 AD are likely to show weak signatures of solar, CO2 and orbital forcings compared to INTERNAL VARIABILITY.” Extreme deepening of the Atlantic overturning circulation during deglaciation., Barker et al., 2010: “We conclude that the rise in atmospheric CO2 concentrations and resultant warming associated with an especially weak overturning circulation are sufficient to trigger a switch to a vigorous circulation, but a full transition to interglacial conditions requires additional forcing at AN ORBITAL SCALE.” “The fact that [AMOC] can react in such a way is really exciting.” A team of researchers, led by Dr Stephen Barker from Cardiff University, has investigated how changes in a key component of global ocean circulation are related to significant changes in temperature, which have taken place IN THE RELATIVELY RECENT GEOLOGICAL PAST.” “But the researchers believe the link between the AMOC and DEGLACIATIONS OVER THE LAST HALF A MILLION years is too strong to be a coincidence. It looks like deglaciation may only happen when the AMOC shifts from weak to strong.” “And these changes can have extreme effects. During the Bølling-Allerød (B–A) warm phase, 14,600 years ago, temperatures rose by 9 degrees Celsius over the course OF JUST A FEW DECADES.” Natural forcing of climate during the last millennium: fingerprint of solar variability, Swingedouw et al., 2010: “Then, we focus on the regional climatic fingerprint of solar forcing in winter and find a significant relationship between the low frequency TSI forcing and the NAO with a time lag of more than 40 years for the response of the NAO. Such a lag is larger than the around 20-year lag suggested in other studies. We argue that this lag is due, in the model, to a northward shift of the tropical atmospheric convection in the Pacific Ocean, which is maximum more than four decades after the solar forcing increase. This shift then forces a positive NAO through an atmospheric wave connection related to the jet-stream wave guide. The shift of the tropical convection is due to the persistence of anomalous warm SST forcing the anomalous precipitation, associated with the advection of warm SST by the NORTH PACIFIC subtropical gyre in a few decades. Finally, we analyse the response of the Atlantic meridional overturning circulation to solar forcing and find that the former is weakened when the latter increases. Changes in wind stress, notably due to the NAO, modify the barotropic streamfunction in the Atlantic 50 YEARS AFTER SOLAR VARIATIONS. This implies a wind-driven modification of the oceanic circulation in the Atlantic sector in response to changes in solar forcing, in addition to the variations of the thermohaline circulation.” C. Conclusion: 1st Peak of the last high solar activity (the highest of approximately 8 thousand. years!) was in the 60s of the twentieth century - and thus 40-50 years emu ... ... after about 40 - 50 years will therefore save the Eskimo from “the shackle” of ice? 2nd So the present "unprecedented" melting of Greenland's ice is (mostly) the effect of natural changes throughout the NH, and not without significance here is my favorite LTC-LNO: The complex dynamics of the seasonal component of Earth’s surface temperature, Vecchio et al., 2010: “The dynamics of the climate system has been investigated by analyzing the complex seasonal oscillation of monthly averaged temperatures recorded at 1167 stations covering the whole USA. We found the presence of an orbit-climate relationship on time scales remarkably shorter than the Milankovitch period related to the nutational forcing. The relationship manifests itself through occasional destabilization of the phase of the seasonal component due to the local changing of balance between direct insolation and the net energy received by the Earth. Quite surprisingly, we found that the local intermittent dynamics is modulated by a periodic component of about 18.6 yr [... !!!] due to the nutation of Earth, which represents the main modulation of the Earth’s precession.”
    0 0
    Moderator Response: Please reduce the lengths of quotes in your comments. Instead, summarize and provide links or citations to the sources.
  32. philc writes: Both the mentioned papers talk about "mass balance" but unfortunately apparently don't include any discussion of the input side of the equation. Has there been any measurement of the amount of precipitation? Has it changed? Why? Yes, there has. Check out van den Broeke 2009, which was prominently featured in John's earlier post Why is Greenland's ice loss accelerating? In particular, the following figure from that paper shows a time series of the various components of surface mass balance. Note that prior to the 1980s, SMB was mostly influenced by changes in precipitation rather than in surface melting/runoff. In recent years, precipitation has been higher than in the past, but runoff has been even greater, leading to a negative surface mass balance. (This is independent of the other mass balance term, discharge of ice via calving). Surface Mass Balance (blue) and its components precipitation (red), runoff (orange) and sublimation (green).
    0 0
  33. Just in: This morning I interviewed James White, the director of the Institute of Arctic and Alpine Research here in Boulder, for KGNU radio’s “How on Earth” science show. White is a paleoclimatologist — he studies ancient climates to understand better how Earth’s climate system works. He has just journeyed back from the Greenland ice sheet, where he has been part of an international science team working on the North Greenland Eemian Ice Drilling project, or NEEM... In White’s view, it’s already too late to turn back the clock on climate change to save low-lying coastal cities like Miami. The ice cores that he and his colleagues drill from Greenland and Antarctica tell us that the last time greenhouse gas concentrations in the atmosphere were as high as they are today, the world was even warmer than it is now, Greenland was largely deglaciated, and sea level was 10 to 15 feet higher. Oops, we broke the planet. What did our parents say? "It's all a lot of fun until somebody gets their eye put out?" Full story w/link to interview audio: Message from the Eemian.
    0 0
  34. “Please reduce the lengths of quotes in your comments.” You are right. Sorry. However works - paper Capron et al., it is important (according to not only me - it gives strong arguments of both skeptics and supporters of AGW theory) that it was more difficult for me to shorten the quotation, not to miss the most important observations of this great - numerous team of researchers. I’m wonder discussion in the scientific world that this work may cause.
    0 0
  35. Arkadiusz Semczyszak at 23:03 PM on 3 August, 2010 (With apologies to moderators for the length of comment). The papers you cite are all interesting and recent papers but none of them appear to be directly concerned with the recent warming of Greenland, though some are very relevant to the paleo record. They do not support your conclusion. The related papers of Swingedouw 2010 and Servonnat 2010 use a state of the art model to examine the effects of TSI, CO2, and orbital changes on temperature and NAO over the past thousand years, and they support the prevailing view from IPCC AR4. They also explicitly provide support for the conclusion from Kaufmann 2009 (which Chris mentions) that the Northern Hemisphere has experienced a slow cooling over the past millennium (- until the recent century when this trend has abruptly reversed). From Swingedouw 2010 when discussing pre-industrial asymmetric NH/SH response to warming: “This type of response is comparable to a certain extent with the temperature response to greenhouse gases increase during the last 50 years (Trenberth et al. 2007), with a large warming at the northern high latitudes, while the Southern Ocean experiences a very small warming and even a slight increase in sea ice cover” From Servonnat 2010: “Using a linear statistical decomposition we evaluated that TSI and CO2 have similar contributions to secular temperature variability between 1425 and 1850 AD” & “The amplitude of the temperature secular variability is in agreement with both temperature reconstructions and IPCC AR4 simulations taking into account the impact of the volcanoes”. I have to emphasise that the authors are looking at preindustrial forcings and confirm and add detail to current prevailing thoughts on pre-industrial forcings and effects Capron 2010 is concerned with rapid temperature changes in the last glacial period using the Greenland and Antarctic ice core records, and in brief examines precursor events (a topic I believe I possibly pointed you to recently) which include CO2 changes, possible AMOC changes (as in Barker 2010) as well as probable insolation effects on ice sheet volume. The present scenario is one where CO2 is rising more quickly than in any of the pre industrial ice core records, AMOC is relatively stable, and orbitally driven NH insolation is gently decreasing. These papers do not provide evidence for rapid Greenland melting at this stage in the current interglacial through any mechanism except rising CO2. The estimated long term orbital changes in NH insolation dwarf the insolation changes over recent centuries. The Vecchio 2010 paper is about an influence of nutation (an 18.6 year wiggle in the tilt angle as the earth precesses) on the phase of the global seasonal variations in temperature, the reported results suggesting a shift of 1.74 days towards earlier seasons over 110 years. What relevance this has I am not sure.
    0 0
  36. Nice interview with Dr. James Zwally on MSNBC's Countdown tonight. "Ice chunks 4x the size of Manhattan don't break off every day", etc. Video of the interview may be available here later tonight or tomorrow.
    0 0
  37. #11 chris at 02:25 AM on 1 August, 2010 it’s worth being a little more considered about the data on the progression of Greenland temperatures during the 20th century You are right. Fortunately we have some data on past temperatures over Greenland. If you visit the NOAA Paleoclimatology page, you may find supporting data there for Kobashi et al. 2010 GISP2 1000-Year Ar-N2 Isotope Temperature Reconstruction. There is also a nice paper on more than two centuries of instrumental temperature record in Greenland, directly from CRU. JOURNAL OF GEOPHYSICAL RESEARCH, VOL. 111, D11105 doi:10.1029/2005JD006810, 2006 Extending Greenland temperature records into the late eighteenth century B. M. Vinther, K. K. Andersen, P. D. Jones, K. R. Briffa, and J. Cappelen Received 24 October 2005; revised 11 January 2006; accepted 28 February 2006; published 6 June 2006. They also have supporting data published, as all such studies should. The ice core reconstruction is from Greenland summit and covers the years from 1000 AD. to 1993 AD., while Vinther at al. have a full reconstruction of monthly temperatures along the south and west coast of Greenland (Ilulissat, Nuuk & Qaqortoq) from 1852 to 2005 based on instrumental record. I have converted both datasets to temperature anomalies and have calculated a 11 year running mean for the latter one to match the lower resolution of ice core data. Here it is: The match between the ice core proxy and the instrumental record is reasonably good for the overlapping period. Part of the difference may be due to the distance between the two sites (up to 1000 km). We can see temperatures over Greenland in the 1930s were a bit higher than today. They were even higher around 1140. If we have a broader look, to the entire holocene, we can see temperatures were up to 3°C warmer than today several times, with somewhat less snow accumulation. Still, the Greenland ice sheet has not collapsed and the sea never flooded London.
    0 0
  38. Berényi - Thank you, very interesting data on historic Greenland air temperatures and snowfalls. Have you found related data showing historic water temperatures over that period? Given that the majority of Greenland's ice loss (balancing or recently overbalancing snow/ice gain) comes from peripheral melt/ run-off, calving events (both water temp driven), and glacier speed (moderated by back-pressure from the periphery as well as local melt greasing the glacial underbelly), the water temperature should be the determining factor in loss rate. Sublimation is trivial by comparison. Given the currently increasing ocean heat content, run-off rates are a serious issue.
    0 0
  39. Sorry, the link to the graph in my previous post is to Why is Greenland's ice loss accelerating?. My apologies for not noting it there.
    0 0
  40. #38 KR at 01:10 AM on 20 August, 2010 the water temperature should be the determining factor in loss rate Yes, of course. But as you can see, SST (Sea Surface Temperature) has been decreasing steadily in the Arctic ocean during the entire holocene and now it is 2-3°C colder than it was eight thousand years ago. Still, the Greenland ice sheet has not collapsed, not even during the four millennia between 6000 B.C. and 2000 B.C. It will not collapse now either. A decade is still weather, not climate, SST is well below its Holocene Optimum value and melt season temperatures in the high arctic are decreasing sharply. One of the sites is at the eastern edge of the Greenland sea, south of Svalbard, the other one is in the Norwegian sea. GEOPHYSICAL RESEARCH LETTERS, VOL. 30, NO. 6, 1280, doi:10.1029/2002GL016570, 2003 Arctic/North Atlantic Oscillation signature in Holocene sea surface temperature trends as obtained from alkenone data N. Rimbu, G. Lohmann, J.-H. Kim, H. W. Arz, and R. Schneider Department of Geosciences, Bremen University, Bremen, Germany Received 6 November 2002; revised 23 December 2002; accepted 10 January 2003; published 19 March 2003.
    0 0
  41. Berényi - Ah, found the reference. The last time temperatures were 1-2°C higher was in the Holocene (see "Why Greenland's ice loss matters"), 125K years ago (your chart only goes to 20K years ago), and according to Kopp 2009 sea levels were over 6 meters higher than at present. At 400ppm CO2 (we're at what, 392?) Stone 2010 estimates 41% ice loss from Greenland over the next 400 years or so, with ~1.4 to 2.8 meters sea level rise from Greenland alone, with uncertainties due to boundary conditions on the ice sheet break-down. Greenland and Antarctica apparently are somewhat responsive to temperatures.
    0 0
  42. Correction - my apologies, Berényi, 125K years ago wasn't the Holocene, it's roughly the transition between the Middle Ionian and the Upper Tarantian stages of the Pleistocene. Oops...
    0 0
  43. #41 KR at 05:07 AM on 20 August, 2010 The last time temperatures were 1-2°C higher was [...] 125K years ago (your chart only goes to 20K years ago), and according to Kopp 2009 sea levels were over 6 meters higher than at present. Read Rimbu 2003 please. Or just have a look at the graph above. At 74.99N, 13.97E (pretty close to Greenland) SST was more than 2°C above its present value for several thousand years with no adverse effect on the Greenland ice sheet. And no, "my chart" (actually Rimbu's) does not go back to 20K years ago, just 10,000. There was a warm period after the end of the last glaciation (it is called Holocene Climatic Optimum), there is no question about that. It was much warmer than today, especially in the Arctic. If you don't believe me, read Bednarski 1990. A 7500 (7535±220) years old skeleton of a bowhead whale was found in Nansen Sound between Axel Heiberg and Ellesmere islands. How likely such a beast can get there in the foreseeable future? ARCTIC VOL. 43, NO. 1 (MARCH 1990) P. 50-54 An Early Holocene Bowhead Whale (Buluena mysticetus) in Nansen Sound, Canadian Arctic Archipelago JAN BEDNARSKI (Received 20 March 1989; accepted in revised form 23 June 1989)
    0 0
  44. Berényi - I believe that 1-2°C global (as per 125,000 years ago) translates to 2-4°C or more in the Arctic. I would love a fact check from someone who has actual expertise in this (Pete Hogarth, for example), though. I don't know what the normal range of bowhead whales is - but there are multiple whale species present in the Arctic and Antarctic year round. Sorry - I don't consider this evidence in either direction. Current Greenland mass behavior seems to indicate a transition point, however, as is evident in the graph I posted in #38.
    0 0
  45. I checked a bit more, Berényi - and found that "Of all large whales, the bowhead whale is the most adapted to life in icy cold water". Posting a bowhead whale skull as evidence for a warmer Arctic is both meaningless and misleading - they like it cold, and live in the Arctic year round.
    0 0
  46. #45 KR at 13:32 PM on 20 August, 2010 a bowhead whale skull as evidence for a warmer Arctic is both meaningless and misleading - they like it cold, and live in the Arctic year round According to NOAA Fisheries Office of Protected Resources this is where they live: The site of the skeleton is 500 km away from the present day margin of their habitat, only accessible through heavily ice laden narrow channels. They do like it cold, but being mammals they also need breathing. They can break through 20 cm thick ice with their heads, but not thicker.
    0 0
  47. BP, doesn't 7500 years ago put it smack dab in the middle of the Holocene Optimum, when Arctic temperatures were much warmer than now?. Doesn't your whale skull match what is known?.
    0 0
  48. #47 Dappledwater at 23:47 PM on 20 August, 2010 Doesn't your whale skull match what is known? It does. However, people here are denying both air and sea surface temperatures were considerably warmer in the Arctic during the Holocene Climatic Optimum than they are today just to make the present feeble warming unprecedented and alarming. Their concern being if Greenland has failed to melt down to the bedrock during those millennia, it would hardly do it now. Truth may be tardy, but in the long run it prevails over communication.
    0 0
  49. Yes, temps were warm in the Holocene. But much warmer in the edges of the Tarantian, with temperatures then close to where ours are heading now. I read the paper you referenced, Berényi, and that bowhead skeleton does appear to be out of the current range - my apologies. I would guess that it's presence there would be due to both the Holocene warming (long term, allowing Arctic melt to come to equilibrium) and much larger range of the bowhead prior to large scale human whale hunting; that's apparently shrunk their range considerably. Looking at some Holocene temperature data: it appears (black trace is the average reconstruction) that the Holocene peak roughly matched 2004 temperatures. Other references I've run across indicate that if temps rise another 1°C, it'll be the hottest it's been in the last 1.35 million years.
    0 0
  50. #49 KR at 02:15 AM on 21 August, 2010 the Holocene peak roughly matched 2004 temperatures Much could be said about the holocene temperature reconstruction promoted on Wikipedia, but anyway, we are not talking about global temperatures here, but polar ones. 7500 years ago annual average insolation was 5 W/m2 higher inside 80N than it is today (at the eqator it was 1 W/m2 lower). You can check it here. Even if we accept estimated pre-industrial CO2 levels and the 3.7 W/m2 forcing for doubling of CO2, it is only 1.7 W/m2 up to now, far less than early holocene arctic forcing. Relax, the Greenland ice sheet is not in immediate danger.
    0 0

1  2  Next

You need to be logged in to post a comment. Login via the left margin or if you're new, register here.


The Consensus Project Website

THE ESCALATOR

(free to republish)


© Copyright 2024 John Cook
Home | Translations | About Us | Privacy | Contact Us