Climate Science Glossary

Term Lookup

Enter a term in the search box to find its definition.

Settings

Use the controls in the far right panel to increase or decrease the number of terms automatically displayed (or to completely turn that feature off).

Term Lookup

Settings


All IPCC definitions taken from Climate Change 2007: The Physical Science Basis. Working Group I Contribution to the Fourth Assessment Report of the Intergovernmental Panel on Climate Change, Annex I, Glossary, pp. 941-954. Cambridge University Press.

Home Arguments Software Resources Comments The Consensus Project Translations About Support

Bluesky Facebook LinkedIn Mastodon MeWe

Twitter YouTube RSS Posts RSS Comments Email Subscribe


Climate's changed before
It's the sun
It's not bad
There is no consensus
It's cooling
Models are unreliable
Temp record is unreliable
Animals and plants can adapt
It hasn't warmed since 1998
Antarctica is gaining ice
View All Arguments...


Username
Password
New? Register here
Forgot your password?

Latest Posts

Archives

Should The Earth Be Cooling?

Posted on 17 September 2010 by Michael Searcy


Current Climate Running Against the Grain

When considering whether or not the human influence on the Earth’s climate is discernible, one of the immediate questions that comes to mind is, “What would the climate be doing in the absence of human interference?”

Easterbrook Quote

Indeed all climate models strive to identify the impact of natural mechanisms as compared to anthropogenic, or man-made, ones. The general conclusion has been that models of strictly natural influences do a pretty good job at reproducing real world, pre-industrial climate conditions but that the influence of mankind must be incorporated in order to reproduce the climate conditions of the industrial era. But at what point does the human component overwhelm its natural counterparts, when Mother Nature says we should be going in one direction while reality is going the opposite?

While it’s impossible to know exactly what the climate conditions would be in the absence of mankind, we should be able to get a pretty good sense of at least whether or not the global climate would be warming or cooling. The simplest method to make this determination is by examining the trends of a few major natural mechanisms that influence the climate, namely solar irradiance, the El Niño Southern Oscillation (ENSO), and the Pacific Decadal Oscillation (PDO).

Solar Irradiance, ENSO, and PDO

Shifts in solar irradiance generally follow the Sun’s roughly 11-year sunspot cycle, but the magnitude of these cyclic changes is quite small. However, longer term, multi-decadal trends of rising or declining solar activity can have notable climatic impacts here on Earth. Longer periods of high solar activity or dormancy are often associated with the Medieval Warm Period (MWP) and the Little Ice Age (LIA) respectively.Wolter Quote
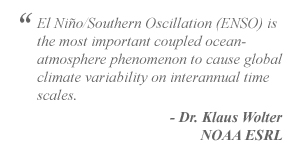
ENSO and PDO both refer to oceanic and atmospheric patterns in the Pacific Ocean, but they differ from one another. ENSO focuses on conditions near the equator. These conditions alternate between warmer (El Niño) and colder (La Niña) phases, with individual phases lasting from a few months to a year. Each phase can have a noticeable impact on global temperatures, with El Niño conditions driving temperatures higher and La Niña having the opposite effect. A particularly strong El Niño in 1998 is credited with pushing global temperatures to some of their highest levels on record.

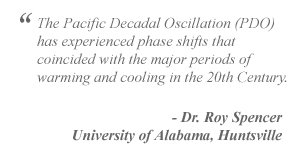
Similar to its equatorial cousin, the northern Pacific PDO alternates between warm and cold phases with a warm PDO encouraging warmer temperatures and a cold PDO the opposite. While its phases are less predictable than ENSO they can last much longer, up to multiple decades.

Examining the Last 30 Years
Spencer QuoteSo what has been going on with these three significant and natural climate drivers, particularly when compared to the warming influence of human industrial carbon dioxide (CO2)? NOAA's National Climatic Data Center (NCDC) states, "The average value of a meteorological element over 30 years is defined as a climatological normal," so let’s examine the current 30-year history of each of these natural mechanisms and their respective influences on the global climate.

Figure 1 below depicts the 30-year trend from 1979 to the present of solar irradiance, ENSO, PDO, and atmospheric carbon dioxide. Each trend has been normalized in order to facilitate comparisons on equivalent scales. Each graph also includes the general warming or cooling influence of the trended data on Earth’s climate. Lastly, the normalized trend of global temperatures over the last 30 years is included.

Climate Forcings (Last 30 Years)

Figure 1: 30-Year Climate Forcings - Solar Irradiance, ENSO, PDO, Atmospheric CO2

Based on the combination of decreased solar activity, a steady ENSO and a declining PDO over the last 30 years, we would expect to be experiencing a cooling climate. However, despite this opposition from multiple natural factors, global temperatures have risen throughout this time period as the concentration of atmospheric CO2 has escalated. Nature indicates the planet should be cooling. The reality has been just the opposite.

What Do Climate Models Say?

But do the climate models concur with this divergence?

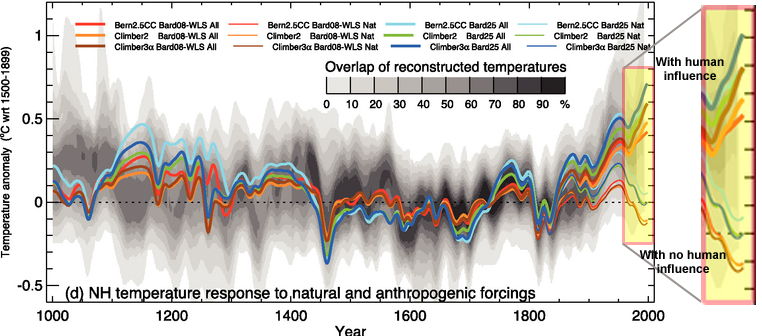
Figure 2 is an excerpt from the IPCC’s 4th Assessment in 2007. Depicted is the output of three climate models. Each model was run reflecting just natural climate influences and also with the inclusion of anthropogenic influences. The different model runs are depicted in color with those reflecting natural+human factors shown in bold. Actual conditions based on direct measurements and proxies are reflected in the background gray range.

Climate Models

Figure 2: Climate models, Figure 6.14, IPCC AR4 WG1 (Click for larger)

Examining the model outputs, as the world enters the industrial age, the models begin to show a split between the results from purely natural influences and those from natural+human factors. However, while the overall trends begin to diverge, the shorter term fluctuations remain in agreement. As the natural result warms, the natural+human result warms. As the natural result cools, the natural+human result cools.

Then things change.

Over the section of the model runs depicting the last 30 years or so, the two model run types diverge completely. While the natural results show a distinct cooling trend in line with the actual observations of solar irradiance, ENSO, and PDO, the results from the natural+human runs show a marked warming trend. This divergence is highlighted in the figure.

Looking at both the actual observations of historically significant climate forcings including solar irradiance, ENSO and PDO and the results from model runs depicting solely natural climate influences, we would expect our planet to be notably cooling.

However, examining climate models including both natural and human influences, we would expect a continued warming trend over the last 30 years.

Which is exactly what's been happening.

0 0

Printable Version  |  Link to this page

Comments

Prev  1  2  

Comments 51 to 70 out of 70:

  1. Ken Lambert... I don't think anyone has a problem accepting that warming has flattened in the past decade. That's pretty obvious. What people are objecting to is this statement: "[This is] pretty good proof that the theory of CO2GHG forcing as the main driver of global warming is in serious trouble." As everyone is pointing out, the climate is highly variable. It has ups and downs and has throughout the warming of the past 40 years. I presented a chart where there are a number of short term (cherry picked) trends that show cooling. Why is this warming this decade any different than previous cooling or flattening of the past? Answer: It's not. As well, if you can plot the 2 standard deviation of the trend I think you'll find that the flattening is still well within the expected range. When we start plotting consecutive years falling outside that range then you have full permission from me to claim that CO2GHG driven GW is in trouble. And I'll back you up.
    0 0
  2. @KL: "The most recent 8-15 years is not cherry picking. 1-2 years is cherrypicking." So, is 8 as good as 15, then? How about 16, is that better or worse? How about 6? Hey, look at the last three years: Global Warming has restarted with a vengeance! I'm curious to hear your threshold for how many years is enough, and why it is so.
    0 0
  3. Indeed, if the "skeptics" are to be believed the planet should be undergoing marked and prolonged cooling. Yet, we have this happening: And the above graphic (courtesy RC) does not include data for most of 2010. Now applying certain people's misguided logic here, the theory of AGW would have been erroneously "falsified" many, many times over the duration of the instrumented SAT record. Yet, despite all those dips and bumps, the long-term warming trend is clear. Drawing attention to every "dip" by skeptics is quite simply unscientific and misleading. I really do not understand what 'skeptics' here are trying to argue. To my knowledge, no (reputable) climate scientist has said that we should expect a monotonic increase in global surface temperatures with increased GHG forcing.
    0 0
  4. kdkd @50, "I must prepare a post on linear trends and statistical power in order to deal with this oft-repeated rubbish of yours and others' once and for all. Please do kdkd.
    0 0
  5. The arctic is screaming global warming. Skepticism is looking more and more like proselytization. How about this site expanding its scope to include the debate about what we should do about it? Pros and cons of geoengineering Carbon capture State of the art modeling Regional forecasting etc.
    0 0
  6. Daniel Bailey (The Yooper?) and kdkd I will repeat this for you both gentlemen: Ned's Chart at post #18 here: http://www.skepticalscience.com/The-Pacific-Decadal-Oscillation-and-global-warming.html shows smoothed GISS land + SST and RSS temperatures which sure looks like flattening over the last 8-10 years. That's if a clear reduction in the slope of a curve is flattening - which for most people it is. Some facts please kdkd - your derogatory comment can be vented elsewhere - we are trying to keep ad hominem attack out of this blog. Just to repeat some 'multiple independent lines of evidence' - temperature flattening, SLR flattening by nearly all analyses, and OHC flattening or nil by the imperfect but best we have Argo; and Dr Trenberth can only find 60% of the 'missing heat' which has probably gone missing forever. (It has not only left the building - but probably left the planet!) And all this at a time when the last decade of theoretical CO2GHG forcing 'has been the highest decade' since the last ice age. Sound familiar?
    0 0
  7. Here's the thing. Over the last 30 years, the planet's been experiencing according to skeptical theory...
    • Cooling from a decline in solar irradiance
    • Cooling from a decline in the PDO
    • Cooling from planetary orbital shifts
    • Cooling from increased cloud cover dervived from cosmic rays
    • Cooling from increased cloud cover from a negative water vapor feedback
    • Cooling from increased cloud cover derived from "biosol" nuclei
    • Cooling from increased cloud cover derived from iodocompounds
    • Cooling from increased cloud cover derived from biologic dimethyl sulfide
    • Cooling from cloud compositional changes derived from the iris effect
    • Cooling from anthropogenic aerosols and soot
    • Cooling from atmospheric aerosols from COS and other natural emissions
    • Cooling from changes to the Meridional Overturning Circulation (MOC)
    And yet temperatures have continued to rise over that time period, and the most that can be claimed is not cooling but a "flattening over the last 8-10 years". If this is the result of so many natural mechanisms opposing the anthropogenic warming signal, what happens when their natural cycles reinforce that signal?
    0 0
  8. Re: Ken Lambert (56)
    "Ned's Chart at post #18 here: http://www.skepticalscience.com/The-Pacific-Decadal-Oscillation-and-global-warming.html shows smoothed GISS land + SST and RSS temperatures which sure looks like flattening over the last 8-10 years. That's if a clear reduction in the slope of a curve is flattening - which for most people it is."
    Are we even looking at the same graphic? The overall trend (1900-2010, 1980-2010) is UP. Perhaps your razor-focus on statistically insignificant timescales blinds you to that fact. Most people would care to be ACCURATE in their statements and assertions and would note that fact. You are WRONG.
    "SLR flattening by nearly all analyses"
    Um, no. Wrong again. Here's what it actually looks like over that interval (from Tamino, reproduced from the University of Colorado site). You mistake natural variations of noisy signals over statistically insignificant timeframes for "flattening" (is that the new meme de jour?). You are CHERRY PICKING. You also make unfounded assertions with NO analysis of your own to support your baseless claims.
    "And all this at a time when the last decade of theoretical CO2GHG forcing 'has been the highest decade' since the last ice age. Sound familiar?"
    There's nothing "theoretical" about the greenhouse gas effects of CO2. It's all reproducible in the lab, and has been since the 1800's. Did you not take science classes in school? You are correct in that CO2 concentrations have been at their highest levels in millennia; the "aughts" are hotter than the 90's, which were hotter than the 80's which were hotter than the 70's, and this year is the hottest year ever (thus far). Note the trend here. You waste all of our time, and that of the readers here as well. Gimme something of substance, some meat and potatoes, to work with here. I'd LOVE for you to be right, but so far you're just statistically significantly "flattening" your credibility. Sound familiar? The Yooper
    0 0
  9. KL #56 "Some facts please kdkd" Facts: If I (or any other capable person) were to do the statistics examining the linear trends, the cherry picking you've done by eyeball would be a trend that I'm 99.99% sure would be shown to be statistically indistinguishable from zero. Which in turn doesn't mean no warming or cooling, it means that there's insufficient data to determine the trend on that time scale. I stand by my previous comment that your position is illogical, incorrect, and theoretically unsupportable repetitious rubbish. Is that a sufficiently factual for you?
    0 0
  10. Daniel @58. Thanks for calling Ken on his misinformation @56. Just one nit pick, one has to be careful about distinguishing between a "hypothesis" and a "theory". Many people, it seems, try to discredit or belittle the physics behind AGW by referring to it as a "only a theory", when, if that is their intent, they should be referring to the "hypothesis of AGW". The increased radiative forcing from elevated GHGs is a well established and tested theory. In the science world, a "theory" carries a lot more weight than a "hypothesis". "According to the United States National Academy of Sciences, Some scientific explanations are so well established that no new evidence is likely to alter them. The explanation becomes a scientific theory. In everyday language a theory means a hunch or speculation. Not so in science. In science, the word theory refers to a comprehensive explanation of an important feature of nature supported by facts gathered over time." [source, Wikipedia]
    0 0
  11. Re: Albatross (60) Thanks for the reminder. :) I was a little fired up & used KL's quote back in the context he meant it (the non-science, or layman's everyday usage). I should probably have corrected that misunderstanding as well. But it's difficult to catch everything in a comment like that because of the sheer amount of misunderstandings going on. I will try to exercise more judiciousness in my words. BTW, the NAS definition you cite is very similar to the NAS statement in May on global warming:
    " A strong, credible body of scientific evidence shows that climate change is occurring, is caused largely by human activities, and poses significant risks for a broad range of human and natural systems…. Some scientific conclusions or theories have been so thoroughly examined and tested, and supported by so many independent observations and results, that their likelihood of subsequently being found to be wrong is vanishingly small. Such conclusions and theories are then regarded as settled facts. This is the case for the conclusions that the Earth system is warming and that much of this warming is very likely due to human activities."
    Source here. Thanks again, The Yooper
    0 0
  12. No worry's Daniel-- I also make the same mistake from time-to-time. My comment/clarification was mostly directed at "skeptics".
    0 0
  13. Yooper #58, #61 The critical measurement is the TOA imbalance which nets all the heating and cooling forcings. Ref Fig 2.4 of AR4 which gives a total net anthropogenic forcing of +1.6W/sq.m. To this number is then added the climate responses which mainly consist of radiative cooling (from a raised Earth temperature of 0.75 degC as per S-B) of about -2.8W/sq.m and WV and Ice Albedo Feedback of about +2.1 W/sq.m. (Ref Dr Trenberth Fig 4 'Tracking the Earth's global energy) The sum is then +1.6 -2.8 +2.1 = +0.9W/sq.m All the heating and cooling forcings are acting in concert. S-B is emitting IR, Aerosols and clouds are reflecting incoming Solar heat, while CO2GHG are supposedly trapping Solar heat at lower levels (the mechanism is more correctly slowing down the transfer rather than 'trapping' heat) which tends to raise the equilibrium temperature as the analogy of a better insulator increases the T1-T2 temperature difference for a given heat flux transferred. What is certain is that CO2GHG forcing (currently claimed at about 1.6W/sq.m) is logarithmic with CO2 concentration, and S-B radiative cooling is exponential (proportional to T^4). Where these forcings and the others cross is where the forcing imbalance is zeroed and the new equilibrium temperature approached. The CO2GHG theory hangs on the interaction of WV and CO2 in the atmosphere and what will be the surface temperature rise for a unit rise in the IR emitting temperature of the Earth as seen from space. For the first law to be satisfied, most of heat flux 'imbalance' of 0.9W/sq.m should show up in the oceans due to the tiny relative storage capacity of the land and atmosphere (about 5%). OHC is proving most elusive to measure but Argo is the best we have at the present and the latest Willis analysis is not finding the 'missing heat' below 1000m. Here is the story on sea level rise: Thanks to HumanityRules nice summary: quote; "I've found 4 papers looking at closing the sea-level budget around 2003-2007. The latest is from this year. Basin patterns of global sea level changes for 2004–2007 You-Soon Chang, Anthony J. Rosati, Gabriel A. Vecchi Journal of Marine Systems 80 (2010) 115–124 Chang, like the others, calculate the steric and mass components using ARGO and GRACE and compare it to the total change calculated from altimetry. They handily summarize the 4 published attempts to close the sea-level budget in a table. Chang et al (2010) STERIC −0.11±0.22 MASS 0.70±0.34 TOT 2.67±0.52 Willis et al. (2008) STERIC −0.5±0.5 MASS 0.8±0.8 TOT 3.6±0.8 Leuliette and Miller (2009) STERIC 0.8±0.8 MASS 0.8±0.5 TOT 2.4±1.1(2.7±1.5) Cazenave et al. (2009) STERIC 0.37±0.1 MASS 1.9±0.1 TOT 2.5±0.4 Chang and Willis fail to close the budget and interestingly fail with pretty much the same numbers. Leuliette and Cazenave manage to close the budget but by very different means. Leuliette through an equal contribution from steric and mass. Cazenave primarily (80%) through mass." Note Leuliette is the only one of the 4 analyses to get equal mass and steric. Error bars are very wide on all analyses. More mass means less OHC content increase and most coming from ice melt which sinks very ittle heat compared with the claimed imbalance. Yooper - when you have supped on this - please refrain from belching on about my 'misunderstandings', Happy to debate you on any or all of the above.
    0 0
  14. @KL: So, in other words, your entire argument rests on admittedly incomplete/imperfect ARGO readings? Given the overwhelming evidence in support of AGW theory, it seems to me this would indicate deficiencies in measure OHC, not problems with AGW theory. Unless, you know, you already have decided in your mind AGW theory is wrong, then I guess confirmation bias will cloud your judgement regarding this issue...
    0 0
  15. Re: Ken Lambert (63) Dude, I have to offer up a concession. You usually DO have sources to back up your contentions, unlike others who post here with only opinion for a wingman. I was reminded of this a bit ago when Baz said you were wrong. As his accuracy meter has flat-lined, it was actually a testimony on your behalf! Anyway, where were we? Oh, yeah. In your post #56 above, you focus on a statistically insignificant period of time (i.e., too short of a time period to base any scientific supposition on) and also refer to: "SLR flattening by nearly all analyses". Those were the two points I objected to. If you want to make the statement that it is your "opinion" that there is a "flattening" of temperatures in such a short period of time as you reference, then fine. Baz will make room for you. SLR is what it is. If you wish to contend with The University of Colorado, then go for it. There are various areas in which you have demonstrated a clear understanding of the subject at hand in your various comments I've read on Skeptical Science. I wish there was a way to get around the disconnect on these two items I objected to in my original comment. You are clearly an intelligent person, so I hope that at some point we can work to figure it out. Oh, one other thing. Upon re-reading my comment at 58 above, it comes across a little more strident than I meant it to. I apologize for that tone. I was a little worked-up still from sorting things out with a, um, different commenter; I will try to be more even in tone in the future. The Yooper
    0 0
  16. #65 Handsome concession Yooper. Look forward to engaging on the details.
    0 0
  17. Whenever a solar cycle stretches beyond 13 years as did SC23, then doesn't a grand minimum soon follows with global cooling. The role of water vapor, our major GHG, will then take on a devilish role. The air becomes colder, dryer, and the warming effect of our greatest GHG diminishes. Shouldn't this greatly overshadow the miniscule effects of CO2? Also, isn't airborne soot implicated in the melting of the glaciers, even when the air above them has not risen above freezing?
    0 0
  18. #67: Apparently not. Look here and use that thread for further discussion if warranted.
    0 0
  19. According to Professors Reddiman and Kaplan, our climate should be cooling, if not for mankind's CO2 emissions. They say that our CO2 has been modifying the climate since the beginning of agriculture, well before industrialization http://www.nature.com/news/2011/110325/full/news.2011.184.html They also believe that Columbus was responsible for the cooling during the Little Ice Age http://www.sciencenews.org/view/generic/id/335168/title/Columbus_blamed_for_Little_Ice_Age Chris Shaker
    0 0
  20. cjshaker there are still a lot of things to work out before the so called early human impact can be reliably assessed. It is still at the stage of hypothesis, will see. As for Columbus, let me be pedantic. In the link you provide they say "may have helped augment Europe’s so-called Little Ice Age" and not "was responsible for the cooling" as you say.
    0 0
  21. cjshaker wrote: "According to Professors Reddiman and Kaplan, our climate should be cooling, if not for mankind's CO2 emissions. They say that our CO2 has been modifying the climate since the beginning of agriculture, well before industrialization" Why should that be a surprise? Land use change emissions have indeed being going on for a very long time, and fossil fuel emissions only overtook land use change emissions in the early 60s IIRC. So if the comparatively small CO2 emissions from land use change before the industrial revolution had an non-insignificant effect on the climate, we should expect the vastly larger anthropogenic emissions (both fossil fuel and land use change) since the industrial revolution to have a much more substantial effect. If you are interested you can get data on fossil fuel and land use emissions from the Carbon Dioxide Information and Analysis Center I note that you have been very active today posting a large number of papers for discussion on a wide range of topics. Some constructive criticism: this gives the impression that you are not really interested in the answers, because very few people would be able to hold a worthwhile discussion on so many topics simultaneously. I would advise in future that you stick to a small number of topics at any one time so that you can have an in-depth discussion that science demands.
    0 0
  22. 69, cjshaker, Thank you for the reference to an enlightening article. I did not realize that there was a measurable drop in CO2 just prior to the Little Ice Age. It would seem that it's possible that CO2 and anthropogenic actions could have been a factor in that event, which would make it all the more probable that a heavily industrialized and technological society like ours could further impact the climate. I like the tongue-in-cheek way that you attribute the entire episode to one man (Columbus), when of course the article clearly shows that the real problem was the entire European arrival, but more importantly the introduction of diseases which are well known to have ravaged the Native American populations, killing as much as 90% of them and completely exterminating them on some Caribbean islands. That this lead to a huge amount of cleared land being abandoned and reclaimed by forest does not seem incredible in the least. The unexpected result that the new forest growth required carbon to grow those trees, and so over time extracted large amounts of carbon from the atmosphere (the exact same amount of carbon that is recorded as vanishing from the atmosphere at that time) is an unexpected but perfectly logical consequence. All in all, a very, very interesting article, which highlights the usefulness of a number of scientific techniques and leads to what at first appear to be unbelievable, fantastical results (as you were able to demonstrate with your cleverly cute misleading synopsis), and yet these turn out to be perfectly logical conclusions. Of course, one never knows if the result will hold up. I have to do the skeptical thing myself, now, and find and read the paper in detail. News articles about science are rarely trustworthy. But thanks for the find! Definitely worth a look.
    0 0
  23. I'd like to point out that the original paper cjshaker references is available for free here: The Columbian Encounter and the Little Ice Age: Abrupt Land Use Change, Fire, and Greenhouse Forcing It looks like a very interesting read. I will get to it later today (after I play a little bit of soccer with some other 50 year old men).
    0 0
  24. Sphaerica It is indeed an interesting paper, tying as it does directly into the work of William Ruddiman (author of Plows, Plagues, and Petroleum: How Humans Took Control of Climate). Note that Ruddiman has a very interesting guest post on Real Climate: http://www.realclimate.org/index.php/archives/2011/04/an-emerging-view-on-early-land-use/
    0 0
  25. Additionally, I find Fig 4 from the study fascinating: Figure 4. Comparison of atmospheric [CO2], [CH4], δ13CCO2, δ13CCH4, and population data for the Americas: (A) Concentration of atmospheric CO2 (Etheridge et al. 1996; Meure et al. 2006; blue and black symbols) and CH4 (Ferretti et al. 2005; red symbols from Law Dome; (B) δ13C of atmospheric CO2 (Francey et al. 1999; blue symbols) and CH4 (Ferretti et al. 2005; red symbols) from Law Dome; (C) population estimates for the Americas (Rosenblat 1954; Dobyns 1966; Denevan 1992a; Henige 1998) and Neotropics (this study). Gray vertical bars as in Figure 3.
    0 0
  26. Dikran#71: "Land use change emissions have indeed being going on for a very long time, and fossil fuel emissions only overtook land use change emissions in the early 60s" Here's a CDIAC graph of emissions from land use change: full scale Here is the current CDIAC graphic of emissions from fossil fuel consumption: full scale The land use graph is scaled in Terra grams C (million metric tons) with values in the hundreds; prior to the post WW2 period, the total is less than 1 Gton. The fossil fuel graph is scaled in million metric tons, with values in the thousands. So it looks like the period of rapid growth immediately following 1945 was the crossover; from then on fossil fuel carbon dominates. Wouldn't it be the case, based on population density alone, that land use changes prior to 1800 are insignificant on these scales?
    0 0

Prev  1  2  

You need to be logged in to post a comment. Login via the left margin or if you're new, register here.


The Consensus Project Website

THE ESCALATOR

(free to republish)


© Copyright 2024 John Cook
Home | Translations | About Us | Privacy | Contact Us