Climate Science Glossary

Term Lookup

Enter a term in the search box to find its definition.

Settings

Use the controls in the far right panel to increase or decrease the number of terms automatically displayed (or to completely turn that feature off).

Term Lookup

Settings


All IPCC definitions taken from Climate Change 2007: The Physical Science Basis. Working Group I Contribution to the Fourth Assessment Report of the Intergovernmental Panel on Climate Change, Annex I, Glossary, pp. 941-954. Cambridge University Press.

Home Arguments Software Resources Comments The Consensus Project Translations About Support

Bluesky Facebook LinkedIn Mastodon MeWe

Twitter YouTube RSS Posts RSS Comments Email Subscribe


Climate's changed before
It's the sun
It's not bad
There is no consensus
It's cooling
Models are unreliable
Temp record is unreliable
Animals and plants can adapt
It hasn't warmed since 1998
Antarctica is gaining ice
View All Arguments...


Username
Password
New? Register here
Forgot your password?

Latest Posts

Archives

Billions of Blow Dryers: Some Missing Heat Returns to Haunt Us

Posted on 23 September 2010 by Doug Bostrom

"The heat will come back to haunt us sooner or later..." --Kevin Trenberth, referring to our inability over the past 5 years to locate half a watt per square meter per year of energy accumulated on Earth as a result of anthropogenic warming of the planet, approximately half of the expected warming signal.

It's a sad fact that while Earth's oceans are expected to absorb the vast majority of anthropogenically induced imbalance of the global energy budget, our physical observations of the caloric state of the deep ocean are conspicuously sparse when compared to daily remote sensing revisitations enjoyed by research subjects amenable to orbital remote sensing platforms. In some ways our instrumentation of such far-flung places as Mars and Venus is better than what we deploy here on Earth in the abyssal depths. While we have solid theoretical grounding for predicting storage of excess heat in the ocean, without the means to directly measure and accurately quantify this effect we're left missing not only heat but also a useful means of testing and validating predictions of climate sensitivity to forcing.  

As our technical capacities have risen to the challenge of dealing with an environment arguably more hostile to instrumentation than near-Earth orbital space, oceanographers at last are enjoying some of the same physical and scientific advantages as those long enjoyed by scientists working with space-based remote sensing platforms. The semi-autonomous Argo array represents a huge leap forward in our understanding of the characteristics of the upper ocean. With respect to anthropogenic climate change, of late we've been treated to increasingly dense and accurate measurements of upper ocean heat content, greatly refining our ability gather this important data.

Unfortunately the present Argo implementation is depth-limited and we thus still have no automated systems in place for data retrieval from the slightly over one half of the ocean inaccessible to robotic probes. For this majority of ocean volume we still must rely on hardy investigators "going down to the sea in ships, that do business in great waters." We landlubbers wondering about "missing heat" and suspecting it may be found in the ocean can only be patient as we wait for salt-crusted mariner scientists to return to shore and write up their results.

The main reason for lamentation of  "Trenberth's Travesty" is the declining upward pace over the past 5 years of the portion of ocean heat content (OHC) we're readily able to measure. We know that sea level rise (SLR) is principally caused by both thermal expansion of the oceans and water mass contributed by continued melting of terrestrial ice. Terrestrial ice alone cannot account for the continuing sea level rise we see in the face of the slackened pace of upper ocean warming.  Juxtaposing continuing sea level rise  against OHC we don't observe, we're left with a substantial technical mystery, an inability to "close the budget" of SLR as well as an inability to specifically account for the final destination of heat we know is accumulating on the planet ( Willis 2008 ). Failing the unlikely emergence of some new mechanism able to cause SLR, we may say with reasonable confidence that continued SLR can at least partially be attributed to accumulating OHC we can't directly "see," but merely saying so is no substitute for direct measurements.

Now we may say some significant progress has been made in tracking down "missing heat." In Journal of Climate Sarah Purkey of the University of Washington and NOAA's Gregory Johnson  report on an ambitious project to quantify heat being stored in the abyssal ocean ( Warming of Global Abyssal and Deep Southern Ocean Waters Between the 1990s and 2000s: Contributions to Global Heat and Sea Level Rise Budgets ). By revisiting abyssal stations included in the World Ocean Circulation Experiment (WOCE) conducted in the 1990s, about 20% of Trenberth's famous "missing heat" appears to have been tracked down, found to be slowly traveling north from the Southern Ocean.

While integrating these new measurements into the global heat budget does not entirely close our observational gap, by producing their results Purkey and Johnson have crisply demonstrated how vast amounts of heat may have been left out of the budget for the simple reason of previously being invisible. Their work is also a compelling case for improving our capability to routinely measure with less extraordinary effort the majority of ocean volume we're presently forced to ignore when accounting for accumulation of heat. Finally, it seems reasonable to conclude that these measurements bolster our confidence in SLR as a proxy for increasing OHC. 

Purkey and Johnson's abstract: 

We quantify abyssal global and deep Southern Ocean temperature trends between the 1990s and 2000s to assess the role of recent warming of these regions in global heat and sea level budgets. We compute warming rates with uncertainties along 28 full-depth, high-quality, hydrographic sections that have been occupied two or more times between 1980 and 2010. We divide the global ocean into 32 basins defined by the topography and climatological ocean bottom temperatures and estimate temperature trends in the 24 sampled basins. The three southernmost basins show a strong statistically significant abyssal warming trend, with that warming signal weakening to the north in the central Pacific, western Atlantic, and eastern Indian Oceans. Eastern Atlantic and western Indian Ocean basins show statistically insignificant abyssal cooling trends. Excepting the Arctic Ocean and Nordic seas, the rate of abyssal (below 4000 m) global ocean heat content change in the 1990s and 2000s is equivalent to a heat flux of 0.027 (±0.009) W m–2 applied over the entire surface of the Earth. Deep (1000–4000 m) warming south of the Sub-Antarctic Front of the Antarctic Circumpolar Current adds 0.068 (±0.062) W m–2. The abyssal warming produces a 0.053 (±0.017) mm yr–1 increase in global average sea level and the deep warming south of the Sub-Antarctic Front adds another 0.093 (±0.081) mm yr–1. Thus warming in these regions, ventilated primarily by Antarctic Bottom Water, accounts for a statistically significant fraction of the present global energy and sea level budgets. 

In an interview, coauthor Gregory Johnson expressed the amount of heat identified in this study in amusingly prosaic terms: the newly located reservoir of energy is akin to what would be liberated by loading every man, woman and child on Earth with five 1,400 watt hairdryers each and running those appliances continuously for the 20 year interval between measurements. 

Purkey and Johnson's results, mapped:
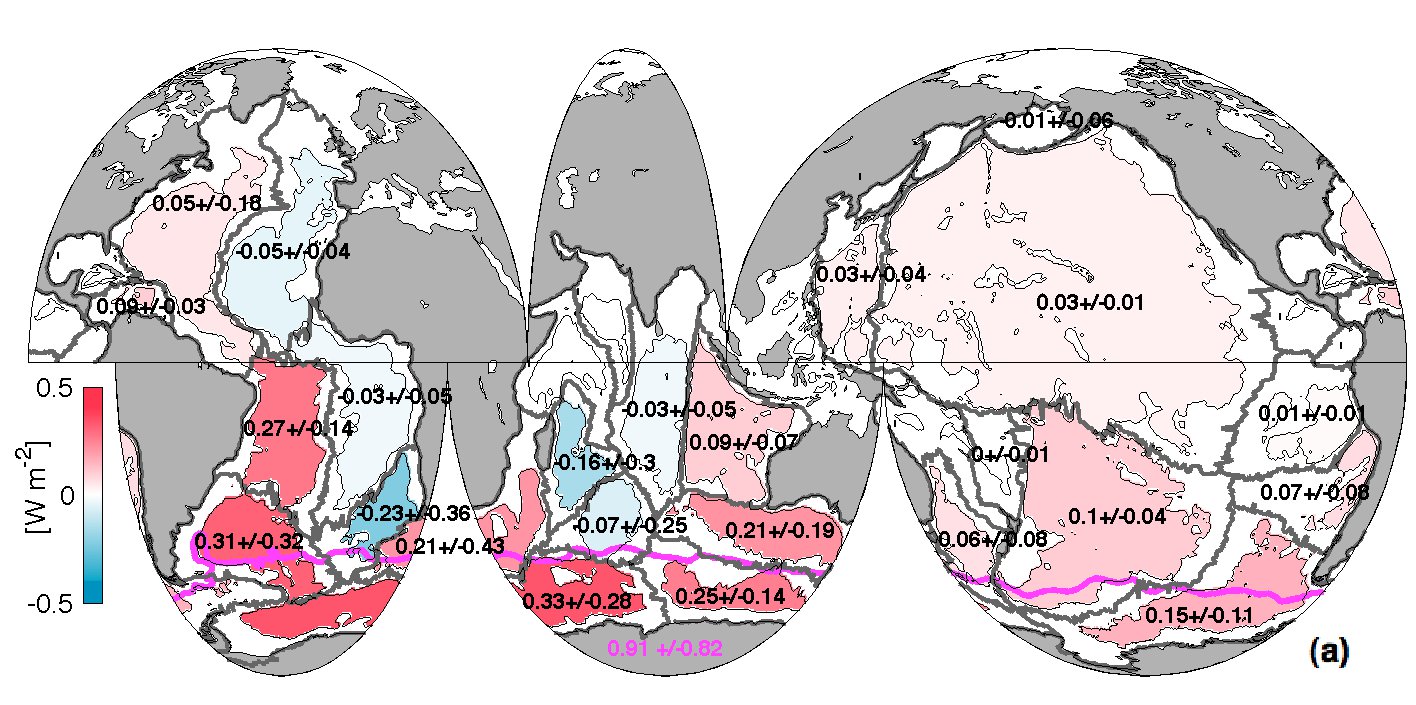


"Mean local heat fluxes through 4000 m implied by abyssal warming below 4000 m from the 1990s to the 2000s within each of the 24 sampled basins (black numbers and colorbar) with 95% confidence intervals and the local contribution to the heat flux through 1000 m south of the SAF (magenta line) implied by deep Southern Ocean warming from 1000–4000 m is also given (magenta number) with its 95% confidence interval." (Purkey and Johnson, 2010)

How can Antarctic Bottom Water (AABW) influence abyssal temperatures so far north of the Antarctic? To understand this, it's helpful to grasp the huge role in deep ocean circulation played by the Southern Ocean and the Antarctic. AABW is derived from enormous quantities of chilled, relatively saline and thus dense water sinking at the extreme south of the globe, in Antarctic waters. This mass of dense water is relatively free to travel north, first plunging off the Antarctic continental shelf and then hugging the bottom as it displaces warmer water. AABW is steered by bottom topography and Coriolis forces and only ceases moving and thus influencing abyssal temperatures when it has reached equilibrium density with surrounding water. Even after traveling some 60 degrees north of its source, density differences are still large enough to drive substantial amounts of AABW past the circulation barrier imposed by the equator, thus permitting diminished but still measurable circulation effects of AABW to be measured in the abyssal depths of the Northern Hemisphere. 

A pair of illustrations of Antarctic and Southern Ocean circulation may be helpful in understanding the process of AABW transport.  
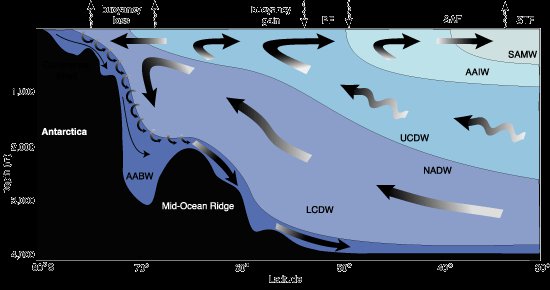
 
"South (left) to north (right) section through the overturning circulation in the

Southern Ocean. South-flowing products of deep convection in the North Atlantic are converted into upper-layer mode and intermediate waters and deeper bottom waters and returned northward. Marked are the positions of the main fronts (PF – Polar Front; SAF – Sub-Antarctic Front; and STF – Subtropical Front), and water masses (AABW – Antarctic Bottom Water; LCDW and UCDW, Lower and Upper Circumpolar Deep Waters; NADW – North Atlantic Deep Water; AAIW – Antarctic Intermediate Water and SAMW – Sub- Antarctic Mode Water)" (Figure 1.9, SCAR "Antarctic Climate Change and the Environment" )

Role of Southern Ocean in global circulation ( Lumpkin and Speer, 2007 ) 

One might wonder, if AABW circulation is driven partly by the relative density of water chilled in the Antarctic, won't distribution of this water change as deep waters warm in response to heating by AABW circulation, thus robbing AABW of some of its physical transport impetus? This does seem to be the case; for instance, the interface between AABW and North Atlantic Deep Water (NADW) has deepened over the past few decades and as well there are indications of diminished abyssal circulation in regions of the North Pacific influenced by AABW, as would be expected in a scenario where density gradients are diminishing ( Johnson 2008Kouketsu 2008 ). Numerous other variations in circulation behaviors controlled by thermally induced density variances may be found in Purkey and Johnson. Taken together, these indicators are broadly consistent with changes in the thermal regime of the deep ocean connected with  AABW and its source. 

It's important to note that to a greater or lesser extent the Southern Annular Mode (SAM) plays some role in controlling changes observed in Purkey and Johnson, not to the exclusion of secular changes outside of the SAM but significant nonetheless. Complications abound in forming an exact assessment of the proportionality of natural versus forced variations; the SAM itself appears to be in a process of adjusting to two anthropogenic influences, ozone depletion and greenhouse gas proliferation. 

Beyond shedding enlightenment on a specific research topic, Purkey and Johnson's work suggests some improvements we could make in the level of urgency we attach to exploring our planet. NOAA is working on upgrading our ability to sample deep and abyssal ocean water via robotic instrumentation.  As is so often the case, the pace of instrumentation improvements is set in part by budgetary limitations involving amounts of money small in the grand scheme of things. Purkey and Johnson show beyond doubt how vital better observational ability is when it comes understanding our role in shaping the climate; we're effectively blind to enormous changes in the physics of our planet because we won't make paltry expenditures for better "optics," a lamentable and unnecessary condition.  Our instrumentational inability to closely track climate change is a general problem; it's truly odd that such a important research topic so crucial to public policy should find itself lacking the equipment to quantify changes nearly everybody agrees present us with multi-trillion dollar risk and decision choices and outcomes. 


Officially Off-topic: A Salute to Oceanographers

In terms of effective inaccessibility and remoteness, Earth's oceanic abyssal depths have aptly been compared unfavorably to extraterrestrial space.

For researchers investigating Earth's climate, orbital space is in some ways a far friendlier environment than the oceans. Instruments aboard satellites allow researchers to collect their data while lounging in shirtsleeve comfort, facing nothing more dangerous in the daily routine than slipping and falling while taking a morning shower.

Oceanographers often must wrest their primary information from the ocean, at personal risk, conducting their observations from the pitching, rolling decks of ships with course and speed set for instrument deployment as opposed to comfort and safety, directly exposed to the uncaring vagaries of fickle weather and heavy machinery. Errors in procedure, equipment or vessel failures or even inclement weather may exact the ultimate penalty on oceanographers seeing to the meticulous collection of data, career hazards not faced by many other scientists investigating climate-relate phenomena. 

Quite apart from the kinetic drama of working from small ships on the surface of such storied locales as the notoriously stormy Southern Ocean, the sea is also extraordinarily costly in terms of the personal investment of time required to wrest every few hundred kilobytes of data from the cold dark of the bottom. After dealing with a commute of thousands of miles to their laboratory enviroment, scientists are rewarded with brief spurts of information separated by long intervals of plodding, akin to "crossing the ocean at a jogging pace" as NOAA's Gregory Johnson expresses the matter. 

For all these reasons, it's worth pausing a moment in appreciation of the fanatical dedication and perseverance needed to collect data of the kind used to produce Purkey and Johnson's paper. The graphs and maps casually flung out in little essays such as the one above inadequately express countless thousands of cold and dripping hours spent in hostile conditions far from hearth and home. True enough it's an all-volunteer army, but recognition of this effort is still due.

0 0

Printable Version  |  Link to this page

Comments

Prev  1  2  

Comments 51 to 67 out of 67:

  1. #50 NETDR at 04:10 AM on 29 September, 2010 we have had 1/3 of a doubling of CO2 No. Pre-industrial CO2 level is assumed to be 280 ppmv, while currently we are around 390 ppmv. log2(390/280) ~ 0.478 That is 47.8%, bit more than 1/3.
    0 0
  2. Look at the data Doug. Suggestions of OHC increasing from 2005 through 2010 is largely manufactured because supporting data simply doesn't exist.
    0 0
  3. Care to retract your remarks about "extrapolations," TTTM? If you can't tell the difference between "extrapolation" and what P&J did in their paper, it's not only more obviously pointless arguing with you, you also rob yourself of credibility. Meanwhile, you've also created for yourself the problem of your assertion, "The research doesn't ACTUALLY show warming at all. It assumes it." You've not shown that. Typing the words is a miniscule fraction of the effort you need to invest in lending those words worth. NETDR, interesting points, but you're slipping behind. If you can show how P&J are incorrect, you may then assert that they've not located where approximately 20% of the famous "missing heat" may reside. The point of the article is that progress appears to have been made in solving this mystery. Repeating old information does not address new results. Really, people need to roll up their sleeves and do some work here, talk less.
    0 0
  4. Despite all of this “the debate is over” and we should throw ten’s of trillions of dollars at the nearest politician to make it go away. Oh, brother, didn't notice that until just now. So we're not talking science, we're talking politics? Searching for "politics" the only semi-appropriate thread I find here is Why I care about climate change. If you're here because you care about politics and climate change, try that.
    0 0
  5. @NETDR: wow, so many erroneous statements in just a few sentences, I'm impressed! "So far the warming has been far below the 6 ° C rate the scientists want to use for a doubling of CO2." Climate sensitivity is estimated to be around 3C, not 6C. "Since we have had 1/3 of a doubling of CO2 we should have had more than 2 ° C warming we haven’t had this." As BP noted, it's much closer to 1/2 than 1/3. "0.7 ° C is the accepted value and less than ½ of that is from CO2 in the best case." Actually, it's closer to 0.9, and there's not indication that less than 50% of that is due to CO2. In fact, other factors (PDO, TSI, etc.) indicate we should be cooling, and yet temps have kept increasing. In any case, there is a lag before the full effect of CO2 warming is felt, so there's no reason the current warming is lower than what scientists estimate. "To get around this scientists have speculated that the ”missing heat” is stored in the oceans !" It probably is. "The problem is that since 2005 both atmosphere and the ocean have been cooling." Actually that is incorrect. Temperature trends since 2005 are positive. Furthermore, the point of this article is precisely that we're finding areas where some heat has gone that weren't being measured, and thus it's likely there are more of these. You should learn a bit more on the subject before posting such comments.
    0 0
  6. @doug_bostrom: damn, I just noticed that bit at the end myself. If I'd read it first, I wouldn't have taken the time to respond to him. Hey, NETDR, this isn't a political discussion site. Cut that crap.
    0 0
  7. @TTTM: as I stated before, absence of evidence isn't evidence of absence.
    0 0
  8. Doug I'll ask you a simple question to prove my point. What does the data (see figure 2) for the following stations show for the period 2005 through 2010? A01, A02, A10, A12, A20, A22, I03, I04, I09S, P02, P10, P17, SR03 and SR4
    0 0
  9. With regards to my previous post (#55), I'd like to specify I know 5 years is way too short to establish a trend. However, since it seems good enough for NETDR, then the least I could do was show him that trends are in fact positive (even if by a very small amount).
    0 0
  10. Make your point, TTTM, I don't want to engage with you in Socratic debate and anyway your argument is not with me. You've got a lot of details to wade through starting in section 2 before you're going to make a dent in P&J beyond pointing at a single figure and hoping we'll think there's some problem with the analysis; I'm sure figure 2 is very alluring but then it's a picture, after all, doesn't pretend to describe the experiment. These "debates" are so rarely a fair fight. You're not arguing with me; I'm simply reporting findings of a team with decades of specialized training, total dedication and commitment to their subject, armed with relatively ample resources, who in turn lean on the expertise of other people with centuries of similar experience between them. You're one guy with Google who apparently can't distinguish between extrapolation and interpolation, but maybe that's deceptive and you'll make a real case against the authors. Meanwhile my only possibly useful role here in this comments thread is to point out when you're just saying "I doubt it."
    0 0
  11. I've read it Doug. I've made my point, its just that you either dont understand it or dont want to accept it. They simply dont have any data for most of their "stations" in the period of interest. They can say nothing about what the OHC is actually doing during that time as a result. Its not interpolation Doug. There is simply NO DATA to have interpolated with. Its an extrapolation from the last data point some time before 2005 through to the end of 2010.
    0 0
  12. @TTTM: What is your obsession with the 2005-2010 period, anyway? From the paper's abstract: "We compute warming rates with uncertainties along 28 full-depth, high-quality, hydrographic sections that have been occupied two or more times between 1980 and 2010." Who said that readings had to be limited to 2005-2010 to be useful. Oh, right: you. You seem to believe that readings have to be in that period in order to be significant, but that misses the whole point. This paper is not specifically about that period, but rather seeks to show how heat fluxes through the abyssal oceans. I'm sorry, but you simply have failed to challenge the science contained in the P&J paper. They have enough data to show a significant heat movement below 4,000m, thus giving a clue as to the true nature of the apparent hole in the global heat bugdet.
    0 0
  13. TTTM, I think you've been led into making incautious statements about P&J's paper by my remarks on attention being focused on missing OHC by flattening temperature increases over the past 5 years. In point of fact, the bit of OHC considered sufficiently solid to include in IPCC syntheses has been deficient for some time prior to 2005. See ARG WG1 5.2.2 Ocean Heat Content There's nothing in P&J's paper not included in the abstract for you to argue with. Read carefully, starting with the first sentence: We quantify abyssal global and deep Southern Ocean temperature trends between the 1990s and 2000s to assess the role of recent warming of these regions in global heat and sea level budgets.We compute warming rates with uncertainties along 28 full-depth, high-quality, hydrographic sections that have been occupied two or more times between 1980 and 2010. Nothing about 2005-2010, yes? Meanwhile, I think your attention was seized by my sentence: The main reason for lamentation of "Trenberth's Travesty" is the declining upward pace over the past 5 years of the portion of ocean heat content (OHC) we're readily able to measure. I could have said that better. I could have said, "The main reason for recent increased attention..." or words to that effect. Unfortunately I've thereby tempted you into making some rather incautious and wrong flings against P&J. Sorry about that, I'll try to do better next time. What P&J have done is to have formed this conclusion, which will stand until somebody (not you I suspect) shows otherwise: Excepting the Arctic Ocean and Nordic seas, the rate of abyssal (below 4000 m) global ocean heat content change in the 1990s and 2000s is equivalent to a heat flux of 0.027 (±0.009) W m–2 applied over the entire surface of the Earth. Deep (1000–4000 m) warming south of the Sub-Antarctic Front of the Antarctic Circumpolar Current adds 0.068 (±0.062) W m–2. The abyssal warming produces a 0.053 (±0.017) mm yr–1 increase in global average sea level and the deep warming south of the Sub-Antarctic Front adds another 0.093 (±0.081) mm yr–1. Thus warming in these regions, ventilated primarily by Antarctic Bottom Water, accounts for a statistically significant fraction of the present global energy and sea level budgets. They appear to have identified a substantial portion of "missing heat," which has been understood by most people for a long time to be missing not in the sense of absent from existence but missed from our ability to confidently measure. I've got maybe a touch of overenthusiasm for locating this heat. I suspect it'll mostly be found in dribs and drabs, in the manner of P&J, with ultimately some under or overshoot that's going to be increasingly difficult to resolve from sensitivity estimate errors, ultimate measurement limitations, etc. The capacity of the ocean is such that the remaining gap may be breathtaking in absolute terms but small in proportion to the total load we're taking on.
    0 0
  14. Alternatively the heat simply isn't there and the theory is deficient and isn't taking into account negative feedback sufficiently.
    0 0
  15. @TTTM: wishing it won't make it so. Some of heat *is* there, there's no reason to believe there isn't more in other abyssal depths and such. What we know is that we don't have an accurate picture of the entire oceans as far as temperature goes - yet contrarians and deniers have no problems affirming there's missing heat, which in their politically-motivated minds means AGW is no longer happening. As we've shown, the P&J paper remains unscathed by your criticism. Now would be a good time to admit you were wrong and move on.
    0 0
  16. We have a better picture now of the oceans than we've ever had. You dont seem to have a problem believing the warming "observed" when we haphazardly sampled small areas of the ocean via XBTs. Now that we're sampling far better with the 3000 strong purpose built Argo array, woah! The warming just isn't there. That represents a significant problem to AGW theory when that theory suggests heat must be accumulating in the oceans.
    0 0
  17. That's the whole point (which you keep missing): ARGO doesn't go deep enough to provide a complete picture of ocean depths. Hence the P&J research. You're still trying to weasel out of admitting you were wrong about this. Typical.
    0 0
  18. TTTM - your statement "Alternatively the heat simply isn't there and the theory is deficient and isn't taking into account negative feedback sufficiently" is simply, as pointed out, wishful thinking. Purkey et al 2010 makes some clear measurements of the deep ocean, far below the ARGO array, and finds a fair bit of heat down there. We have a really good idea of how much heat the oceans should be accumulating given current conditions; the ARGO arrays weren't showing it over the last few years, so this new evidence indicates where some of it may have gone. Perhaps deep water circulation has increased recently, pushing some of the heat accumulation to the depths? This is something well worth studying. Now, if you have actual complaints about the Purkey methodology, please feel free to voice them! If you instead make unsupported claims contradicted by the evidence, well, then you're not discussing science, but rather your personal opinion. One that's not realistic in terms of the actual world.
    0 0
  19. I have already made my specific complaints re the paper. But it relates more to the conclusions others have drawn from it particularly regarding the implications of the recent (2005-2010) inability to balance the OHC budget.
    0 0
  20. No TTTM, you've been vague and nonspecific in your complaints about P&J. The more you've talked, the farther into the counterfactual you've veered. Counter: We have a better picture now of the oceans than we've ever had. You dont seem to have a problem believing the warming "observed" when we haphazardly sampled small areas of the ocean via XBTs. Now that we're sampling far better with the 3000 strong purpose built Argo array, woah! The warming just isn't there. Factual: Trenberth 2010
    0 0
  21. But I see you how your complaints apply. The OHC problem is that energy inbalance as measured by Argo array. The S&J shows evidence of heat going into deep ocean over its period of measurement that would not have been counted EVEN if Argo had been in place since 1980. It provides evidence of where some of the missing heat might be. The poor coverage over 2005-2010 doesnt tell you much - for all we know even more heat might have gone down rather than less.
    0 0
  22. Nice graph Doug. What exactly does that blue line represent?
    0 0
  23. "The poor coverage over 2005-2010 doesnt tell you much - for all we know even more heat might have gone down rather than less." Anything's possible. If you closely look at figure 3, however, the P18 data which appears to be the only data that even vaguely covers the period in question shows the same thing as the rest of the upper ocean. That is that between two points during the period 2005-2010 there is very little warming.
    0 0
  24. What exactly does that blue line represent? You say you can out-think myriads of oceanographers, TTTM, I'm sure you'll have no problem figuring it out. Visit the reference if you can't deduce it by eyeball. Ciao for the time being. We're wasting our time.
    0 0
  25. Updated OHC posted at NODC: http://www.nodc.noaa.gov/OC5/3M_HEAT_CONTENT/ A blink comparator of the old vs new heat content values: http://i54.tinypic.com/24178ur.jpg from Bob Tisdale's blog: http://bobtisdale.blogspot.com/
    0 0
  26. There is a document explaining the changes shown in Charlie A's #75 at the NODC URL he provides. The top level summary from that document is; "1. Changes due to data additions and data quality control, both at NODC and by originators. Substantial quality control has been carried out by the Argo community on the profiling floats, mainly to correct pressure offsets. A substantial amount of data for recent years has been added to the analysis. 2. Changes due to switch of our base climatology. The website and 2009 paper used an interim (L09) climatology (between WOA05 and WOA09) incorporating XBT corrections and a mean of five decadal climatologies to remove temporal bias. These changes were formally completed with additional data and quality control in WOA09. 3. Changes due to revised XBT bias calculations. With additional XBT and CTD data, the bias calculations were improved. This is an ongoing process, but as we receive less new data from earlier time periods, this recalculation will mostly affect more recent years." These show how many calculations and assumptions go into the OHC estimates and thus further highlight why it is so ridiculous to point to a five year 'trend' in these values as evidence of anything. We can tell that the long term trend is increasing, but making claims based on fine detail is just irresponsible. Note that the new updates don't include any attempt to factor in the deep ocean warming identified by Purkey & Johnson in the paper discussed above. So the NEW results are still not 'perfect'... as also evidenced by the comments about the need for further corrections in the explanation of the changes.
    0 0
  27. I know it is officially off-topic, but things seem quieter here now. Just wanted to offer a very heartfelt thank you, Doug, for your salute to oceanographers and others who have to undergo tedious time-consuming and sometimes dangerous lengths just to grab a smidgen of data that amounts to a few brief paragraphs in a journal article. Thank you for recognizing what they, and others, have to undergo to collect that data. We lost four people in a helicopter crash a few years ago, and this past summer two others, whom I didn't know, crashed while working in the far north around Hudson Bay. Sometimes I think we scientists need to award medals, akin to the military medals, to our colleagues in any discipline who have died while doing their jobs.
    0 0
  28. It was funny coming across my comment. What a difference a couple years makes. I found every word interesting, or should I say compelling, this time around. We live and learn. ~ ~ ~ Incidentally, here's an interesting recent talk about the history of ocean temperature observations: 135 Years of Global Ocean Warming - UCTV's Perspectives on Ocean Science "Join Dean Roemmich, Scripps physical oceanographer and study co-author, as he describes how warm our oceans are getting, where all that heat is going, and how this knowledge will help scientists better understand the earth's climate."
    0 0

Prev  1  2  

You need to be logged in to post a comment. Login via the left margin or if you're new, register here.


The Consensus Project Website

THE ESCALATOR

(free to republish)


© Copyright 2024 John Cook
Home | Translations | About Us | Privacy | Contact Us