Climate Science Glossary

Term Lookup

Enter a term in the search box to find its definition.

Settings

Use the controls in the far right panel to increase or decrease the number of terms automatically displayed (or to completely turn that feature off).

Term Lookup

Settings


All IPCC definitions taken from Climate Change 2007: The Physical Science Basis. Working Group I Contribution to the Fourth Assessment Report of the Intergovernmental Panel on Climate Change, Annex I, Glossary, pp. 941-954. Cambridge University Press.

Home Arguments Software Resources Comments The Consensus Project Translations About Support

Bluesky Facebook LinkedIn Mastodon MeWe

Twitter YouTube RSS Posts RSS Comments Email Subscribe


Climate's changed before
It's the sun
It's not bad
There is no consensus
It's cooling
Models are unreliable
Temp record is unreliable
Animals and plants can adapt
It hasn't warmed since 1998
Antarctica is gaining ice
View All Arguments...


Username
Password
New? Register here
Forgot your password?

Latest Posts

Archives

Arctic sea ice melt - natural or man-made?

Posted on 9 June 2008 by John Cook

Arctic sea ice has declined steadily since the 1970s. However, the 2007 summer saw a dramatic drop in sea ice extent, smashing the previous record minimum set in 2005 by 20%. This has been widely cited as proof of global warming. However, a popular mantra by climatologists is not to read too much into short term fluctuations - climate change is more concerned with long term trends. So how much of Arctic melt is due to natural variability and how much was a result of global warming?

The long term trend in Arctic sea ice

Global warming affects Arctic sea ice in various ways. Warming air temperatures have been observed over the past 3 decades by drifting buoys and radiometer satellites (Rigor 2000, Comiso 2003). Downward longwave radiation has increased, as expected when air temperature, water vapor and cloudiness increases (Francis 2006). More ocean heat is being transported into Arctic waters (Shimada 2006).

As sea ice melts, positive feedbacks enhance the rate of sea ice loss. Positive ice-albedo feedback has become a dominant factor since the mid-to-late 1990s (Perovich 2007). Older perennial ice is thicker and more likely to survive the summer melt season. It reflects more sunlight and transmits less solar radiation to the ocean. Satellite measurements have found over the past 3 decades, the amount of perennial sea ice has been steadily declining (Nghiem 2007). Consequently, the mean thickness of ice over the Arctic Ocean has thinned from 2.6 meters in March 1987 to 2.0 meters in 2007 (Stroeve 2008).


Global warming has a clearly observed, long term effect on Arctic sea ice. In fact, although climate models predict that Arctic sea ice will decline in response to greenhouse gas increases, the current pace of retreat at the end of the melt season is exceeding the models’ forecasts by around a factor of 3 (Stroeve 2007).
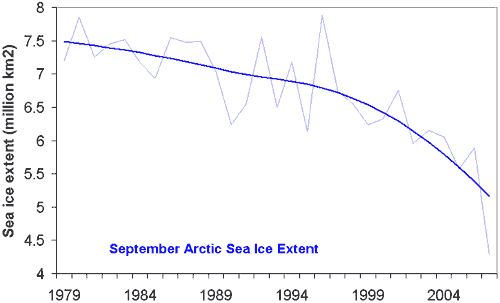


Figure 1: September Arctic Sea Ice Extent (thin, light blue) with long term trend (thick, dark blue). Sea ice extent is defined as the surface area enclosed by the sea ice edge (where sea ice concentration falls below 15%).

What caused the dramatic ice loss in 2007?

The sudden drop in sea ice extent in 2007 exceeded most expectations. The summer sea ice extent was 40% below 1980's levels and 20% below the previous record minimum set in 2005. The major factor in the 2007 melt was anomalous weather conditions.

An anticyclonic pattern formed in early June 2007 over the central Arctic Ocean, persisting for 3 months (Gascard 2008). This was coupled with low pressures over central and western Siberia. Persistent southerly winds between the high and low pressure centers gave rise to warmer air temperatures north of Siberia that promoted melt. The wind also transported ice away from the Siberian coast.

In addition, skies under the anticyclone were predominantly clear. The reduced cloudiness meant more than usual sunlight reached the sea ice, fostering strong sea ice melt (Kay 2008).

Both the wind patterns and reduced cloudliness were anomalies but not unprecedented. Similar patterns occurred in 1987 and 1977. However, past occurances didn't have the same dramatic effect as in 2007. The reason for the severe ice loss in 2007 was because the ice pack had suffered two decades of thinning and area reduction, making the sea ice more vulnerable to current weather conditions (Nghiem 2007).

Conclusion

Recent discussion about ocean cycles have focused on how internal variability can slow down global warming. The 2007 Arctic melt is a sobering example of the impact when internal variability enhances the long term global warming trend.

0 0

Printable Version  |  Link to this page

Comments

Prev  1  2  3  4  5  6  7  8  9  10  11  Next

Comments 401 to 450 out of 529:

  1. I don't care whether you agree with my definition or not, quite frankly. However, I care a little that you don't misunderstand what I say. I said that expertise usually implies an advanced degree. Not always, and it is not a requirement. However, that's the most common situation. Recognition as an expert is not nearly as important as genuine expertise, which stems from sincere pursuit of understanding through the scientific process. However, chances are that, if you are a genuine expert, you will get recognition. The scientific process involves peer-reviewed publications. I dont' care what you or anybody else says, peer-review publishing guarantees a minimum level of quality without which science would not be the successful enterprise that it is now. Everybody has anecdotes relating flaws in any system. So what? And please be more specific: "some fields" or "well known experts" does not tell me much. What exactly are you talking about? Why don't you cite these terrible dissertations, so we can see for ourselves? Furthermore, having references and cites listed actually enables anyone to verify things, so it is a good thing from that point of view also. I've read countless lines of BS about how the peer-review process is all wrong. Still not convinced and not about to be. This site is about peer-reviewed science, if you don't trust it, you shouldn't waste your time commenting about it. In the business and financial world, they operate differently. Their "standards" are about to cost us 800 billions, bar a complete collapse. Science does not do so bad in comparison. Lastly, I don't understand your circular thingy. I'm writing a paper and doing my research. I cite an article. How can that article reference another that will then reference the one that I haven't even finished writing?
    0 0
  2. MORE EP FLUX: "(at least where RV variations are not significant relative to beta - I think)" Strike that - I think it includes RV variations. I took another look at the math (Holton p.326-327 in particular) and I understood much better the derivation of the relationship: (zonal (x) average of IPV'v')/g*S0) ~= zonal average of (quasigeostrophicPV)'*v' = divergence of EP flux / density. Where the quasigeostrophic potential vorticity = IPV/(g*S0), where S0 is a basic state S that is constant over x; the division is to give IPV in terms of vorticity AV while still accounting for variations in S. (Holton doesn't actually give the relationship as such but I conclude that this must be the case - ). One key thing to remember is that some of the variations over x can be dropped from the equations because the average over x, of the variation over x, taken along a closed loop (lines of latitude) must be zero. And for such a zonal average, net fluxes of IPV in the zonal direction obviously can't be accounted for; one would have to divise some regional EP flux averaged along the direction of one's choosing, etc. for that... BUT ANYWAY, at least in the quasigeostrophic beta-plane approximation in log-p coordinates, the zonal average of the northward eddy flux of IPV is proportional to (the divergence of the EP flux) / density (or the southward eddy flux is proportional to the convergence, etc.). So when the IPV gradient is to the north (which is the general tendency), EP flux convegence corresponds to increasing Rossby wave amplitudes, etc. PS other waves and eddies can contribute to a IPV fluxes and EP fluxes The meridional (y direction) variation in the EP flux divergence thus corresponds to a net depletion or accumulation of positive IPV (or the reverse for negative IPV), for increasing or decreasing divergence northward, respectively. The same variation in wind can be due to vorticity variation over a short distance with large vorticity maxima and minima magnitudes, or over a large distance with small vorticity maxima and minima magnitudes; wind is proportional to vorticity times length. In an analogous way, for a given magnitude of EP flux divergence (at a given y, z* location), whether it is spread out over y or concentrated, the same total amount of IPV*mass must be passing through that point; the same IPV * length scale of IPV must apply for the areas of IPV flux convergences and divergences; so the effect on the zonal wind is about the same. EP flux divergence accelerates the zonal wind to the east (more westerly), as can be understood from the changing PS since EP flux divergence and converge result in horizontal fluxes of IPV, and since there is only a finite distance from south pole to north pole, the IPV distribution (and the average zonal winds) has to change as a result, unless diabatic and viscous processes destroy and create IPV and transport it vertically across isentropes (which, without diabatic effects, otherwise act as material surfaces that air can't cross) in such a pattern as to balance the EP flux's effects.
    0 0
  3. ... Those diabatic effects: relative to isentropes, there will be upward motion where there is heating and downward motion where there is cooling. Where there is heating above cooling, air is being pulled out of isotropic layers - the stability is increasing, tending to produce cyclonic IPV; by itself this leaves an ageostrophic wind shear such that there is a vertical minimum in cyclonic ageostrophic RV; thus there will tend to be a vertical maximum in convergence (or minimum in divergence), increasing cyclonic RV the most at that level and decreasing the stability until the horizontal variation in stability and vertical variation in vorticity are balanced for the new IPV. And so on for the opposite: cooling above heating. Thus the diabatic vertical motion across isentropes drives horizontal motion; diabatic vertical stretching tends to drive horizontal convergence (or a vertical minimum in divergence), etc...(it is because of geostrophic or gradient wind adjustment that this would occur, as opposed to vertical stretching in pressure coordinates, which, in a hydrostatic approximation, requires horizontal convergence because of conservation of mass, regardless of whether horizontal forces are balanced or not.) **PS NOTE THIS PARAGRAPH FOR LATER (REMINDER: 2AGEO1). This diabatic circulation is the residual meridional circulation (Holton, p.323) (For here, RMC for short). The coriolis effect acts on the horizontal part of RMC to produce acceleration in a perpendicular direction (this is part of the geostrophic (or gradient-wind or whatever) adjustment just described, which conserves IPV while bringing horizontal variations in S into geostrophic (or gradient wind) balance with vertical variations in RV). For zonal averages, seen in the y,z* plane, the coriolis effect acts on northward RMC to cause zonal wind acceleration (westerly). This is in addition to zonal wind accelerations caused by EP flux divergence (which is proportional to an IPV flux - which only redistributes IPV that exists: it is an adiabatic process, as I understand it) AND viscous forces (which are strongest near the surface, and can create or destroy IPV - near the surface, this generally tends to bring it toward f*S*g (that is, tending to bring RV toward zero). (PS the RMC is weak enough that one can approximate IPV fluxes without actually including IPV advection from the RMC; but RMC, although diabatically driven, can adiabatically advect IPV as well as be related to the diabatic creating and destruction of IPV). And the Ferrel cell?: The total MMC (mean meridional circulation) is the superposition of the RMC, which is necessarily thermally direct everwhere, with the adiabatic component of the MMC (mean meridional circulation), and a part due to friction (I'll just refer to that as VMC for now). The adiabatic component of the MMC could be divided into two components: one driven by eddy heat fluxes (v'T') and one driven by eddy momentum fluxes (u'v'). The first is thermally direct relative to the horizontal convergence and divergence of eddy heat fluxes (the temperature CHANGES driven by eddies), although it can be thermally indirect relative to the actual temperature distribution (as it typically is in midlatitudes). The second is thermally direct where the vertical variation in the convergence in the momentum flux (WHICH is equal to the vertical variation in the RV flux (v'RV') - see Holton p.320) is in the opposite direction of the geostrophic wind shear; otherwise it is thermally indirect. My understanding is that Both of these, and the sum of the two together, can be seen as the ageostrophi secondary circulation that is necessary to maintain nearly geostrophic balances between pressure gradients, temperature gradients, and horizontal stability variations, AND wind , wind shear, and vertical vorticity variations. So the adiabatic eddy-flux driven portion of the MMC is the process by which the eddy-driven adiabatic rearrangements of zonally-averaged IPV are brought back toward geostrophic balance. **PS NOTE THESE TWO PARAGRAPHS FOR LATER (REMINDER: 2AGEO2). The vertical motion of adiabatic MMC moves WITH isentropes, not across them. (continual transport of isentropes cannot occur indefinitely, of course. If the MMC is taken as averaged motion in the y,z plane, averaged over x along constant y and z* (or z or p), then it is not averaged along isentropes. The vertical part of the adiabatic MMC is the average of all adiabatic vertical motions - **if, on average, downward vertical motions occur where the stability is greater than where upward vertical motion occurs, then the average change in q could be zero while the average adiabatic vertical motion is upward, etc**. Of course, over any given time period, there could be some change in q, and then, diabatic processes could act to cancel the change in some places and times. SO, I think this is essentially what's happenning.: Increasing Rossby wave amplitude at a given position** (not to be confused with amplitude changes following propagation to different places, although the two could happen at the same time and place sometimes) tends to involve an adiabatic flux of IPV that is down gradient. Other waves can also cause IPV fluxes although some will not depend on IPV gradients to exist so much (gravity waves, for example). (PS the analogy for gravity waves is that increasing amplitude at a given location** corresponds to a downgradient flux of q - a vertical maximum in increasing amplitude corresponds to an area-average decrease in S at that level.) ** - well, actually it is at a location that moves with the air...but not too important a distinction, I think, for the following: For zonal averages: Divergence of the EP flux corresponds to a northward IPV flux; the resulting adiabatic rearranging of IPV drives a secondary ageostrophic circulation - in this case, the adiabatic MMC. The coriolis effect acting on the horizontal part of that MMC produces the acceleration of the zonal wind that is 'caused' by the EP flux divergence. The vertical and horizontal parts of the adiabatic MMC together move the temperature and wind fields toward geostrophic balance in response to the changed distribution of IPV. Although there is a way for the vertical part of the adiabatic MMC not to always result in an average change in isentrope positions, the change in IPV distribution may require (I think) some average change in q as well as changing atmospheric winds. The diabatic RMC is air rising across isentropes where there is heating and air sinking across isentropes where there is cooling, and the resulting adiabatic ageostrophic secondary circulation (although actually I'm not sure if the vertical part of that adiabatic circulation is included in the RMC ... it isn't included in the adiabatic MMC, though). The coriolis effect acts on the horizontal part of the RMC to cause a zonal (westerly) acceleration of the wind; this combined with adiabatic vertical motions act to bring the wind and temperature back toward geostrophic balance with the IPV changes caused by diabatic processes. The VMC could be described similarly. For long-term stable atmospheric circulation, for the averages over time, the coriolis accelerations acting on the RMC and VMC must cancel the accelerations 'caused' by the EP flux divergence (the coriolis acceleration of the adiabatic MMC), and the q changes and IPV changes must cancel. The VMC is of course driven by friction ((vertical) mixing of momentum and exchange of momentum with the surface). (I think the VMC is weak compared to the rest of the MMC.) The RMC is driven by radiational heating and cooling and latent heating and cooling (much or most (?) of the later occuring at the surface, and not cooling the air directly). Some of the RMC is determined by variations in atmospheric and surface properties (albedo, opacity, temperature) and the stimulation of latent heating in the presence of moisture (fronts, cyclones, ITCZ, ...). BUT some of the RMC can be driven by the EP flux if/when the EP flux is not balanced by an RMC (or VMC) to begin with... (? I was about to describe sudden stratospheric warmings (SSWs here) but the description doesn't quite make sense given what I just wrote. An SSW can occur when an planetary waves (kind of Rossby wave) propagate up into the stratosphere but slow and stop and some point. EP flux convergence continues to occur there; IPV is moved southward. The westerly wind decelerates. AS I had just described it, the deceleration of the wind is due to the maintenance of near geostrophy by the coriolis effect acting on the adiabatic MMC which is in response to the IPV rearrangement - that MMC would involve rising air below poleward and above equatorward and sinking air below equatorward and above poleward. If that were the case, the following wouldn't happen: The coriolis effect acts on the deceleration, causing poleward drift, and a meridional circulation with sinking below poleward and above equatorward, and rising below equatorward and above poleward. The adiabatic changes in temperature CAUSE diabatic heating and cooling that act to reduce the temperature change - the rising air diabatically heats and the sinking air diabatically cools - the RMC in response to EP-flux (but the diabatic temperature changes, at least in the case of a SSW, do not completely offset the adiabatic temperature changes; the air that sank still has higher T). But that is what happens. So I must have goofed-up something before...(?)*** What happens after that: The changes in the state of the atmosphere around the level of the initial EP flux convergence change the way planetary waves can propagate; they block their upward propagation at a lower level. This causes EP flux convergence at a lower level. And so on - the EP flux convergence, deceleration of westerlies, adiabatic warming of the air on the poleward side only partially reduced by diabatic cooling, etc. - all propagates downward leaving changes in it's wake. There is some connection between this kind of phenomenon and AO/NAM and SAM.)
    0 0
  4. "But that is what happens. So I must have goofed-up something before...(?)***" Well, after "SO, I think this is essentially what's happenning.", I forgot that the EP-flux related zonal wind accelerations were due to the sum of the coriolis effect acting on the adiabatic MMC AND the momentum flux convergence. Still, however, the result should be in geostrophic balance with the IPV rearrangement, so I'm still missing something...
    0 0
  5. "VMC" - actually, Holton identifies the friction itself as a direct forcing of the zonal wind. Which makes some sense, of course. But the result by itself won't be a balanced wind (then again, near the surface, the wind is generally less (subgeostrophic) and directed partly from high to low pressure...
    0 0
  6. A circular citation is very common, though it depends on the field and the publisher,it works like this author A cites author B on a point, checking the citation you find B hasn't done the experiment and is instead citing author C. Checking author C you discover that like author B he has not done the experiment but is instead citing another author but this time it is author A from an earlier paper. The circles tend to have 3-5 members but I've learned if I don't find the original actual experiment in the first 2 or 3 steps the author is faking. Peer review is only one step in the scientific method, I've seen it work well and I've seen it fail totally. If for instance you have failed to isolate the variable than the fact that the reviewer doesn't notice either is not a great help. I think you were trying to make a different point and I was picking on you for something minor but as you already know I think poor scientific method, especailly drawing conclusions too broad for the data available is a large problem. Unless you want it privately I really don't want to enter into specific examples our legal system is not the same as yours and this is a public forum and I am not really anonymous.
    0 0
  7. "author A cites author B on a point, checking the citation you find B hasn't done the experiment and is instead citing author C. Checking author C you discover that like author B he has not done the experiment but is instead citing another author but this time it is author A from an earlier paper." That could actually make sense many times. If C had some insight about A's earlier work that A and B did not have by themselves, and B did some more work on it or commented about it and made some key point in the process, than it makes sense that A would reference those points in additional work if it applied... Note that additional work is not necessarily an experiment. There's math and logic, analysis, etc, to do, and also, comparing multiple experiments to each other...
    0 0
  8. EP Flux AND SSWs - TOGETHER AGAIN (FIXED EARLIER PROBLEM - corrections to comments 403-405): If the zonal wind is slowing down in geostrophic balance, this implies decreasing stability (warming below, cooling above) on the poleward side and the opposite on the equatorward side. Deceleration by u'v' flux, taken in isolation, first causes an ageostrophic decrease in u (the zonal wind), which is then acted on by the coriolis effect, causing poleward displacement, which is balanced by adiabatic sinking below and rising above on the poleward side (vertical stretching) and the opposite on the equatorward side, which causes an adiabatic temperature change pattern as described in the last paragraph; it reduces the initial change in u but balances the remainder with a change in the mass distribution. The meridional circulation is the momentum-flux forced adiabatic MMC; the coriolis acceleration of the poleward part of the MMC increases u; thus reducing the initial change in u. A similar MMC (the VMC) would occur in response to a reduction of u forced directly by friction. In contrast, for the eddy thermal fluxes that would cause a decrease in the geostrophic u, taken in isolation, they first cause an increase in the ageostrophic u (by directing the temperature changes in the same direction as described two paragraphs previously). The adiabatic MMC caused by this is in the same direction as that described by the previous paragraph. It reduces the temperature changes but the coriolis acceleration of the equatorward part of the MMC causes a decrease in u to balance the remainder of the temperature changes. ----------- The two MMCs are in the opposite direction. For the mechanism of SSWs, the adiabatic MMC forced by the u'v' flux divergence must be dominant, or else the DMC caused by the temperature changes must be able to act fast enough to have a 'sudden' effect. (The changes in temperature tend to shift radiative fluxes so as to diabatically cool the adiabatically-warmed areas, etc, and the adiabatic circulation which occurs in response to the diabatic processes would cause poleward drift at the level of the EP flux convergence. However, I'd guess this process isn't fast enough for something 'sudden' (how sudden is sudden? - will report back).) THIS is because, while if both u'v' and v'T' make contributions to EP flux convergence, the resulting temperature changes are correct for an SSW, an SSW also involves poleward drift at and around the level of the EP flux convergence. ----------- Seperating the DMC from it's adiabatic MMC response: The diabatic process doesn't by itself cause any vertical motion in x,y,p coordinates. It just moves the isentropes. In x,y,q coordinates, this looks like vertical motion relative to fixed isentropes. The adiabatic MMC response to the diabatic changes reacts by moving the isentropes part-way back (but not all the way back) to their earlier positions, but in so doing requires vertical motion in x,y,p in the same direction as that which occured in the DMC in x,y,q. Vertical stretching and compression in x,y,p change the stability part way, but not all the way, back to the pre-DMC values, while the corresponing horizontal convergence and divergence, while conserving the DMC-generated IPV changes, cause changes in AV and thus RV (tending to be in the same direction as the diabatic IPV change) so as to balance the remaining portion of the pressure, temperature, and stability changes. ----------- A question that may come up - as the EP flux convergence propagates downward in response to changing wave-propagation properties (more later on why that happens), shouldn't the temperature changes that occured below the EP flux convergence reverse themselves as the level of EP flux convergence shifts downward? I don't know - apparently it doesn't, at least not fully. Perhaps it has something to do with changes in pressure and stability with height? -------------- What is the EP flux and what isn't it? I think the adiabatic MMC response to diabatic processes must be included in the DMC, or else it wouldn't make sense to show a DMC (residual MMC) circulation on the graph in Holton (in log-p coordinates - not isentropic coordinates) However, a long term average for a stable climate must assume there is no net movement of isentropes, so the vertical motion of diabatic processes must automatically appear in log-p coordinates, although this includes the adiabatic response AND something else... Holton doesn't explicitly note a VMC but that may just be because it's small. Or maybe it is included by approximation with the DMC just because the DMC was calculated by assuming VMC = 0 (an approximation). All adiabatic MMCs (inluding those in response to diabatic and viscous processes) also produce momentum, temperature, and IPV fluxes directly by advection, but they are, as I understand it, small in comparison to those fluxes in the EP flux and the sources and sinks directly from diabatic and viscous processes. Since additional MMCs would have to react to such processes, it is useful approximation to set them aside (at least for the purposes in Holton Ch. 10). Ealier I described how it would be possible to have (at least over a shorter time period ??) adiabatic zonal average vertical motion without vertical displacement of average q. However, in that case, there would be zero average adiabatic cooling or warming. Just something to keep in mind.
    0 0
  9. Phillippe Actually I do spend a lot of time at both PLos Biology and PLos ONE. Granted I am only lookong at Paleontology and Evolution related papers. I check the references but I have never noticed a "number cited" but you may be right, I may have overlooked it as I don't consider consensus important. I look to see WHO is referenced as there are authors I trust and others I do not.
    0 0
  10. You need to stop insinuating that the cites are some ploy to try to convince people of something or some way to establish a "consensus." It is a tool that researchers can use to access more information. Accessorily, it helps to determine the relevance and usefulness of a paper. The example I gave in post #394 is about diabetes and genetic, no suspicious consensus problem in this now, is there? You've spent too much time reading conspiracy BS on so-called skeptic sites,IMO.
    0 0
  11. CORRECTION to 408: third paragraph (the one that starts: "In contrast, for the eddy thermal fluxes that would cause a decrease in the geostrophic u," ) ... "The adiabatic MMC caused by this is in the same direction as that described by the previous paragraph." The exact opposite is true. The same point was made and implied correctly in other parts of comment 408. BUT often, the two MMCs are in the same direction, with the u'v' and v'T' effects making opposite contributions to the net change in IPV and balanced wind distributions. In particular, the vertical variation in RV advection and the horizontal curvature (Laplacian) of temperature advection (following the motion of the air) tend to have opposite effects, when advection is mainly by geostrophic winds, as described previously (comments 319 - 323). Whether the RV advection or the temperature (T) advection dominates in the IPV tendency depends on length and height scales, stability, AV and f, some other things - in a relation that is very similary to the relationships in the formula for the Rossby radius of deformation. More on that later... PS the example of an SSW in Holton, p.416, (estimated from a graph) shows (in terms of zonal averages) a warming of the polar stratosphere at the 50 mb level (PS sea level pressure averages ~ 1013 mb; 1 mb = 100 Pa = 100 Newtons/square meter), most of it in about 5 days, greater than 10 K (10 deg C, 18 deg F) north of ~ 65 deg latitude, greater than 30 K at ~ 80 deg latitude; with a reduction in the zonal wind of over 10 m/s north of ~55 deg latitude, becoming easterly north of ~61 or 62 deg latitude. Holton p.415: the warmings can be as much as 40 K. An SSW involves distortion and breakdown of the westerly circumpolar vortex in the stratosphere. Enhanced planetary (Rossby) wave propagation from the troposphere, of mainly zonal wavenumbers 1 and 2 (when a wavenumber is given without units, in this context it refers to the number of wavelengths that fit around a circle of latitude; zonal wavenumbers 1 and 2 are the longest of zonal wavelengths) is "essential" (Holton p.415) to produce an SSW.
    0 0
  12. In a quasigeostrophic approximation: In isobaric coordinates x,y,p: Following the air as it moves: As mentioned in comment 411, the change in vertical wind shear driven by momentum (wind) advection by geostrophic wind shear (Let's call this 'momentum forcing' - MF, in this context) is the opposite of the change in geostrophic wind shear driven by the Laplacian in the horizontal (sum of second derivatives in horizontal dimensions - aka 'curvature') of the temperature change driven by temperature advection (let's call this the 'thermal forcing' - TF, in this context). Both TF and MF make equal contributions to ageostrophic vertical wind shear: MF by changing the wind shear, and TF by changing the geostrophic wind shear in the opposite direction. The relative vorticity (RV) is the vertical component of the curl of the wind velocity vector, equal to the Laplacian of the streamfunction in the horizontal plane (horizontal being along an isobaric surface in x,y,p coordinates). And so the same is true for the variation of RV over height (over p in isobaric coordinates): Both MF and TF create equal ageostrophic vertical RV variation - MF by channging the vertical RV variation, and TF by changing the geostrophic vertical RV variation in the opposite direction. BUT One can add to MF the effects of advection of planetary vorticity - north/south winds in the presence of nonzero beta, and frictional/viscous torques. One can add to TF diabatic heating. Thus, the total MF is from the vertical variation (vertical derivative) of the sum of: the advection of RV, the advection of f, and the curl of viscous acceleration. And the total TF is from the Laplacian of the sum of: the temperature advection and the diabatic heating. For quasigeostrophic balance, vertical derivative of RV = -G/f * Laplacian of q where G = R/p * T/q where R is the gas constant for air, And for a given p, T/q = (p/p1000)^(R/cp) where p1000 = 1000 mb (a reference pressure level) and cp is the specific heat of air at constant pressure For the purposes of a simple scale analysis, this relationship can be written roughly in terms of a height scale H (Hp, in pressure coordinates), and length scale L, as RV/Hp ~ G/f * q/L^2 where the negative sign was dropped by assuming Hp is measured upwards (the direction of decreasing pressure). (~ can be read: "scales as" and/or "is of the same scale as") The change in vertical variation of geostrophic RV due to advection of q (proportional to the advection of T as a function of pressure: q = T*(p1000/p)^(R/cp)) is opposite the change in vertical variation of RV due to RV advection - this can be written advected RV /Hp ~ - G/f * advected q /L^2 ... Assume H = Hp for the rest of this comment: ... Well, without dragging everyone through the algebra, this implies (with conservation of IPV, where IPV/g = AV*S, S being del(q)/del(p) and AV = RV + f), where total (RV advection + f advection + curl of viscous acceleration)/H = W * RV advection/H Thus total MF = W * MF from vertical variation of RV advection and similarly, total TF = Q * TF from Laplacian of q or T advection: --- The balance equation and relationship between MF and TF can be solved for vertical motion: in terms of q advection, qad: vertical motion ~ (Q+W)*G/f * H^2/L^2 *qad } / [ G/f * H^2/L^2 * S + AV ] and in terms of RV advection, RVad: vertical motion ~ -{ (Q+W)*RVad*H } / [ G/f * H^2/L^2 * S + AV ] Vertical variation of vertical motion in pressure coordinates, in a hydrostatic approximation, requires horizontal convergence and divergence. This is the secondary adiabatic ageostrophic circulation. The Laplacian of vertical motion changes the Laplacian of q by moving q surfaces relative to p surfaces (adiabatic cooling and warming). The horizontal convergence and divergence changes AV (and thus changes RV, since, after a 'time step'**, f doesn't change because at an instant the air doesn't move and f is fixed at a given location) while conserving IPV; vertical stretching reduces S. This secondary adiabatic ageostrophic circulation (SAAC) brings the actual RV closer to geostrophic RV, both by (at least when assuming both W and Q are positive) reducing the RV changes forced by MF and reducing the q changes forced by TF. Notice that if W and Q are of the same sign, MF and TF cause SAAC of the same direction. If both changes in RV and q are reduced, it is possible for the net changes to be zero. But one effect could be said to 'win' if it is not zero. Substituting the vertical motion back into the balance equation: FOR Ross = G * H^2/L^2 * S/(AV*f) : balanced change in RV ~ RVad * [ W - (Q+W) / ( Ross + 1 ) ] balanced change in q ~ qad * [Q - (Q+W) / ( 1 + 1/Ross ) ] AND balanced change in IPV/g (where S is a basic state value) ~ RVad * S * ( W - Q / Ross ) Thus, for positive W and Q, the effect of RVad 'wins out' over qad in both balanced RVad, qad, and IPV changes, when Ross >~ Q/W whereas qad wins when Ross <~ Q/W Of course W and/or Q could be negative as well, in which cases ... - etc. It might seem odd that the change in IPV is determined by the spatial scales of MF and TF, but the IPV advection can be calculated from the TF and MF effects without SAAC, and it is the same, which is not surprising since the conservation of IPV during SAAC was used in the algebra (IPV may not be conserved during MF and TF because of viscous and diabatic contributions). And MF and TF forced IPV changes are affected by H and L because: forced change in S by TF ~ Q*qad / Hp and of course, forced change in RV by MF ~ W*RVad ~ - Hp * W * G/f * qad /L^2 NOTICE, Ross = G * Hp^2/L^2 * S/(AV*f) Thus sqrt(Ross) = Hp/L * sqrt[(G*S)/(AV*f)] If Ross = 1, L is proportional to the internal Rossby radius of deformation for a given Hp.
    0 0
  13. Various notes: 1. In the expression for Ross, as in the formulae for Rossby radii of deformation, f could be replaced with f_loc if one is using a gradient wind balance instead of a geostrophic balance. 2. "'time step'**" - The secondary circulation (SAAC) obviously starts to occur as soon as MF or TF start to disrupt geostrophic (or gradient wind) balance. Rossby waves and other quasigeostrophic phenomena can be described witht the approximation that SAAC occurs to completion instantaneously (because it is faster than the quasigeostrophic advection that may contribute to MF and TF in a range of spatial and temporal scales). Using a time step where MF and TF occur without SAAC and then allowing SAAC to occur is just a way to illustrate cause and effect. Of course, using many small time steps, as in numerical integration or a computer model, can approximate the process. In reality, if there were a sufficently sudden MF and/or TF, the SAAC would over-react - it would tend to oscillate about a balanced-wind equilibrium. Within a closed space this could involve oscillation through the same conditions; but more generally, the oscillation at the source decays as inertio-gravity waves (or Kelvin waves if the situation calls for it) are radiated outward. Because these waves have some energy, but the resulting balanced state should be the same whether the changes are sharp or gradual, I suspect it must take some additional energy to force a sudden change, which suggests the fluid may tend to resist such change (?). One can see how a gradual change avoids producing significant inertio-gravity or Kelvin waves by using the approximation of many small time steps. A set of such ageostrophic waves are emitted at each time step, but the change at each step is small, so the emitted waves should be small as well. In addition, over many time steps, many sets of waves would be emitted that are not in phase with each other, thus not leading to greater and greater amplitudes over time. Changes that are gradual relative to the period of the ageostrophic waves can thus avoid significant emission of those waves (PS a similar argument can be used in describing why reflection is stronger off a boundary in space when it is sharp relative to wavelength - that may come up if I ever get to Rossby wave refraction.) But it would take some specific conditions to completely avoid emission of such ageostrophic waves - not accounting for those waves is one of the approximations that can be used in studying slower quasigeostrophic processes. 3. The MMC, including adiabatic response to diabatic forcing, is a zonally averaged SAAC. Thus the MMC due to the RVad (due to part of the u'v' of the EP flux**) and the MMC due to qad (which is the v'T' of the EP flux) will be equal, in the same direction. The MMC of a SSW is poleward at and around the level of EP flux convergence, but there is adiabatic warming below poleward, etc, so the RVad would have to 'win out' in that case if RVad were the dominant part of MF. Of course, the other important part of MF (except near the surface) comes from the variation in f, and planetary vorticity (f) advection often dominates over RV advection. The diabatic portion of TF that may occur with an SSW will tend to be, as I understand it, a response to the SSW. The warming of the polar stratosphere drives a diabatic cooling, which causes additional MMC in the same direction as that which occurs as part of the SSW. 4. **Question - Did the analysis of comment 412 imply that, where RV and/or temperature variation contributes to the basic state IPV gradient, that there is some intermediate wavevector for which there is no propagation? This seems odd - but I have to set that aside for now. 5. The three dimensional wave vector = [k,l,m], where m equals 2*pi/(vertical wavelength). m can be given in terms of different units depending on the vertical coordinate being used (z, p, q, etc.). Downward phase propagation occurs with m < 0. 6. The analysis of comment 412 applies to vertical variations in MF. I think a properly-weighted vertically-average of MF could be subtracted from all levels so that the remaining MF is the vertically-varying MF that occurs with a TF (when W and Q are not undefined - that is, when there is some nonzero RVad and qad) and to which comment 412 applies. The vertically-averaged MF would cause some SAAC that tends to produce cold-core lows and warm-core highs (weaker at lower levels). The total vertical scale of the fluid places an upper limit on the vertical scale of any wave or other phenomenon. ------- For example, for planetary waves (specifically, IPV gradient due only to variations in f, with the gradient in the positive y direction) in a fluid with nonzero S, Cushman-Roisin finds the dispersion relation: w = - beta * k / [ k^2 + l^2 + m^2 * f0 / N^2 ] where N is the buoyancy frequency and N^2 is proportional to S for a given p or z, etc, and f0 is a representative f for a beta-plane. The solution was for waves that propagate horizontally but are standing waves in the vertical direction, of the form: 2 * cos(m*z) * cos(k*x + l*y - w*t) But this is the linear superposition of two baroclinic waves of opposite vertical tilts: cos(k*x + l*y + m*z - w*t) and cos(k*x + l*y - m*z - w*t) so the two wave vectors are [k,l,m] and [k,l,-m]. But they have the same w and the same dispersion relationship (which is independent of the sign of m) applies. This is for x,y,z coordinates for a fluid with definite top and bottom boundaries. For total fluid depth Hzd (d for depth, z for the vertical coordinate), there are a set of allowable m values (Because this was for waves that are standing in the vertical direction): m = m0, m1, m2, ... (and also negative m values of the same magnitudes) where m0 ~= N/sqrt(g*Hzd) and for j = 1,2,3 ... mj = j*pi/Hzd Putting these into the dispersion equation, one finds that the m0 wave has the same dispersion relation as a barotropic wave, w = - beta * k / [ k^2 + l^2 + 1/R0^2 ], where R0 is the external Rossby radius of deformation for Hzd, f0, and g, and the mj waves have the dispersion relation: w = - beta * k / [ k^2 + l^2 + 1/Rj^2 ], where Rj is the internal Rossby radius of deformation for Hzj, f0, and N, where Hzj = vertical wavelength / 2*pi = 1/mj. And, R0 is also equal to the internal Rossby radius of deformation for Hz0 = vertical wavelength / 2*pi = 1/m0. This seems to make sense so far. How does the dispersion relationship look when graphed in three dimensions, k, l, and m? The surfaces of constant w form ellipsoids; if the m dimension is scaled by some other factor, they appear as spheres. A cross section parallel to the k,l plane at a nonzero m has the same shape as the graph of w over k,l for the barotropic waves discussed in comment 361; for such a plane at m = +/- m0, the graph is exactly the same. Any cross section taken parallel to the k axis looks similar and can be made to appear the same with stretching or contraction along axes - with one exception: cross sections along the k axis, which pass through the origin where m and l are also 0. The difference there is that w goes to inifinity approaching the origin from negative k values, but all contours of w go through the origin. Other cross sections parallel to the k-axis appear similar at large wavenumbers, but at small wavenumbers, the difference is that there is a finite maximum in w along the k axis at a negative value of k. With some differences for wave vectors with m and l equal to zero, there will thus be similar patterns in group velocity and phase speed within any plane parallel to the x-axis. BUT, for the solutions from Cushman Roisin, m = 0 is not allowed, only +/- m0, m1, m2, ... etc, because these are components of standing waves in the vertical direction, with the waves of m > 0 being produced by the waves of m < 1 and vice-versa upon reflection (with the vorticity wave in phase with incident wave)from the top and bottom boundaries - or that's what I thought. But this is only approximately true for j = 1,2,3, ... and not true m0. The number of vertical wavelengths that can fit into the total fluid depth Hzd for standing waves reflecting in phase must be an integer multiple of 1/2. To a first approximation, the number of vertical wavelengths that fit is equal to j * 1/2, but it is actually somewhat more (the vertical wavelengths are somewhat less) and the difference increases for smaller j values (larger vertical wavelengths). For such standing waves resulting from reflections as just described, the j = 0 wave ought to have an undefined vertical wavelength - essentially an infinite wavelength, with m = 0. But in the dispersion relationship, that would be a barotropic wave with infinite frequency and phase speed in the horizontal direction. Instead, the barotropic Rossby wave has to be reconstructed from the linear superposition of waves with m = m0 and m = -m0. They are in phase at the lower boundary (the surface if in the atmosphere) but they are not in phase at the upper boundary, so the wave is strongest at the surface and decreases in amplitude with height. **This is problematic - it implies warm core lows and cold core highs, the pattern expected for topographic Rossby waves with nonzero S. The pattern expected for planetary Rossby waves (depending only on variation of f) with nonzero S is for amplitude to be reduced near the surface. So I'm not sure about this...**
    0 0
  14. Of course, other waves (or patterns of linear superpositions of waves) with mj for non-integer j values can exist, but they won't form a steadily-propagating pattern in the horizontal direction - they will interact with the boundaries of the fluid to produce reflected waves, which aren't part of the same pattern, so the pattern evolves. And there is a gap in the m spectrum between m0 and -m0. OTHER THOUGHTS: 7. It occured to me that the IPV distribution at a fluid boundary (as opposed to within the fluid) due to the potential temperature (q) gradient along that surface, might be described in terms of an 'image IPV' (? like an 'image charge' in electrostatics ?) that exists somewhere below the boundary, with the condition that the air doesn't cross the boundary between the real fluid and the image fluid. Along the same lines, the reflection (partial or complete) - if that's what it is - of the RV field of an IPV anomaly, off a boundary, might be due to an image IPV on the other side of the boundary that is a reflection of the IPV anomaly. But the image IPV is seen only from the side of the boundary it doesn't exist in (or else it has different effects where it is placed than from where it can be seen as a reflected image) ... haven't done the math on this idea, yet... 8. A planetary wave, depending on the basic state f variation, is modified by nonzero S but clearly depends on the basic state f gradient. A topographic Rossby wave has an IPV gradient that is due to variation of Hzd (or surface pressure) of the fluid due to bottom topography. (Barotropic Rossby waves with an IPV gradient due to RV variations could be said to be due to the 'topography' of the top of the fluid - which corresponds to variations in pressure on a geopotential (constant z) surface.) In the presense of nonzero S, the bottom topography intersects isentropic surfaces that are horizontal in x,y,z, or typically nearly so in x,y,p coordinates. It could be seen as altering the basic state fluid depth of individual isentropic layers where it intersects them. The IPV gradient could be said to be at the surface. There is thus a similarity between topographic Rossby waves and Rossby waves propagating due to a temperature (and thus potential temperature) gradient along a non-sloping (in x,y,p or perhaps x,y,z) bottom surface. And both should have amplitudes enhanced towards the surface. --------- About surface amplitude enhancement or reduction for topographic or surface q-gradient Rossby waves verses planetary waves, respectively - this is relative to the variation in amplitude with height that may occur because of basic state varyiations, in particular decreasing density. This effect was not covered by the baroclinic Rossby wave description from Cushman-Roisin, but Holton has solutions with constant vertical wavelength in z coordinates which increase in amplitude with height roughly in proportion to the inverse square root of density. Energy per unit mass is proportional to the square of amplitude, and thus given the solution from Holton, is inversely proportional to density. This implies constant energy per unit volume. For constant vertical wavelength with height, this implies constant energy per wavelength. Given the conditions for that solution, I think that Rossby waves with upward group velocity concentrate energy into smaller masses as the energy propagates upward. This is reversable, in the sense that energy per unit mass declines with downward propagating energy (it is not an aspect of an instability or dissipation of the wave).
    0 0
  15. Patrick 027 I do agree with you in your post 407. That is not only proper it is important, I was just pointing out that just because it is cited doesn't mean it is supporting everything said, or even that it is anything additional. I found that I had to know the citations in great detail to evaluate the paper. I am sure this is why we have to specialize so much.
    0 0
  16. ... The Cushman-Roisin solution is not intended to be a complete description of such waves (baroclinic planetary or Rossby waves in general) - just to illustrate the basic concept. It might (?) more readily apply to the ocean where density variations are a small percentage of total density.
    0 0
  17. More on Rossby Waves coming soon...
    0 0
  18. Philippe My point is that the number of citations is pure consensus, not science. Consensus is flat-earth proof, not necessarily factual. WA makes an excellent point above in 415.
    0 0
  19. Quietman - but I think Philippe also pointed out that a paper which disagrees with, overturns, rebuts, and/or especially finds errors in another paper, can/will cite that paper. Now I forget - was the number of citations originally brought up to point out the number of scientists (or scientists * work per scientist) who took the paper seriously enough to do follow-up (agreement or not)?
    0 0
  20. Patrick Yes, that's my point. Just the number of citations makes it appear to be endorsement while in fact they all could be arguments against the paper. I don't think that the number of citations is relavent for that reason.
    0 0
  21. Quietman, you're the one interpreting the number of citations that way. Among researchers, nobody cares about your interpretation. If a paper has a bunch a cites refuting it, then that makes it relevant too. Why do you think that Elsevier and everyone else provide links to cites and individual citing articles? Get over yourself. Your interpretation is not everyone's interpretation, especially not among those who actually work and research a field. I no longer think that you deserve to be called a skeptic. You accuse RC of political or other biases yet you have no problem throwing around links to Morano's pathetic bull***t. You linked Hays' letter but failed to mention how his very non scientfic objections were thoroughly addressed by the author he criticized. Oh, sorry, I forgot, you don't read RC. That limits your reading to critics of RC posts from other sources and restricts your access to responses that would be on RC. But it all fits with your idea of "skepticism" and "balanced view", I'm sure. You keep on citing stuff that does not support what you say it does and when called on that by Chris, you go on accusing him of bias or "not liking the authors" without ANY basis for the accusation. You give credence to far fetched ideas with a scant or non existent publication record while holding doubts on published ideas that have succesfully cleared authentic scientific scrutiny. When confronted with that, you resort to the tried and true, whiny excuse of creationists, i.e. "scientific journals are biased against our ideas so we can't publish." Pretty sad. You're not showing any true skepticism. By the way, I recall you mentioning scientific evidence of a coming ice age. Care to show the references? Are the majority of glaciers around the world growing? I also recall you talking about the weather and how cold it was wherever. Well, in Australia, it's mighty hot, and in China, Chile, Argentina, it's very dry and hot, and where I am we had extreme winter heat by the coast and a miserable snowpack. We've had spring skiing conditions in January, with warmer temps at 7000 ft than at 100ft. That's my weather report, local and other.
    0 0
  22. "Consensus is flat-earth proof" Subtle irony: there was never a scientific consensus that the world was flat (was it Eratosthenes? who calculated the size of the Earth somewhere around 500 BC, give or take? - but of course for a long time the average peasant farmer would not have been aware of this (the public school system wasn't that great)) - (I wonder what the ancient Chinese and/or Mayans thought on the matter?).
    0 0
  23. Baroclinic Instability: More: Bluestein describes "Sanders' Analytic Model", which is an idealized checkerboard pattern of baroclinic waves. Considering IPV gradients at two levels (such as the surface (due to the temperature gradient) and the tropopause), Bluestein suggests a range of wavelengths that can intensify by baroclinic instability, with both a long-wave and shortwave cutoff. The whole range and it's cutoffs shifts to longer wavelengths with increasing basic-state vertical wind shear, increasing stability S, decreasing AV and increasing vertical distance H between the levels (Bluestein doesn't explicitly mention those last two points) (*see comment 396*). AV and S have opposite effects; one can reason that decreasing AV/sqrt(S) tends to lengthen the wavelengths of the unstable range. At any given pressure level, sqrt(S) is proportional to N. Note the relationship to the Rossby radius of deformation. However, there is some IPV gradient within the troposphere itself. Using the Sanders' Analytic Model: (In the following, TGRD = basic state horizontal temperature gradient, which is proportional to the basic state vertical wind shear * f (thus, f being generally the largest component of AV, AV is involved in that relationship); VSP = Vorticity-stability parameter, which is in some way proportional to AV/S and larger for larger AV/S values, although I'm not quite sure what the exact proportionality is (Bluestein p.38-39,46) Bluestein p.115 states that while there is a longwave cutoff - which would not exist if there were no beta effect (**question - what about basic state RV,S gradients?) (although I'd thinkthere would still be some finite wavelength of maximum instability)-, there is no actual shortwave cutoff for baroclinic instability, although growth rates approach zero going toward zero wavelength - of course, at some point, the wavelengths are too short for quasigeostrophic approximations to work. Bluestein p.115 graph of baroclinic instability, as measured by deepening rates of surface low pressure centers, for a set amplitude of the temperature wave: 1. largest at some wavelength, .a. that is longer at larger TGRD (but less sensitive to TGRD at larger TGRD), .b. and is longer for smaller VSP (but not so sensitive to VSP at low TGRD at low VSP) 2. larger for larger VSP (and therefore larger AV/S), especially at longer wavelengths* (whereas one might have expected larger VSP to have larger effects at shorter wavelengths?) 3. .a. longwave cuttoff is longer at larger TGRD. .b. AT larger TGRD, longwave cutoff becomes more sensitive to VSP (in particular at higher VSP). .c. longwave cutoff longer for higher VSP (a bit surprising - this is the opposite of what would be expected from the two-level description) Some of these things broadly agree with expectations based on the effects of IPV gradients at two levels, but some, especially 3c., does not. ?? Some part of the difference might perhaps be due to having a comparison based on a set temperature wave amplitudes, as opposed to a set pressure wave amplitude - although they should tend to be proportional in at least the early stages of growth for a given wavelength and vertical structure (tilt); different wavelengths may have different vertical structures... ?? But also, some of the difference could be due to the nonzero IPV gradient within the troposphere. This is partly due to basic state variations in AV (for the Sanders model, if I'm not mistaken, this is all from beta (variation in f), as there is no basic state RV). It is also partly due to the basic state variation in S within the troposphere, which, in the model and also generally in reality, increases poleward (which goes hand-in-hand with the equatorward TGRD decreasing in strength with height. In fact, in the Sanders model it goes to zero at the tropopause and reverses above it. In summer and in the subtropics in winter, the temperature gradient does reverse across the tropopause, although not so at higher latitudes in winter. Because of this, the IPV gradient reversal occurs generally at the surface, so short-wavelength baroclinic waves at the surface whose induced wind fields do not penetrate much to the tropopause are still able to reach across an IPV gradient reversal. More Sanders' Analytic model results: motion of surface pressure centers (note that in this model, there is no basic state wind at the surface): p.46 east-west motion: 1 .a. There is a wavelength of maximum eastward surface low propagation - .b. - which is longer for higher basic state T gradient (TGRD). 2. westward only at longer wavelengths and lower TGRD. 3. .a. wavelength of maximum eastward motion may be a bit longer for lower VSP. .b. But westward speeds where they occur are also a bit greater for lower VSP, in particular for low TGRD. 4. Small eastward speeds for short wavelengths 5. larger eastward speeds for larger TGRD. It makes sense that larger TGRD, which corresponds to larger vertical wind shear and higher westerly winds at a given height above the surface, should correspond to faster eastward motion of the waves. That eastward motion is slower at wavelength extremes (and negative for the longest wavelengths) can be understood as a consequence of 1. dominance of the beta effect (planetary vorticity advection dominating over RV advection, where in this model, there is no basic state RV) at larger wavelengths (**or more generally, Rossby waves with larger wavelengths (which have greater vertical penetration***) have faster phase speeds and the basic state poleward IPV gradient (except at the surface***) supports Rossby wave self-propagation to the west). 2. Short wavelength baroclinic waves in this model are concentrated at the surface and they don't interact as much with the strongest westerly winds at higher levels (more generally, short wavelength features can occur at all levels, but they generally need to induce wind at the surface to initiate a growing wave by baroclinic instability, given typical conditions. Smaller VSP would decrease even more the vertical penetration of winds induced by small-wavelength features, so that the wavelength of fastest eastward motion shifts away from shorter waves, thus 3a. makes sense. Recall that baroclinic and barotropic instability both require a critical level where the air is not moving relative to the waves. I think this can be understood as a consequence of how the phase-locking mechanism works. A reversal of the IPV gradient in either the horizontal or vertical tends to come with a basic state horizontal or vertical wind shear, respectively, that is in the opposite sense of the difference in self-propagation directions of the Rossby waves on either side of the reversal. The only way (so far as I can tell) to have pattern without a critical level is 1. to construct a pattern that propagates through the air in the same direction on both sides of the reversal is to use a pattern that is not aligned for growth, but instead for at least some decay (in which case, the pattern may shift until it is so aligned, at which point it then have a critical level) - and for one side to dominate in controlling propagation (either by having a larger amplitude or having a larger IPV gradient, etc.), 2. or to have the wind shear be different from the stated tendency - which might occur if one has a horizontal maximum of, for example, anticyclonic vorticity, corresponding with a horizontal maximum of S; however, the anticyclonic vorticity must then grow in strength vertically away from that level, and eventually either the variation in S has to change or else a boundary is reached where there is a surface IPV gradient, etc...*** For typical conditions, the IPV gradient reversal for baroclinic instability is at the surface, but the critical level is typically around 700 mb (in the the troposphere, below the middle of the troposphere (if the tropopause height ~ 250 mb; average sea level pressure is just over 1000 mb), but above the surface). It is not necessary for the critical level to coincide with the reversal. ??It might be the case, though, that the portion of the wave in between the reversal and the critical level depends on the wave on the other side of the critical level to interact with the wave across the reversal in order for the whole pattern to grow in strength.??
    0 0
  24. "2. or to have the wind shear be different from the stated tendency - which might occur if one has a horizontal maximum of, for example, anticyclonic vorticity, corresponding with a horizontal maximum of S;" That's for barotropic instability - and I'm not sure this could allow for growth without a critical level - I'm guessing it won't since I've read that critical levels are a requirement for growth - if not, then that was just a generalization that doesn't apply to all situations...
    0 0
  25. "??It might be the case, though, that the portion of the wave in between the reversal and the critical level depends on the wave on the other side of the critical level to interact with the wave across the reversal in order for the whole pattern to grow in strength.??" - this refers to the IPV pattern and not to the winds; the winds induced by the surface IPV wave extend through the layer beneath the critical level and a bit above it as well. ---------- Bluestein p.115 graph of baroclinic instability (Sanders model): 2b. instability is larger at larger TGRD. (PS whether TGRD is larger or smaller refers to the horizontal temperature gradient at a given vertical level, such as the surface, and not to variations in height, or to variations in the variation with height). Bluestein p.116: including frictional effects, one could find a short-wave cutoff and the wavelength of maximum instability may be made longer. --------- Bluestein p.47 graph and text (Sanders model) poleward speed of surface low pressure center (high pressure center tends to move equatorward): larger for larger perturbation temperature wave amplitude. larger for smaller wavelength and larger VSP --------- Bluestein p.48 (Sanders model) RATIO: cx/u(500 mb) = eastward speed of pressure centers / eastward wind at 500 mb: 1. largest for a wavelength which is longer at higher TGRD 2. larger at larger TGRD. 3. small at shortest wavelengths 4. negative at longer wavelengths and lower TGRD. ---(more Sanders:) RATIO: cy/v(500 mb) = northward speed of pressure center / northward wind at 500 mb: Larger for larger VSP and longer wavelengths. (For growing waves, surface high pressure centers move equatorward and so does the 500 mb flow at that point in the wave). ---(more Sanders:) There is a maximum wavelength for which the surface low pressure motion is to the right of 500 mb flow (and for which surface high pressures move to the left of the 500 mb flow, I think): 1. longer with larger TGRD; 2. dependence on VSP varies with TGRD: at higher TGRD, wavelength is longest for smaller VSP, at middel TGRD, for middle VSP, for small TGRD, larger for larger VSP, although VSP doesn't make much difference in that. VSP may have a similar effect on wavelength of max cx/u(500 mb) - it is longer for a VSP value that is higher at lower TGRD, lower for a higher TGRD, etc... ------------- Bluestein is not all about an idealized model; there is much information about observed patterns and the complexities of their mechanisms: Bluestein p. 116 - wavelength of 500 mb flow in Northern Hemisphere is shorter in summer than in winter, which makes sense given reduced S in summer. - Also, TGRD is larger in winter. In summer, the strong westerly winds are displaced poleward. --- p.117-118 - diffluent (streamlines diverge, winds slow down) vs confluent (streamlines converge, winds speed up) troughs (at intermediate heights in the atmosphere): Midlatitude cyclones seem more likely to intensify (at least in a "conventional" manner) when under diffluent troughs than troughs which are niether confluent nor diffluent and are less likely to intensify under confluent troughs. From elsewhere in Bluestein: the RV advection pattern suggests diffluent troughs should tend to 'dig' equatoward while confluent troughs should tend to 'lift' poleward. --- p.118-119 - horizontally tilted waves (positively tilted waves tilt to the east going poleward (SW to NE in Northern hemisphere); negatively titled waves are oppositely tilted): ..."1977 Glickman et al." found evidence that for upper level troughs, negatively tilted troughs are more likely than positively tilted troughs to occur with "convective activity" - this could be because of "stronger vertical circulation and lower static stability." --- p.199-126: Explosive cyclogenesis - most likely in the cold season over the ocean, "downstream from mobile, diffluent, upper-level troughs, within or poleward of the maximum westerly current, and near the strongest sea-surface temperature gradients such as the northern edge of the Gulf Stream." (and the Kuroshio current) The thermal inertia of the ocean can reduce transient horizontal temperature gradients in the air near the surface that are produced by air currents (p.39), but sea-surface temperature contrasts can act to create thermal gradients in the air above. Cold air from continents in winter moving over the ocean can result in low S (thus, higher VSP) near the surface, increasing instability for shorter wavelengths. The higher winds- more diabatic heating from ocean - high winds feedback (p.19,p.122: ""air-sea interaction" instablity proposed by Emanuel and Rotunno") can play a role. This mechanism is also implicated in tropical cyclone development, although sensible heating may be more important and latent heating less important for explosive midlatitude cyclones than for tropical cyclones. In satellite images, many explosive midlatitude cyclones do appear to have eyes (p.122). One (case?) study of explosive cyclogenesis (Boyle and Bosart) found cold and warm temperature advection values at higher levels in the atmosphere that were unusually large, due to a great lowering of the tropopause ... **more on that on p.123-125. **See also seclusion verses occlusion, p.125-126. --- p.126-127: polar lows / instant occlusions p.127-130: dryline-front intersection low, thermal low, subtropical high
    0 0
  26. General tendencies, typical dimensions of intensifying baroclinic waves: Wallace and Hobbs, p.435: Critical level near 700 mb; at that level, the pressure and temperature waves are ~ 1/4 wavelength out of phase, with warm air 1/4 wavelength east of the pressure trough when the temperature gradient is equatorward (which makes sense given the temperature advection pattern by the winds of the pressure pattern; above and below, air flow through the wave pulls the temperature wave into different phase relationships with the pressure wave, while vertical motion (largest at intermediate vertical levels) modifies the resulting temperature distribution, reducing the growth of the temperature wave amplitude overall but converting potential energy to kinetic energy in the process so that the winds can grow the temperature wave even faster... Again, see comments 76 and 77 at: http://www.skepticalscience.com/volcanoes-and-global-warming.htm ). Warm air is closer to low pressure below the critical level and closer to the pressure ridge above; the temperature distribution itself requires that the pressure wave tilts toward the west with height (when the basic state temperature gradient is equatorward). The tilt is not even at all levels: from Wallace and Hobbs, p.436: the displacement with height of the pressure pattern is about 1/4 wavelength between the surface and 500 mb, and 1/8 wavelength between 500 mb and 250 mb (actually, the simplest interpolation suggests a constant tilt from the surface to 250 mb in pressure coordinates p, but in geometric height z, the tilt must then be decreasing with height, since p decreases roughly exponentially with height in terms of z (exactly exponential for isothermal conditions, but it decreases faster through colder air)... Anyway, diagrams on p.435 of Wallace and Hobbs and p.149 and 163 of Holton show the tilt decrease to zero near the tropopause, and in Holton, the tilt then reverses going into the stratosphere. In Holton p.149, the axes (crests, troughs) of the pressure wave and temperature wave are shown intersecting near the tropopause, so that the low pressure coincides with the cold air and the high pressure coincides the warm air. Above that level, the warm air is ahead (east) of the high pressure, but only slightly, and at the tropopause, the temperature wave reverses nearly abrubtly (mathematically, the amplitude goes to zero and then negative without much horizontal displacement in between). This corresponds to higher S at the low pressure and reduced S at the pressure ridge near the tropopause (but the stratospheric air in general still has higher S than the troposphere). The same happens with the cold air and pressure trough, except that in the diagram of Holton p.149, the reversal of the temperature wave happens as the low pressure and cold air axes intersect, so that the coldest air never gets ahead of the the lowest pressure of the wave, because it becomes the warmest air again as they cross at the tropopause. The main reason for the difference appears to be that the tropopause is lower in the trough than in the ridge. (Note that a lowering of the tropopause tends to correspond to a cyclonic IPV anomaly). These diagrams perhaps shouldn't be taken too literally for those details... But it is true that the the tropopause is lower in the upper level trough and higher in the upper level ridge. Vertical motion can't abrubtly go to zero at some level; it has to approach zero gradually. Vertically motion in a growing wave is mostly thermally direct (warmer air rising, colder air sinking, available potential energy converted to kinetic energy) in the troposphere, but the vertical motion in the stratosphere forces the colder air up and the warmer air down. According to Wallace and Hobbs p.436, the vertical motion itself is dominant in conrolling the the temperature wave; the vertical motion adiabatically warms and cools the air by bringing isentropes to different pressure levels. This makes sense given the increase in stability going into the stratosphere (the effect of vertical motion on temperature is proportional to stability S). It also makes sense given that generally the basic state temperature gradient decreases going upward to the tropopause, and then is relatively weak in the lower stratosphere (except in winter subpolar latitudes, where it is the same direction and sizable, and maybe in parts of the summer hemisphere where it is reversed and sizable at some levels and latitudes). Thus, in the lower stratosphere, kinetic energy is converted back to potential energy. But is this a drag on growth or does the energy spring back at some point? The near alignment of the temperature and pressure axes in the stratosphere are such that in the lower stratosphere, there are cold-core highs and warm-core lows, which thus decrease in strength with height. For the wavelengths of baroclinic waves associated with such transient extratropical cyclones and anticyclones (synoptic scale systems), the waves thus decrease in amplitude going higher into the stratosphere; at higher levels, the larger-scale (planetary-scale) features remain while the synoptic scale features are not apparent. But this doesn't explain why the low pressure and high pressure should tilt east OVER the the temperature wave axes - that seems to violate hydrostatic balance. Maybe there was an error in that diagram? Would this be reconciled by looking at the mesoscale structure (because much of the vertical motion (especially upward motion associated with precipitation) and horizontal temperature gradients being concentrated into/near frontal zones (Wallace and Hobbs p.436), with associated jets - ps at least in part because thermally-direct vertical motion tends to reduce an increase in horizontal temperature gradients, the temperature gradients become sharpest near the surface and also somewhat around the tropopause level (but especially near the surface, I think) - when a front is developing, vertical motion tends to occur where rising motion is on the warm side and sinking motion on the cold side. But the vertical motion has to go to zero at the surface and falls to lower values going toward the tropopause and stratosphere, so there is convergence over the cold air and under the warm air. This allows intensification of the thermal gradient at the surface under the warm air and at upper levels over the cold air. Notice this suggests a general sloping of the frontal zone toward the colder side with increasing height; this is how fronts slope but that might actually not be the real reason?... fronts are more complicated than that...)?
    0 0
  27. Correction: Vertical motion relative to z (geometric vertical coordinate) must go to zero approaching a flat surface (that doesn't move - motions of the oceanic surface are not appreciable to mesoscale and larger atmospheric motions). Vertical motion must be proportional to horizontal motion and to slope along a sloping surface - in other words, averaging over smaller-scale turbulence, the motion approaches being parallel to the surface close to the surface. In pressure coordinates (p), there can be vertical motion at a flat surface as well as any other surface - this corresponds to changing surface pressure. Without diabatic processes, isentropic surfaces are material surfaces and thus cannot actually be pulled out of or pushed into the surface, although their intersections with the surface can be moved along the surface...
    0 0
  28. various add-ons: Barotropic analogue to Baroclinic instability: Cushman Roisin, p.103 to 106, examines the case of a band of constant shear (constant RV) of width 2*L, between expanses of zero shear, zero RV. The beta effect was not considered in the example. Cushman Roisin finds a short-wave cutoff; only wavelengths longer than about 9.829*L are unstable and can grow. This is somewhat analogous to considering baroclinic instability with two opposing IPV gradients at two vertical levels; in this case, there are two sharp discontinuities in RV surrounded by regions of constant RV. At the discontinuity, the RV gradient is infinite. But the change in RV is finite, so finite displacements result in RV anomalies of finite value, which can and will propagate as Rossby waves (It doesn't seem like this example included any divergence effects, but this description can be generalized to what would happen at a sharp discontinuity in IPV, or a situation that would approximate that scenario: a variation in IPV over a space considerably smaller than the wavelengths being considered). The dispersion relationship of such Rossby waves could be a bit different than those of waves in a constant IPV gradient. I wonder if the short-wave cutoff would be eliminated if RV varied continuously (as the short-wave cutoff doesn't occur in the Sanders' analytic model in which there is some nonzero IPV gradient at most or all levels)? In this example, Cushman-Roisin does not find a long-wave cutoff to instability. But a long-wave cutoff does occur in the two-level IPV gradient baroclinic case. I've thought about it but I'm not sure why the difference is there (as the wavelength gets longer, a point is reached where the wind field already extends across the reversal (or to the other IPV gradient) quite a bit and further increases won't enhance the interaction across the distance much more. Perhaps the difference is that maybe propagation speed is affected differently for barotropic waves along an IPV discontinuity than for waves along a vertical level of IPV gradient as the wavelength increases...) When there is a wave along a sharp discontinuity in IPV, then when the amplitude gets large (particularly relative to the wavelength), then the IPV anomalies of opposite signs are not centered on the same line. The situation is equivalent to IPV anomalies that are aligned, along with a change in the basic state that involves spreading out the IPV gradient. ------- When there is an IPV gradient outside the region of instability, as mentioned above, the phase tilts of the growing waves imply group velocity away from the reversal of the IPV gradient. This suggests wave energy is removed from the source of the waves, perhaps reducing the growth rates. This could be modified, in particular reduced, if there is a reflecting boundary (PS what about interference patterns?), if the IPV gradient decreases past some distance from the reversal (so that phase speed decreases relative to the air) or if the wind speed changes in a particular way, etc...
    0 0
  29. A couple other points: Revisiting topographically-forced Rossby waves: Topographic Rossby waves propagate due to variation in PV that are due to topography (which is an IPV gradient at the surface when the air (or water if discussing sea floor topography) is stratified (potential temperature increasing with height - in the ocean, potential density increasing with depth). Topographically forced waves occur when air flows over varying topography. Stretching and compressing air columns while conserving IPV requires changes in AV. When westerly flow goes over a mountain range, the vertical compression causes it to flow somewhat equatorward. Then, because of variation in f with latitude, RV changes as it flows equatorward, so that it turns back the other way. Etc... --------- I've mentioned Kelvin waves a few times but have never really explained them. Like inertio-gravity waves, and unlike Rossby waves, Kelvin waves are fundamentally ageostrophic. Kelvin waves are essentially inertio-gravity waves that are modified by a lateral boundary. 'In the open', the trajectories of inertio-gravity waves are ellipses - alternating pressure pushes the air back and forth (causing alternating pressure, hence the wave propagates) while the coriolis effect deflects the air or water sideways. For the simplest example of a Kelvin wave, consider a gravity wave in water of constant depth propagating along a vertical boundary (imagine a sharp dropoff into the water at the coastline) that is a straight line. As the pressure variations of the wave (corresponding to varying water height) accelerate the water in directions parallel to the boundary, the coriolis effect turns the water toward and away from the boundary. But the water can't actually move into or out of the boundary to balance water motion toward or away from the boundary at some distance. Thus water is removed or piled into the space near the boundary depending on the phase of the wave. This produces a pressure gradient that balances the coriolis effect, so that the water is only accelerated back-and-forth, not sideways. A steady waveform that can result is a Kelvin wave, whose amplitude decays exponentially with distance from the boundary - for the shallow-water approximation, where wavelength is much longer than fluid depth, it decays at a rate proportional to f/c, where c = sqrt(g*h), where h is the fluid depth, and c is the phase speed of the wave - see Cushman Roisin p.79-81. The 'shallow-water' Kelvin wave has the same dispersion relation as the shallow-water gravity wave: c = sqrt(g*h) has no dependence on wavelength, so it is nondispersive. (I don't know about intermediate or deep water Kelvin waves (wavelengths shorter than fluid depth), but would guess that they are dispersive, as are deep water gravity waves.) The Kelvin wave can only propagate in one direction - with the boundary to it's right (facing the direction of propagation) in the Northern hemisphere (f>0), to the left in the Southern hemisphere (f<0). (A solution where the Kelvin wave propagates in the opposite direction does exist, with the amplitude increasing exponentially with distance from the boundary also exists mathematically, but obviously that can't go on indefinitely - such a situation can exist if there is another boundary; from the other boundary, the solution appears as before, with the amplitude decreasing away from the boundary and the propagation with the boundary to the right in the Northern Hemisphere, etc.) Complexities - a lateral boundary with finite slope, curvature of the coastline - will modify the resulting behavior, although if the wavelength is short compared to the curvature, and/or long compared to coastline texture and the extent of the sloping boundary (continental shelf and slope, etc.), then the behavior shouldn't be modified too much, I'd expect. Equatorial Kelvin waves occur because of the reversal of the sign of f across the equator. If an inertio-gravity wave crossed the equator (at the equator it could only be a gravity wave, except for large scale non-zero RV), the elliptical trajectories on each side would run into each other. A Kelvin wave can propagate eastward along the equator that decays in amplitude away from the equator; the northern and southern halfs rest against each other so that the equator acts like the lateral boundary. The water motion is back-and-forth parallel to lines of latitude. Equatorial Kelvin waves can also occur in the atmosphere. More generally, there are no top-to-bottom boundaries in the atmosphere, but topography can produce partial boundaries, and can form complete boundaries for relatively cold air that can't be lifted over them with the forces that exist at a particular moment. Internal (baroclinic) equatorial Kelvin waves occur in the atmosphere that propagate vertically as well as horizontally and are of fundamental importance in driving the QBO (As mentioned somewhere above).
    0 0
  30. Now what I would like to know more about is how Rossby waves propagate up into (or down from) the stratosphere, and also why the stratospheric protion of synoptic-scale waves tilt as they do... And also, if the tilt of growing baroclinic waves tends to be concentrated near the surface (in x,y,z coords) because of the IPV gradient within the troposphere, because the basic state temperature gradient and basic state vertical wind shear are strongest near the surface, or both, ... As noted before, I expect the general tendency for a growing Rossby wave from either baroclinic or barotropic instability is for the group velocity to be away from the basic-state IPV gradient reversal. Does that group velocity reverse in the stratosphere, if there is any in the stratosphere? (Actually, considering the basic state IPV gradient within the troposphere, and the circulation patterns in a growing wave, the axes of IPV anomalies within the troposphere should slope in the opposite direction as the pressure axes - they roughly coincide with IPV anomalies of the same sign at the tropopause but slope with the temperature axes and may be close to 180 deg out of phase with the surface IPV anomalies (due to the surface potential temperature gradient) near the surface. Thus, the IPV anomaly at the surface and it's wind fields must dominate over the tropospheric IPV anomalies and their wind fields in the lower troposphere (in particular, around and below the critical level) in order for the structure of the wave to be as it typically is. PS it's interesting to consider what may happen along a storm track that is tilted horizontally - so that the basic state IPV gradient within the troposphere has a reduced component parallel to those at the surface and at the tropopause... perhaps it could even be possible to have an elevated IPV gradient reversal... ---------------------- But before going further into those issues: I derived the dispersion relation for the vertically-propagating planetary waves (in this case, Rossby waves with IPV gradient due just to beta) described in Holton, p.412-414: w = beta*k / [ k^2 + l^2 + [(m*Hs)^2 + 1/4]/LRS^2 ] Where LRS = N*Hzs/f0 where f0 is a representative f for a beta-plane, N is the buoyancy frequency (proportional to sqrt(S) at any given p) and Hzs is the "scale height" - this is not the vertical scale of a phenomenon or of the atmosphere as a whole or a layer of the atmosphere, but the vertical distance (in z) over which the density (and pressure) decreases exponentially by a factor e (e off the top of my head is ~= 2.718 ...?) - Hzs is treated as a constant here, which is fine since Holton was using a log-pressure vertical coordinate (not actually z but an approximation of z). Hzs is a function of temperature and actually decreases a bit with height within the troposphere. More coming...
    0 0
  31. change Hs to Hzs to be clear: w = beta*k / [ k^2 + l^2 + [(m*Hzs)^2 + 1/4]/LRS^2 ] or w = beta*k / [ k^2 + l^2 + (m*Hzs/LRS)^2 + 1/(4*LRS^2) ] Notice how similar this is to the dispersion relation for barotropic waves and for the Cushman Roisin solution (absent the part where the Cushman Roisin solution has w going to infinity). Graphing w in wave-vector space, using coordinates k, l, and m*Hzs/LRS, contours of w are spheres. w has a finite maximum value along the k axis. All cross sections that pass through the k axis are identical; all that are parallel to the k axis are similar - hence the behavior of group velocity and phase speed in any such plane projected onto x,y,z coordinates (but with scaling z according to Hzs and LRS)...
    0 0
  32. Re: "You keep on citing stuff that does not support what you say it does and when called on that by Chris, you go on accusing him of bias or "not liking the authors" without ANY basis for the accusation. You give credence to far fetched ideas with a scant or non existent publication record while holding doubts on published ideas that have succesfully cleared authentic scientific scrutiny. When confronted with that, you resort to the tried and true, whiny excuse of creationists, i.e. "scientific journals are biased against our ideas so we can't publish." Pretty sad. You're not showing any true skepticism." Chris has demonstrated his true faith by attempting to apply the laws of thermodynamics to an open system. And when I post a good explanation using a quote from a friend that was able to better express it than I, he attacks me personally, just like you did. Your citations of my using papers that do not support my views are your opinion, not fact. You cherry pick and so does chris, or should I say reverse cherry pick, selectively ignoring those parts in the paper that disagree and then interpreting those papers as either supporting your view or not supporting mine. I acknowledge AGW, I do understand how GHGs function and fully realize that this would be a much colder planet without them. But I also see the rest of the picture that you and chris refuse to acknowledge, ie. you are both in denial of natural cycles, chris even moreso than you. Disprove those scientists you disagree with rather than attempting to smear their reputation. You make yourself sound like a Hansen clone. If you can't disprove something then it's more likely true than coming from someone that's crazy.
    0 0
  33. ps I compare AGW alarmists to creationists because they use EXACTKY the same tactics and arguments.
    0 0
  34. Refraction: Okay, so these waves propagate, and w depends on the wave vector (among other things: Hzs, N, f (or AV and f_loc..., beta (or more generally the IPV gradient))... w is relative to the air as it moves. the phase speed in the x direction = cx = w/k. This is the speed through the air. The air moves, so to find the speed in the x direction relative to the surface, one must the x component of the (basic state) wind, u. Generally, for figuring out wave refraction and reflection, it is easiest to assume constant w relative to a common reference frame (such as the surface, or perhaps following the air at a reference location in the atmosphere (one must then account for horizontal or vertical wind variations when considering the w following the air at other locations). Then, if there is an interface across which some conditions change, then the component of the wavevector parallel to that interface must be the same on either side, but the component perpendicular to the interface can change as sharply as the interface is sharp. This wave vector component must be adjusted to maintain the same phase speed in the directions parallel to the interface on either side, relative to a common reference frame. Then, considering a steady state condition, one must have no convergence or divergence of group velocity times wave energy density. Since the group velocity can vary across the interface, the energy density must vary as well. This may require a change in amplitude across the interface. In the vertical direction, the amount of vertical stretching can change sharply, but more generally, RV and vertical displacments will vary continuously. In order to avoid a discontinuity in total amplitude for an interface for which the amplitude difference between incident and refracted waves is nonzero across a relatively sharp interface, one can add the amplitude of a reflected wave on one side to make up the difference. Because the reflected wave also has group velocity and energy density (a function of amplitude), the nondivergence of wave energy flux and continuity of amplitude of wave fields (RV' and S'(? or vertical displacement?) - for an electromagnetic wave, the anology would be the amplitudes of the magnetic and electric fields of the wave) must be addressed together (a system of equations) to find the solution. Once such a steady state is found, one can consider states that evolve in time, by introducing wave packets - regions of nonzero amplitude waves - that propagate with group velocity, which partially reflect and refract at the interface and follow the group velocities of the reflected and refracted waves, respectively, with the proportion of energy going one way verses the other being determined by the solution of the aforementioned system of equations. The squares of the wave numbers appear in the dispersion relationship. With the components parallel to the interface being fixed, one must vary the components perpendicular to maintain the required w value. The situation can arise when the solution is that the square of the wave number goes to zero or is negative. In the zero case, the wave number must then go to zero, which means that the wave length in that direction is infinite (the phase planes are parallel to that direction). In the negative case, the wave number must be an imaginary number. This means that the wave fields do not oscillate in that direction but instead grow or decay exponentially. Exponential growth may be allowed if the wave energy is coming from that direction, but usually exponential decay is the solution that fits physical reality. This is an evanescent wave; it remains wavelike along the interface but decays in strength away from the interface and cannot propagate wave energy indefinitely away from the interface. However, some portion of the wave may penetrate all the way to another interface (that portion obviously exponentially decreasing with distance); if the wave can have real values of wavenumbers on the other side of that interface, then that portion of the wave activity can 'leak' through the barrier and propagate again after the second interface - the wave tunnels through the barrier, just as in quantum mechanics, the wave nature of an electron allows it to tunnel through barriers. IMPORTANT Example: for the planetary waves described by: w = beta*k / [ k^2 + l^2 + (m*Hzs/LRS)^2 + 1/(4*LRS^2) ] The phase speed = cx = w/k the phase speed in x relative to a reference level is u+cx = u + w/k Note that k is negative, so cx is negative. For an interface that is horizontal, we need to maintain constant CY = v+cy and CX = u+cx. Just considering u+cx: cx = CX-u w = k*(CX - u) = |k|*(u-CX) IF u decreases with height, w must decrease. IF N increases with height, then LRS increases. This tends to decrease w. To maintain constant w with increasing N, m^2 must increase. If changes in u cause w to go to a large enough value, the denominator [ k^2 + l^2 + (m*Hzs/LRS)^2 + 1/(4*LRS^2) ] must get smaller than [ k^2 + l^2 + 1/(4*LRS^2) ] while if w must go negative, then the denominator must go negative - either way there is a point where m^2 must also go negative, and the wave becomes evanescent. I think this also implies 'total internal reflection' - the reflected wave is as strong as the incident wave. More generally, if the interface is sloped, k and l might also change. A wave packet with some northward group velocity component might produce a reflected wave packet with some southward group velocity component, or maybe vice versa. The refracted wave's phase line orientation in the horizontal and it's group velocity direction in the horizontal may also be different...
    0 0
  35. Quietman - not to come down too hard on you (especially since I've forgotten what the paper with all the citations was about (I'd look now but I've got to go in a few seconds)), but: "Chris has demonstrated his true faith by attempting to apply the laws of thermodynamics to an open system. " There's nothing wrong with applying the laws of thermodynamics to an open system so long as one accounts for the openness of the system. One method of creationists is to IGNORE the openness of the system. "You cherry pick and so does chris, or should I say reverse cherry pick, selectively ignoring those parts in the paper that disagree and then interpreting those papers as either supporting your view or not supporting mine." Taking points in isolation may not support anything or else make for a confusing mess. If area A warms by Ta and area B cools by Tb, the areal average warms by (Ta*A - B*Tb)/(A+B). If that value is positive, it doesn not require ignoring Tb to recognize the average's sign (although one needs both the averages and the variations to get the complete picture, but one can ignore a single grain of sand on the beach and still calculate the mass of the Earth). "But I also see the rest of the picture that you and chris refuse to acknowledge, ie. you are both in denial of natural cycles, chris even moreso than you." Are they in denial or do they disagree with you about which natural cycles or variations are significant and which ones are not and the significance relative to anthropogenic effects? "Disprove those scientists you disagree with rather than attempting to smear their reputation." "You make yourself sound like a Hansen clone. If you can't disprove something then it's more likely true than coming from someone that's crazy. " Sometimes a smear is truly deserved (Fred Singer); besides, didn't you just smear Hansen?
    0 0
  36. "are your opinion, not fact. " It is probably their opinion that their points are facts or are backed up by the facts. PS it is a fact that my opinion is ____. It may be someone's opinion that ____ is not a fact. It may be a fact that an opinion can't be justified. FACT: Ann Coulter seems to think she has a right to her own facts...
    0 0
  37. Patrick, Ann Coulter is nuts. Her crazy antics are the only stratageme she could muster to avoid being completely ignored. "Disprove those scientists." Let's take the example of Roy Spencer. Not only the errors in his UAH satellite data were noticed by others, they were also corrected by others, while Spencer and Christy merrily let all sorts of politically motivated individuals exploit the erroneous data, which they knew to be flawed. If any scientist not liked by deniers would go anywhere near such behavior, they'd asked for his/her head on a platter. But let's ignore that and just look at his more recent pastime: trying to show that the increased atmospheric CO2 owes nothing to human generated CO2. So far that has not gone well and led him to all manners of extravagant claims that "skeptics" trying to keep up appearances are trying to mitigate. However, it is the way he fumbled his maths on one of these claims that is really amusing. Spencer's "demonstration" is in this WUWT post: http://wattsupwiththat.com/2008/01/28/spencer-pt2-more-co2-peculiarities-the-c13c12-isotope-ratio/ It's rather funny that, with all their pompous tone, none of the posters notices how fundamentally flawed the mathematical argument is, until someone shows that you get the exact same result with any 2 unrelated time series subjected to the same treatment. Watts tries to divert attention from the core issue near the end, then he simply closed the thread for comments. Spencer's lack of understanding of his own maths is covered in this post: http://tamino.wordpress.com/2009/01/19/a-bag-of-hammers/#more-1435 That's a mathematical disproof, good enough?
    0 0
  38. "Patrick, Ann Coulter is nuts." No argument there! - unless we suppose that her value system is tilted towards notoriety and money and very far from truth (although that could also be said to be 'nuts'), in which case she is just making a living the way she wants to do it. Nice links!
    0 0
  39. "IF N increases with height, then LRS increases. This tends to decrease w. " I knew that didn't sound right! Increasing N while leaving m unchanged decreases the denominator [ k^2 + l^2 + (m*Hzs/LRS)^2 + 1/(4*LRS^2) ] and thus increases w. m must be proportional to N to maintain constant w. Thus, N increasing with height requires an increase in m to maintain constant w. u decreasing with height requries a decrease in w, requiring even more increase in m. Both effects tend to make the phase planes farther from vertical and closer to horizontal (the tilt away frome vertical increases). The vertical component of group velocity will generally increase at first as the tilt increases, but will reach a maximum value and then decrease. When u gets low enough, w goes to zero and then negative - and then m becomes large and imaginary (further decrease in u allows the magnitude of m to decrease but it will remain imaginary). the wave cannot propagate further. It may reflect back down; however, the variation of group velocity may cause the amplitude to become large at some level, to the point that there is wave-breaking, which is one way for wave activity to be absorbed in an irreversable manner, as described with regards to sudden stratospheric warmings (which reduce u, thus lowering the level to which the waves can propagate, etc...). Another thing that could happen is that where some component of group velocity is low, wave activity lingers, allowing more thermal damping to occur (the wave involves adiabatic temperature changes which tend to cause radiational cooling or heating). Clarifications: when a component of a wave vector is imaginary, the rate of exponential decay in that direction is proportional to that component's magnitude; thus the distance scale of penetration is inversely proportional to the magnitude, and thus is directly proportional to the magnitude of an effective imaginary wavelength. Regarding total internal reflection - the reflectance will of course be reduced if some wave energy is able to leak (tunnel - via the evanescent portion of the wave) across to a second interface where the wave can again propagate. --- Of course, temporal variations in wind can alter the result: If a wave propagates up to some level, and then the wind speed falls at that level, it takes the wave with it, so then the wave can propagate up further where the wind speed was lower, with less refraction. So short-term temporal variations in the basic state may also allow some leaks in the barriers to propagation.
    0 0
  40. #432 How dishonest you are Quietman.
    Chris has demonstrated his true faith by attempting to apply the laws of thermodynamics to an open system. And when I post a good explanation using a quote from a friend that was able to better express it than I, he attacks me personally, just like you did.
    First off, one can certainly apply the laws of thermodynamics to an open system. It only requires that the limits of the system are defined in the context of the particular analysis. In any case, I haven't discussed the "laws of thermodynamics". I described a very basic response of the Earth's temperature to an enhanced forcing. I pointed out that the earth will tend towards a new equilibrium temperature around which fluctuations occur due to stochastic and cyclic elements of the climate system. There's nothing very controversial or mysterious about that.. Secondly, you didn't post " a good explanation". You cut and pasted a completely unrelated post of some person on some other blog written presumably for some other purpose. Thirdly, I didn't "attack" you "personally". I pointed out that your posts didn't address my post at all. And how could a "cut and paste" from some unrelated blog by some person who hasn't read my posts, constitute a response to my post on this message board?
    But I also see the rest of the picture that you and chris refuse to acknowledge, ie. you are both in denial of natural cycles, chris even moreso than you.
    Examples please. I'm not "in denial" of any "natural cycles" for which there is evidence. There's clearly an 11 year solar cycle. There are cycles involving ocean circulation (the PDO for example). There are ocean circulation variations that are apparently more stochastic in their temporal evolution (ENSO, for example). There are cycles in the orbital properties of the earth (Milankovitch cycles) that govern insolation patterns that drive glacial-interglacial-glacial transitions....and so on.. So which "natural cycles" am I "in denial of" Quietman? Specific examples, please. All of these topics involve science, evidence, rational analysis, and on this message board, honest attention to the postings of others. If you can't deal with these issues, and other's posts in that philosophy, why not just ignore the posts that you happen not to like?
    0 0
  41. chris So you can't disprove my friends' definition just because he said it better than I could? You have not denied the existance of climate cycles? Go back and reread your responses. You have a short memory. You denied natural cycles the very first time I brought up the subject. Re: "new equilibrium temperature" discusses thermodynamic laws, implying a closed system. The earth has no equilibrium temperature, it constantly changes. GHGs do control it's limits but never achieve "equilibrium" because the earth "breathes".
    0 0
  42. Patrick Sometimes a smear is truly deserved ("we are all toast" Hansen); besides, didn't you just smear Fred Singer? Is turn about not fair play? Is it not "we are all toast" Hansen who smears everyone else on the planet that disagrees? Re: "First off, one can certainly apply the laws of thermodynamics to an open system. It only requires that the limits of the system are defined in the context of the particular analysis." No, limits of the system can not be properly defined.
    0 0
  43. ps Who is Fred Singer? The name sounds familiar.
    0 0
  44. correction to 442 Re: "new equilibrium temperature": This phrase discusses thermodynamic laws, implying a closed system. The earth has no equilibrium temperature, it constantly changes. GHGs do control it's limits but never achieve "equilibrium" because the earth "breathes".
    0 0
  45. Patrick Sorry, but this page has become too long and takes forever to load. I'll look to see your posts in other threads. But I will leave you here with this thought: How can limits of a system be properly defined is the system has been determined to be chaotic?
    0 0
  46. You don't really understand Quietman. I made a specific point about the Earth's temperature response to an enhanced forcing. Your friend posted some unrelated stuff about entropy and thermodynamics. I'm not trying to disprove your friends "definitions". Why should I want to do that? Your friend's "definition" have no bearing on my post. That's not very surprising since s/he apparently wrote in a context completely unrelated to my post. If you can't address the subjects of my posts Quietman, just keep schtum. It doesn't make any sense to trawl the blogosphere to find someone else's post that might have some vague relationship to mine! If you think I'm "denying" some well-characterized climate cycles, why not just direct me to the relevant post? You can give the url of the relevant thread, and all the posts on every thread is numbered. Just post the url(s) and the post number(s). Otherwise please stop making unsupported accusations insinuations. As for "equilibria" in relation to the Earth's surface temperature:... A considerable amount of scientific analysis supports the conclusion that the Earth's surface temperature responds to enhanced greenhouse forcing with a rise near 3 oC per doubling of atmospheric CO2 (between 2 - 4.5 oC at 95% certainty according the the IPCC compliations of the available evidence). Right now the Earth's temperature is fluctuating around a temperature "set" by the current solar irradiance and greenhouse gas levels (and incorporating insolation patterns, albedo and water vapour feedbacks, atmospheric aerosol levels, the position of the continents and location of major mountain chains, and so on). The Earth's temperature isn't rock steady, but undergoes fluctuations around the equilibrium temperature that results from the summation of forcings; these fluctuations are a result of cyclic and stochastic elements of the climate system. If the atmospheric CO2 levels double, the Earth's temperature will evolve towards a new equilibrium temperaure that will be somewhere around 3 oC warmer than the temperature around which the earth currently fluctuates. It's useful to understand that this temperature rise is the rise that will occur at equilibrium, since we understand very well that the inertias in the climate system (e.g. the massive ocean thermal sink) have the effect of damping the Earth's temperature response to a change in forcings. In other words, while the evidence indicates that the Earth's temperature response to enhanced greenhouse forcing is around 3 oC per doubling of atmospheric CO2, this temperature change will take many decades to be fully realized. That's a very straightforward, uncontroversial, and explicit use of the concept of equilibrium in relation to the Earth's surface temperature response to a change in forcings. If you feel the need to quibble with that, please do so on the terms of my post, rather than through completely unrelated notions of "thermodynamic laws" or "closed systems" or other extraneous stuff that someone might have posted on some blog somewhere.
    0 0
  47. re #442:
    chris: First off, one can certainly apply the laws of thermodynamics to an open system. It only requires that the limits of the system are defined in the context of the particular analysis." Quietman: “No, limits of the system can not be properly defined”
    Of course the “system” can be defined. One just has to be explicit about the phenomenon under discussion. So if the evidence indicates that the Earth’s “energy budget” is defined by the forcings arising from the Earth and the elements of its climate system (the land, oceans, atmospheric composition, continental locations, mountain ranges, air and ocean currents, land and sea ice, orbital properties..etc), and the sun and its properties that defined the insolation levels, then these are the elements that “define” the “system”. We might choose to consider other elements under quite specific circumstances. On the 100 million year timescale we might choose to incorporate the passage of the solar system through the spiral arms of the galaxy, and thus consider variations in the cosmic ray flux and its putative climatic influences. And then we would incorporate this into the “definition” of our “system”. Of course this is of little relevance to the effects of changing greenhouse gas levels over several decades or centuries. Or we might choose to consider the Earth’s temperature response to forcings resulting from asteroid impacts or massive tectonic events. Again this isn’t of much relevance to our consideration of the Earth’s evolution to a new equilibrium temperature defined by an enhanced greenhouse forcing under consitions of relatively constant insolation…. …and so on… So the “limits of the system “ can be properly defined. It’s a question of being clear and explicit about what we are addressing.
    0 0
  48. re #445:
    How can limits of a system be properly defined is the system has been determined to be chaotic?
    Again, you need to be explicit. Are all the elements of the system "chaotic"? Are the dominant elements of the system chaotic? Or not? If only some elements of the system are chaotic, what is the amplitude of variation around the equilibrium "set" by the non-chaotic elements of the system....and so on... So we could go back to the Earth's surface temperature. There's nothing particularly chaotic about the Earth's atmospheric composition, and the forcing resulting from the greenhouse effect. Likewise the vastly dominant source of energy into the system (the sun) isn't particularly chaotic as a source of heat energy. The level of solar irradiance drifts up and down slightly with an 11 year cycle in an essentially non-chaotic manner, and the solar constant increases interminably slowly on the multi million year timescale (also non-chaotic), occasionally the solar output does drift slowly upwards or downwards within a relatively small range. So in general it's the internal elements of the climate system that are chaotic. But the evidence indicates that these chaotic elements (outwith extremely rare catastrophic events like extraterrestrial impacts or massive tectonic eruptions) result in "noise" that has a relatively small amplitude. We can see explicitly that El Nino's and La Nina's can temporarily enhance or reduce the Earth's globally averaged temperature by 0.1 - 0.2 oC, that ocean cycles that redistribute warm and cooler waters during rather longer timescales can have similarly small effects on the globally averaged surface temperatures....volcanic eruptions can temporarily suppress temperatures for a few years... …in general (outwith catastrophic phenomena, or small non-predictable variations in solar outputs, such as those associated with the Maunder minimum and such-like) the dominant influences on the Earth’s energy budget aren’t particularly chaotic, and the chaotic elements result in “ noise” characterized as fluctuations around the equilibrium temperature “set” by the dominant forcings (sun, greenhouse effect and the particular extant properties of the Earth like the positions of the continents and mountain ranges, and the Earth’s orbit). ..so again, we need to be explicit about what we’re considering.
    0 0
  49. Quietman, you declared once that one of the RC contributors (you did not specify) was untrustworthy because of some political reason or source of funding, although you gave no specifics. Your judgement in the matter did not take into consideration the scientific quality of his work, which is a fairly objective measure (i.e. the Spencer "claim" detailed above as example of sloppy work). Fair enough, you're entitled to your opinion on that. I can understand that would leave aside one scientist's work because you don't like his ideas. Nonetheless, I would think that some level of reciprocity would apply to scientists with ideas you like (what a true skeptic would do), even if you could understandably be more complacent. We're still talking about science here. However, you had no problem spreading links to Marc Morano's propaganda. Morano is not a scientist at all, he is a PR professional working for a politician. What excactly is the rationale here?
    0 0
  50. "How can limits of a system be properly defined is the system has been determined to be chaotic?" The Earth isn't chaotically gaining and losing significant amounts of mass, even relative to the atmosphere. Aside from that: Divide space (or space-time) into some number of grid cells. Identify the energy, entropy, mass (in terms of chemicals, subatomic particles, etc.), and momentum and angular momentum flows into and out of each cell (define the cells to move with the mass when convenient - for example, define a system that orbits the sun along with the Earth, rather than having the mass of the Earth constantly pass through different grid cells). Identify the chemical and physical reactions within each cell. Balance the energy, entropy, mass, and momentum budgets. DONE! The long term equilibrium climate includes the shorter-term variability. The shorter term variability continues in part due to positive feedbacks but is limited by negative feedbacks that keep the climate within a certain range of behavior; external forcing shifts the whole of such an equilibrium state and positive feedbacks can contribe to that shift. "besides, didn't you just smear Fred Singer?" Fred Singer is either a fool or a liar - or blinded to the truth by some ideology. Who am I to deny him that title, for which he has worked so hard; he has earned it. (try starting with comment 218 at: http://www.realclimate.org/index.php/archives/2008/08/are-geologists-different/langswitch_lang/it )
    0 0

Prev  1  2  3  4  5  6  7  8  9  10  11  Next

You need to be logged in to post a comment. Login via the left margin or if you're new, register here.


The Consensus Project Website

THE ESCALATOR

(free to republish)


© Copyright 2024 John Cook
Home | Translations | About Us | Privacy | Contact Us