Climate Science Glossary

Term Lookup

Enter a term in the search box to find its definition.

Settings

Use the controls in the far right panel to increase or decrease the number of terms automatically displayed (or to completely turn that feature off).

Term Lookup

Settings


All IPCC definitions taken from Climate Change 2007: The Physical Science Basis. Working Group I Contribution to the Fourth Assessment Report of the Intergovernmental Panel on Climate Change, Annex I, Glossary, pp. 941-954. Cambridge University Press.

Home Arguments Software Resources Comments The Consensus Project Translations About Support

Bluesky Facebook LinkedIn Mastodon MeWe

Twitter YouTube RSS Posts RSS Comments Email Subscribe


Climate's changed before
It's the sun
It's not bad
There is no consensus
It's cooling
Models are unreliable
Temp record is unreliable
Animals and plants can adapt
It hasn't warmed since 1998
Antarctica is gaining ice
View All Arguments...


Username
Password
New? Register here
Forgot your password?

Latest Posts

Archives

An underwater hockey stick

Posted on 1 October 2010 by John Cook

A new paper adds another piece of the puzzle to our understanding of past climate change. This one is Twentieth century warming in deep waters of the Gulf of St. Lawrence: A unique feature of the last millennium (Thibodeau et al 2010).  In this paper, the authors reconstruct North Atlantic water temperature over the last millennium using oxygen isotopes from ocean sediment cores on the Canadian east coast. What they found is the warming over the 20th Century has had no equivalent over the last thousand years.
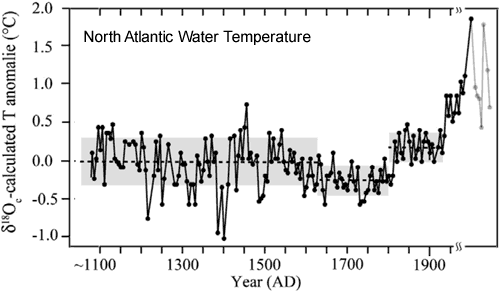

Figure 1: Temperature anomaly calculated from oxygen isotope composition. The grey lines to the right of the graph are shaded as that part of the core was disturbed by the coring process.

As the temperature record only represents one particular region, they also plot two reconstructions of Northern Hemisphere temperature which I've reproduced below (I use a colour version of the Moberg reconstruction with the instrumental record included).
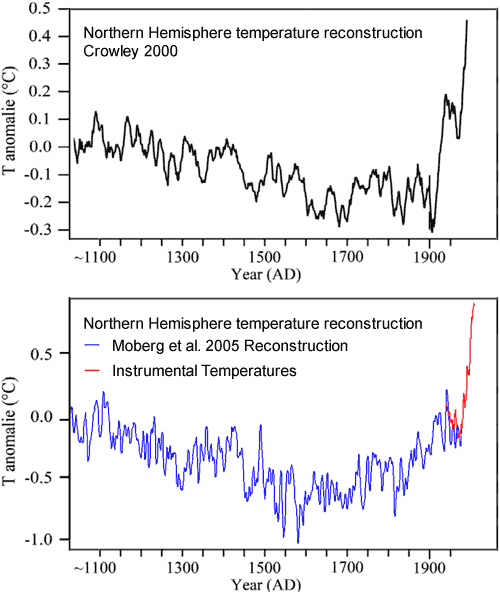

Figure 2: Two reconstructions of Northern Hemisphere temperature from 1100 to present (Crowley 2000, Moberg et al 2005).

The growing body of evidence is strengthening the view that current warming is unprecedented over the past 1000 years, as confirmed by a number of temperature reconstructions.

0 0

Printable Version  |  Link to this page

Comments

Prev  1  2  

Comments 51 to 98 out of 98:

  1. doug_bostrom at 09:09 AM, doug, actually the whole point is whether or not BOM or CSIRO have a good grasp of the literature you referenced. In fact the question you should be asking yourself seeing you are defending them as their resident expert, and I'm now asking you to demonstrate, is why BOM hadn't incorporated the information presented in the papers you referenced in to their forecasting models. Why the gap between the academic and the real world? It's ironic that the other source you referenced, the UNSW, in this article published by them, which I referred to earlier, http://www.science.unsw.edu.au/news/indian-ocean-drought/ actually supports that point, and this was published just early last year. There is no doubt that within BOM there were people who felt that the Indian Ocean was a far greater factor than officially recognised, as indicated by the papers you referenced,(I know of one of them, (not an author of those papers), and often reference his work), and it was the failure of BOM to incorporate IO data into their modeling that led him to resign and set up his own meteorological services. My criticism of UNSW is that they are some years behind in coming to the realisation of the influence the IO has on Australian weather. What they saw last year as a breakthrough, had actually been the same findings that the ex BOM officer referred to earlier had written about in about 2002 IIRC. The other criticism of UNSW is that in the video they mentioned how the IO dipole was changing Australia's weather pattern, yet if you read the UNSW article referenced above, that shift is merely repeating a cycle evident over 100 years ago and repeated a couple of times since, so it is not something that is new or unusual.
    0 0
  2. I'm a "resident expert," JohnD? Hardly. I'm simply a person who does not disagree with experts when I'm perfectly aware of my limitations, of the fact I'm not an expert. I could only wish that more people shared my inhibitions. Bothering to attempt answering your demand for some sort of "demonstration" would presuppose your premise is valid. Based on the provenance and content of literature discussing Indian Ocean influences on Australian climate, you don't seem to have a valid case. I can however offer that if you found yourself getting the cold shoulder from researchers by naively asking them questions posed from the perspective that you were bringing them novel information of which they've actually long been aware, you should not have been surprised or puzzled by their reaction. I wouldn't call you a crank, but that sort of behavior is after all -one- diagnostic of a crank. On a general note it's surprising to see a person who has elsewhere expressed a dim view of modeling insisting that a weather forecasting service precipitously incorporate what is described as a powerful new mechanism into a model, even criticize them for failing to do so, when in fact that person is selectively dismissive of the utility of models when applied to other purposes and has also made remarks to the effect that such models are overambitious. Why would such a person invest so much faith in one model in particular? Finally, concerning the late, lamented video, did you happen to notice that the researchers were speaking of a latitude shift in global circulation patterns, one that will change the climate regime of locations spanned by that shift?
    0 0
  3. JMurphy at 09:21 AM, that is the article I mentioned earlier in johnd at 05:42 AM. If you have any awareness at all of the timeline of the research that identified the IOD and continues on, and the parties actively involved, then surely it is obvious who are the parties ahead of the game and who are those behind the game. The debacle in 2006 when BOM issued a seasonal forecast based primarily on the ENSO that turned out to be totally wrong whilst forecasts for the +ve IOD turned out as being correct was perhaps the point at which realisation hit for those behind in the game.
    0 0
  4. doug_bostrom at 04:06 AM, perhaps the words of a researcher, Harry Hendon from the Centre for Australian Weather and Climate Research division of BOM might enlighten you. However given your criteria you will probably consider him a definite crank. Hope you don't choke on your red herring.:-) His details are at http://cawcr.gov.au/bmrc/clfor/cfstaff/hhendon.htm, contact him and ask him to verify that the following comments he emailed to another researcher, Gary Meyers, Director, Integrated Marine Observing System, University of Tasmania are indeed correct.............. Gary, I was thinking about the official seasonal forecast issued from BoM (which is currently based entirely on empirical relationships). They don't even factor in the IOD. They assess the likely state of El Niño, and the likely state of the subtropical Indian ocean (the so called Nicholls dipole), which was shown to have a relationship with Australian winter rainfall in an older Nicholls paper (which I think is now regarded as a bit of a red herring as far as predictive capability is concerned). The importance and predictability of the IOD has not percolated up (or down) to those who issue the forecast. I guess that's the fault of the researchers (like me) in BMRC. For those interested, I include a link to the official BoM seasonal forecast issued last July 2006, when we knew we going to have a pIOD. As you can see from reading the justification of the BoM forecast, http://www.bom.gov.au/announcements/media_releases/climate/ahead/20060725R.shtml the warm loading onto the subtropical IO was an important factor. This link shows what this SST pattern is in the IO http://cas.bom.gov.au/misc.dir/atlas.dir/index.html , which you can see has nothing to do with an IOD. So, in the official BoM forecasts, there is no mention of the IOD. Of course as it turned out last year, the official forecast for the SE of Australia wasn't too good: we had a pIOD and record drought. Ideally, in the near future the Bureau will switch their official seasonal forecast to the direct output from the dynamical ensemble system (single model or multi-model), for which the hindcast skill is well documented. In this case, we won't selectively call out a dipole event or El Niño event, rather, we will directly provide the regional climate predictions (e.g. pdf of eastern Australian temperature and rainfall) that result from prediction of the entire coupled system. Harry
    0 0
  5. QUOTE d_bostrom It's odd, how frequently we have skeptics saying words roughly along the lines of "But this other thing might be happening, and you can't show otherwise until you've found the information I've not provided to support my hypothesis." Ad hominem attack. Timeout in the corner please. I asked scaddenp anyway. His data is probably unpublished anyway. QUOTE CB_Dunkerson but your apparent conclusion that this means the oceans are somehow 'generating' the increased temperature is clearly illogical. Straw man argument. I didn't say that the oceans were generating energy. You did. QUOTE CB_Dunkerson Instead BOTH are increasing. But what is curious is that the ocean temp increase is leading the atmosphere temperature increase. You also need to get your terminology right. Generating increased temperature doesn't make sense. We are talking about transport of energy. Temperature is not energy. TOP-skeptical about skeptical skeptics
    0 0
  6. Was that supposed to be a dramatic unveiling, JohnD? I'm sorry, I just don't get the "ah, hah!" What I read is that there's a lag in incorporating theoretical treatment of Australia's regional climate and its external influences into models used by the Australian weather bureau. Is this supposed to be a black mark on climate science in general? Extending our food fun, "where's the beef?" I see a bun but no patty, it's not the meal I was promised. I think I understand from your general remarks here that you're involved in agriculture in Australia. If I'm right, inter-annual climate/weather predictions having to do w/Australia are certainly going to be near and dear to you. Supposing I'm right, I speculate perhaps you're so close to this subject that it's relative importance in the grand scheme of things is viewed very differently by you as opposed to folks in the wider world. On a more general note, your quote seems to indicate a general awareness of the IOD, hardly bolstering your case that it's been studiously ignored or exemplifies a black hole of ignorance in Australian climate research circles. Speaking of red herrings, exactly what does all this have to do with the topic of this thread?
    0 0
  7. TOP #54: Again, your claim that the oceans are accumulating heat faster than the atmosphere is true, but not at all "curious". That is an expected result of global warming. You seem to claim that it is NOT due to global warming, but dance around precisely where this energy is supposed to be coming from. Are you hinting at sea floor volcanism driving observed warming? It'd be a bad joke if you were, but you don't really say. As to the semantic flim-flammery with temperature vs energy... sorry, can't be bothered.
    0 0
  8. TOP, try to get your terminology correct. "Skeptics are often wrong" is not an ad hominem attack, nor is saying "skeptics often scurry to the refuge of claiming to be the victims of an ad hominem attack" the real article. In the specific case, I was remarking on a general feature you'd just demonstrated, namely that skeptics are frequently found demanding that others answer questions they're capable of answering themselves. On the other hand, saying "TOP is stupid" while ignoring your errors would be an example of an ad hominem attack. Also, temperature times mass times specific heat equates to energy, TOP. Sometimes it's possible to get so tangled in terminology that one misses the point.
    0 0
  9. doug_bostrom at 04:46 AM, what is clear to me that for many people the weather and the climate is a matter for conversation or of academic interest hence the interest in the theories, formulas and peer reviewed papers and little appreciation of how it all manifests itself in the real world. On the other hand there are others who are involved in the world of weather, or whose world is subject to the vagaries of the weather and the climate, and look for explanations for what is so readily observed. This is where I would put myself accounting for the differences of our perspectives. As far as the awareness of the IOD, firstly you have to distinguish between IO data and IOD data, but go back and read that email again to distinguish between awareness and implementation.
    0 0
  10. I'm going to leave the kitchen in your hands, johnd. We're into completely different cuisine than the thread topic.
    0 0
  11. doug_bostrom at 05:05 AM, doug, you've got no choice, the Nichols red herring you dished up has come back to repeat, unable to be digested.
    0 0
  12. TOP, Please learn what the ad hominem fallacy is before falsely throwing out accusations of such. "It's odd how skeptics say ..." is not an ad hominem. "Skeptics are wrong because of their general political ideology" is. TOP & scaddenp, If the oceans aren't generating energy, then this assertion that the oceans are heating the atmosphere is nothing more than "It's the Sun!" - the most used skeptic argument. Please read that article.
    0 0
  13. TOP - measurements of deep ocean temperature is from temperature probes profiling of ocean water. Eg. look at recent article on this site but grab the paper and look at the bibliography for pointers to more deep ocean papers. The data is public at NOAA. The heat flux from earth is calculated from temperature profile of wells drilled land and sea. Oil industry cares because to have oil, you need to have heated source rock into the oil window for production to occur while preferably not heating to point that gas is mostly produced. Basin-wide heat flux maps through time are constructed. The very high heat flux of volcanoes is rather local in effect sadly as rocks are poor conductors on this scale.
    0 0
  14. johnd, there's something not quite right with your supposed email from Harry Hendon. You state : "...the following comments he emailed to another researcher, Gary Meyers..." This suggests a personal email (however you managed to get hold of it), but the following from the email suggests otherwise : For those interested, I include a link... This means that it must have been sent to more than one person. Why the difference ?
    0 0
  15. CBDunkerson at 04:55 You are confusing energy with temperature... The oceans will absorb energy from the atmosphere... but they cannot warm more than the Temperature anomaly(and that would only be at the surface from LW), the heat flow is always going to be from hot to cold. Water holds vastly more energy than air... to quote Science of Dooms examples * if the oceans cooled down by a tiny 0.1°, transferring their heat to the atmosphere, the atmosphere would heat up by 100°C (it wouldn’t happen like this but it gives an idea of the relative energy in both) * "if the atmosphere transferred so much heat to the oceans that the air temperature went from an average of 15°C to a freezing -15°C, the oceans would heat up by a tiny, almost unnoticeable 0.03°C" Science of Doom Now, what you are proposing is happening in these graphs, is impossible, no two ways about it. Liquid water is extremely opaque to LW, and relatively so to SW, thus the reason the oceans are stratified, Warm water is less dense than cold water. There is no way for LW to heat the bottom water more than the surface at a given location. These observed anomalies in the bottom water cannot be the product of greenhouse warming in these area's. Bibliovermis at 05:38 "If the oceans aren't generating energy, then this assertion that the oceans are heating the atmosphere is nothing more than "It's the Sun!" This isnt actually ground breaking stuff... it has been known for a long time that the THC's velocity can have a huge impact on the climate, energy distribution is the difference between a glaciation, and an interglacial. So you pump more energy from the tropics to the higher latitudes, it results in a raised sea temperature, increased evaporation/water vapor in atmosphere, enhanced GHE, and the additional energy. Slow it down, reduced energy, water vapor/GHE and raised albedo. The difference between a hot house(jurassic) or ice house(present) is the way the continents effect ocean circulation, and the transport o energy around the globe.
    0 0
  16. Joe Blog. Its not called thermoHALINE for nothing - it is also driven in part by salinity difference. And deepwater formation transports heat into the depths. Best web reference I know is TCH And surely the BIGGIST difference between jurassic and now is not the distribution of heat but the huge difference in CO2 content of atmosphere, able to make up for weaker sun.
    0 0
  17. JMurphy at 08:03 AM, just because an message is directed to a single person doesn't preclude it from being copied to others as part of a group discussion. Why don't you ask him if that aspect is the most important to you rather then the subject? It was sent early 2007 by the way, just so you can put it into the timeline relating to the UNSW revelation.
    0 0
  18. scaddenp at 09:03 Im open to suggestion as to the why of the increase of warm bottom water(conventional wisdom, big freezes up north dropping more water than normal pulling more up, and feeding off the change, etc)... but if you rescale those graphs, it is very clear that the bottom water temps are leading atmospheric anomalies at the beginning of last century...its even visible without rescaling. Continental placement, dictates ocean currents, Ocean currents affect heat transport, which affect ocean temp... which affect its ability for carbon burial... the reason our co2 levels fell to where they are is when the continents came to be where they are 45mybp, with Antarctica over the pole, it prevented heat transport to the pole, and the Antarctic circumpolar current came into being, which caused a slow but steady decrease in ocean temp, and absorption/burial o co2, over the next 30 million years it fell, till 15mybp it was at the levels it is at now, which started the northern hemisphere glaciations, and this process continued till 2.5mybp, it fell to the levels that enabled full blown glacial cycles to start... the continents set the stage.
    0 0
  19. I should add, by bottom water we are only talking 400m down... not 4km, its not really bottom water, that would be pretty homogeneous, the author of the paper believe that the warm current feeding into the gulf increased by close to 100%. So it was making up close to 50% of the bottom water flow into the gulf.
    0 0
  20. Joe, I dont doubt that continental placement is important but I dont think you could model a warm jurassic in any configuration without high CO2. As to why CO2 has dropped right through Tertiary - interesting question, but I would look at the rise of carbonate-rock forming species (esp forams) over that period for my money. While circumpolar current certainly makes pole cold, I cant see why that cools ocean - doesnt affect the solar energy uptake.
    0 0
  21. scaddenp "While circumpolar current certainly makes pole cold, I cant see why that cools ocean - doesnt affect the solar energy uptake." Obviously, raised albedo on Antarctica would effect the earths albedo. But with reduced oceanic energy transport, this energy is going to transported via the atmosphere, a lot less efficiently, with vastly greater losses, driven by the differential in temperatures across latitudes. Cold water, holds more oxcygen, which enables it to support greater bio mass, Thus the greater burial, through lime stone etc(dead fish) Im not arguing that co2 is a GHG, or anything of the nature, i am just saying how i interpret these graphs relationship to each other, in relation to the warming event at the start to mid last century.
    0 0
  22. @Joe Blog (68): Unless I'm mistaken, the top graph is for temperatures in the deep waters of the St. Lawrence Gulf. It does not represent all of the NH, so drawing conclusions based on eyeballing graphs that do not represent the same geographical area isn't going to tell you much about how well they correlate.
    0 0
  23. Im not arguing that co2 is NOT a greenhouse gas... i mean, i dont doubt the radiative properties of it one bit, or have any issue with the greenhouse effect... but the climate is actually a little bit more involved than just one variable.
    0 0
  24. archiesteel at 10:16 AM Ive stated basically the same thing myself earlier... however(it would be a boring world if we all agreed), if you hold this graph as validation of the other reconstructions, you can hardly ignore the fact that the timing and magnitude of the anomalies are the wrong way around. It does correlate very well with the last 1000 years. Coincidences can happen, but...
    0 0
  25. Joe Blog #64: "You are confusing energy with temperature..." No... I'm not. As to the rest, the most glaring flaw in your analysis is that you are comparing water temps at ~400 m depth in part of the North Atlantic to air temperatures for the entire northern hemisphere. The samples are not equivalent... yet you are drawing a conclusion, that water at ~400 m warmed more than surface waters, which assumes they are.
    0 0
  26. CBDunkerson at 10:36 yet you are drawing a conclusion, that water at ~400 m warmed more than surface waters, which assumes they are. Well unless there has been a reduction in entropy, the warming has not come from the atmosphere in the region, we have their temperature anomalies. And you are looking at less than a degree, whilst the water temperature has increased more than a degree... at 400m. It has nothing to do with the atmosphere in the region, it is showing the relative strengths of warm and cold currents, which correlate well to hemispherical temperature anomalies.
    0 0
  27. Thanks scandenp #62. That's what I was looking for.
    0 0
  28. JMurphy JohnD's email quote appears to have been sourced here. It's worth reading the whole thing, a familiar refrain as we've yet again been treated to a rhetorically expedient selection. There's some discussion here further indicating things were not as simple as they've been portrayed. Not on-topic; maybe there's a better place here, such as "Models are unreliable."
    0 0
  29. Joe Blog #75: You say that you have the data showing that the surface temp anomaly is less than the ~400 m ocean temp anomaly for the Gulf of St. Lawrence... please show it. Given that most of the area around the North Pole has warmed more than 3 C I doubt your claim is correct. On your theory that ocean temperature anomalies in the area are more due to currents than warming directly at that location I might normally agree with you (and point out that global warming is... global, and thus would also have warmed the waters carried in by the current), but... this is the Gulf of St. Lawrence. It is blocked by several land masses which logically should prevent any major ocean currents from running through the area. That said... if an ocean current IS running through the Gulf it would have to be an offshoot of the Labrador current which comes down from the Arctic and hugs the coast all along the possible entrances to the Gulf of St. Lawrence. The Arctic is, as noted above, the region which has experienced the greatest temperature anomalies due to the enhanced greenhouse effect. So even if you are right about the water temperature anomaly being due to currents... it's right back to AGW again.
    0 0
  30. doug_bostrom wrote : "JMurphy JohnD's email quote appears to been sourced here. It's worth reading the whole thing, a familiar refrain as we've yet again been treated to a rhetorically expedient selection. There's some discussion here further indicating things were not as simple as they've been portrayed." Ah, so, as usual, what johnd leaves out is more important than what he writes ! Interesting as to how the models are all recognised as providing output that cannot be truly trusted in advance, and that some are better than others at different times, predictions, etc. What a surprise...not, and what a surprise that a so-called skeptic would cherry-pick...not ! It's also interesting to remember that the source you gave was also involved in claims (last year ?) that 'Japanese scientists disbelieve AGW' - it all went back to a similar email exchange at JAMSTEC that involved a group of people in discussion. Amazingly, the words then were cherry-picked to determine a belief very different than what was actually contained in the whole exchange. Well done for going to the trouble to find the original - something one rarely gets from so-called skeptics, unsurprisingly.
    0 0
  31. To John Cook, I find the above post JMurphy at 23:42 PM offensive. The censorship process by the moderator is not open or transparent in disallowing a response whilst allowing an offensive post to remain without comment by the moderator. If the above post JMurphy at 23:42 PM is allowed to remain then I would like my just deleted post reinstated in it's entirety. The remarks that I was responding to are an attack on myself and a distortion of how the debate evolved. I was very specific about the subject in question, that being the IOD and JMurphy at 23:42 PM is a distortion of what was being referenced as well as a snide attack. If you are not willing to reinstate my reply, then I ask that you censor his post as well.To John Cook, if the above post JMurphy at 23:42 PM is allowed to remain then I would like my just deleted post reinstated in it's entirety. I find it offensive. The remarks that I was responding to are an attack on myself and a distortion of how the debate evolved. I was very specific about the subject in question, that being the IOD and JMurphy at 23:42 PM is a distortion of what was being referenced as well as a snide attack. If you are not willing to reinstate my reply, then I ask that you censor his post as well.
    0 0
    Moderator Response: The comments policy here is quite clear. Try restating your case without the all-caps, more calmly.

    This is also a good time to take the entire topic of Australia's climate and the IOD to a more appropriate thread. Please use the search box at upper left, choose a better thread, and make further remarks there.
  32. Reposted due to deletion. Moderator, you asked me to restate my case, which I have repeatedly done, only to have them deleted.
    0 0
    Moderator Response: You have repeatedly asked that we repost the same long complaint originally deleted. In your most recent demand that your post be reinstated, you indicated you'd written that first complaint with the intent of being offensive. Enough. Drop it.
  33. johnd, I intend to reply this once only (if I'm allowed), because we are now way, way off topic. If you found my comment offensive then I'm sorry, because that is not how it was intended or, indeed, how I still read it. Perhaps I should use more emoticons, but, nevertheless, I am very surprised about your reaction and think it an over-reaction. However, that is just my opinion and you obviously disagree. Others will make their own minds up but I stand by my general assertion that the way you provide backing for your comments is overly (and frustratingly) selective and, again in my opinion, an unnecessary distraction away from open, honest and credible debate within these threads. Finally, despite what I think of some of your comments, I still would never ask for them to be censored or deleted.
    0 0
  34. JMurphy at 07:35 AM, I asked that your post be deleted only if my reply was not allowed to stand. If I wasn't to be allowed the right of reply, then it was wrong that your post should stand unchallenged. Initially all moderation was without any comments at all until I began protesting strongly. With regards to the previous original reference to the JAMSTEC discussion, I provided the full link so that anyone interested could have full access to the entire discussion, as you so obviously had done, I therefore could not have been accused of being selective or cherry picking parts of the discussion to suit. If anyone interpreted what was being discussed in the linked page differently to how I interpreted it, that is a different matter, but I openly presented it for all to access, so how could there have been any intent to be selective? In this latest case, I had been very specific in that I was referring to the IOD in relation to BOM modeling, and the email I referenced was the foundation for my assertions and provided 100% support for what I had stated about BOM not incorporating it into their modeling. I think that confusion arose because again what was interpreted from what I had posted was different what I had been specifically referring to. I also stand by what I had posted, hoping that it is instead read in the context meant and not read in the context the reader wants it put into.
    0 0
    Moderator Response: And that draws a line under it.

    One more reminder: Please move any further discussion on the IOD, Australia's climate, model goodness or badness to appropriate threads. For the IOD probably the best fit is What causes short term changes in ocean heat?.
  35. johnd wrote : "With regards to the previous original reference to the JAMSTEC discussion, I provided the full link so that anyone interested could have full access to the entire discussion, as you so obviously had done, I therefore could not have been accused of being selective or cherry picking parts of the discussion to suit." johnd, I have replied to this on the 'How reliable are climate models ?' thread.
    0 0
  36. CBDunkerson at 20:02 "Joe Blog #75: You say that you have the data showing that the surface temp anomaly is less than the ~400 m ocean temp anomaly for the Gulf of St. Lawrence" No, its a question of the physics involved. Rather conveniently Science o doom has a thread up on this very subject at the moment. Here The paper itself has been linked by doug bostrom at 17:49 PM on 2 October, 2010 This in itself isnt really a response, im a little short on time, but i will get back to you with radiative figures and aerosol figures from industry from that time when i get the time... It wasn't exactly clean burning coal plants in those days. I will point out again we are talking pre mid last century(we werent really having that big of an effect, but numbers speak better than words)
    0 0
  37. JB #85: So... contrary to your statement in #75 you DON'T have the surface temperature anomalies and CAN'T back up the claim that the Gulf of St. Lawrence has warmed more at ~400 m below sea level than at the ocean surface? You believe that warming is originating in the oceans rather than from 'back radiation' (and cite a Science of Doom thread which is in the process of debunking that view), but contrary to prior claims you do NOT have data showing ocean warming greater than surface warming. Which, as per my prior comments about the Labrador current, wouldn't prove your point in any case. "I will point out again we are talking pre mid last century(we werent really having that big of an effect, but numbers speak better than words)" That'd be the time period when increased solar irradiance was causing most of the global increases in temperature. Arctic amplification would still have come into play and thus all the objections I've raised still apply.
    0 0
  38. CBDunkerson at 04:39 AM No, i was talking about hemispherical records, and in light of the amount o energy it would take to raise water at 400m 1.7K from radiative heating at the surface above its location, is utterly ridiculous.(thus the reason i assumed you were mixing up temperature with energy) And i was kinda hoping you would follow the link backs, to realize that the ocean temp profiles are logarithmic... There is nothing ive seen on SoD i disagree with, its an excellent site. I have no problem with back radiation, with decreasing entropy however... As to the paper, read it.
    0 0
  39. Not to butt in, but the article above is talking about a comparatively tiny area of water in a restricted basin, not hemispheric-scale warming. Just so everybody's on the same page, figure 1 from the article, showing the area of interest:
    0 0
  40. Point is, let's not wander off into the weeds by talking about warming of the ocean on a global scale when the author is making no such claim.
    0 0
  41. doug_bostrom at 10:37 So true, i did make that my point myself at the begging o the thread, the correlation between this reconstruction, and hemispherical is convincing, and the authors also state they believe its because of the sources of the currents feeding it. There isnt enough info to draw anything definite about it... but i think it would be very safe to assume the anomaly has nothing to do with back radiation at the location in question, considering the depth.
    0 0
  42. Having trouble with our library connection to AGU so only seeing the abstract. However, the authors believe that what they are measuring is the temperature INCOMING intermediate North Atlantic waters, presumably inferred from local oceanography. To say where the warming is coming from would require data on intermediate water formation in NA - couldnt find anything useful in a quick look.
    0 0
  43. To me the interest of this paper is what it suggests regarding the utility of sediment cores in relatively closed waters as useful records of broader changes, possibly more sensitive and thus better for recording early onset of changes. Take a look at the graphs in this paper: Rapid 20th century environmental change on northeastern Baffin Island, Arctic Canada inferred from a multi-proxy lacustrine record (pdf, full text) and notice the coincident bump in numerous geochemical and biological markers during the course of the 20th century. Details show up that we'd not necessarily expect to see so clearly in bulkier, more highly damped bodies of water.
    0 0
  44. True enough, ScaddenP. There's a link to an open access copy of the full text back on the past page of comments, btw.
    0 0
  45. Thanks Doug, missed that. Reading the paper, I would hesitate to draw wider conclusions than the authors do themselves. The authors argue that the waters are result of mixing two very sources so that a change in proportion of mixing could dramatically affect temperature. Interesting but more work needed.
    0 0
  46. More hockey-sticks/statistics from Richard L Smith (Statistical and Applied Mathematical Sciences Institute, Research Triangle Park, N.C. and Department of Statistics and Operations Research, University of North Carolina, Chapel Hill). In this discussion, we use principal components analysis, regression, and time series analysis, to reconstruct the temperature signal since 1400 based on tree rings data. Although the "hockey stick" shape is less clear cut than in the original analysis of Mann, Bradley and Hughes (1998, 1999), there is still substantial evidence that recent decades are among the warmest of the past 600 years. The results support an overall conclusion that the temperatures in recent decades have been higher than at any previous time since 1400. On the other hand, none of the recent reconstructions shows as sharp a hockey stick shape as the widely reproduced Figure 3(a) of MBH 1999, so in that respect, critics of the hockey stick are also partially vindicated by these results.
    0 0
  47. Jumping around linksd brought me back to this page. I'm just curious if people are happy with the >1.5oC increase in temperature since 1900 seen in this underwater hockeystick?
    0 0
  48. Re: HumanityRules (97) Why on Earth would anyone be happy about that? Unless the increase was less than expected (that I would have been happy about)? You cannot imagine the joy I would feel if I could wave a magic wand and undo what we as a species have done with our injection of the bolus of fossil-fuel-derived carbon into our environment... ...a joy to be un-experienced and un-felt. The Yooper
    0 0

Prev  1  2  

You need to be logged in to post a comment. Login via the left margin or if you're new, register here.


The Consensus Project Website

THE ESCALATOR

(free to republish)


© Copyright 2024 John Cook
Home | Translations | About Us | Privacy | Contact Us