Climate Science Glossary

Term Lookup

Enter a term in the search box to find its definition.

Settings

Use the controls in the far right panel to increase or decrease the number of terms automatically displayed (or to completely turn that feature off).

Term Lookup

Settings


All IPCC definitions taken from Climate Change 2007: The Physical Science Basis. Working Group I Contribution to the Fourth Assessment Report of the Intergovernmental Panel on Climate Change, Annex I, Glossary, pp. 941-954. Cambridge University Press.

Home Arguments Software Resources Comments The Consensus Project Translations About Support

Bluesky Facebook LinkedIn Mastodon MeWe

Twitter YouTube RSS Posts RSS Comments Email Subscribe


Climate's changed before
It's the sun
It's not bad
There is no consensus
It's cooling
Models are unreliable
Temp record is unreliable
Animals and plants can adapt
It hasn't warmed since 1998
Antarctica is gaining ice
View All Arguments...


Username
Password
New? Register here
Forgot your password?

Latest Posts

Archives

The human fingerprint in the daily cycle

Posted on 20 November 2010 by John Cook

During the day, the sun warms the Earth's surface. At nighttime, the surface cools by radiating its heat out to space. Greenhouse gases slow down this cooling process. This is why deserts cool so much at night. Water vapour is a strong greenhouse gas and the dry desert air traps much less heat than more humid areas.

A more extreme example is the moon which has no atmosphere. At nighttime, there are no greenhouse gases to trap the outgoing heat. Consequently, the difference between day and night is more extreme with daytime temperatures getting up to around 118°C and nighttime temperatures falling below -168°C. In other words, the stronger the greenhouse effect, the smaller the difference between daytime and nighttime temperatures.

We are currently experiencing global warming. If an increased greenhouse effect is a significant part of this warming, we would expect to see nights warming faster than days. There have been a number of studies into this effect, which confirm that this is indeed the case. One study looked at extreme temperatures in night and day. They observed the number of cold nights was decreasing faster than the number of cold days. Similarly, the number of warm nights was increasing faster than the increase in warm days (Alexander 2006).
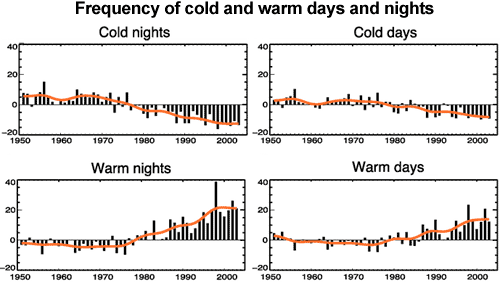
Frequency of cold and warm days and nights
Figure 1: Observed trends (days per decade) for 1951 to 2003 in the number of extreme cold and warm days and nights per year. Cold is defined as the bottom 10%. Warm is defined as the top 10%. Orange lines show decadal trend (IPCC AR4 FAQ 3.3 adapted from Alexander 2006).

The difference between daytime and nighttime temperatures is also known as the diurnal temperature range (DTR – the difference between minimum and maximum daily temperature). An increased greenhouse effect should cause the DTR to decrease. Over the last 50 years, DTR over land has shown a large negative trend of ~0.4°C (Braganza et al. 2004). The reason for the falling DTR is because nighttimes have been rising faster than daytime.

The daily cycle also offers interesting insights into climate change over the 20th Century. From the 1950s to early 1980s, global temperatures cooled slightly. A large contributor to the cooling was "global dimming" from 1958 to 1990 where less sunlight made it to the Earth's surface due to air pollution. However, over this period, the nighttime minimum temperature increased. While global dimming was cooling daytime temperatures, the increased greenhouse effect was warming the nights (Wild et al 2007). Even during mid-20th Century cooling, greenhouse warming was percolating away while we were sleeping.

0 0

Printable Version  |  Link to this page

Comments

Prev  1  2  

Comments 51 to 77 out of 77:

  1. rh=realtive humidity.
    0 0
  2. Camburn, This is silly. Your argument is a strawman-- you originally complained that "temperature, by itself, as a measurement of heat of the atmosphere." I suggested that other metrics, you asked for examples and I and others have answered-- your question has been answered. Also, temperature, like other metrics, is not considered alone, but represents part of a bigger picture. Other metrics are used,there are multiple, independent sources of data which are used to to track heat (and heat balance) in the climate system and they are in very good agreement with the thermometers and observed temperature trends from thermometers. Please go back and carefully read the literature referenced in the links that I and other have provided. Murphy et al. (2009) would be a good start, as well as some of Trenberth's recent work. What to do your questions have to do with the "human fingerprint in the daily cycle"? I know, nothing. Rather it seems an attempt to derail the thread and obfuscate. If you have issues with the temperature record, please take it to the appropriate thread. And you still have not answered KR's questions @33...very telling.
    0 0
  3. Camburn - See Water vapor is the most powerful greenhouse gas, also Urban Heat Island, and Are surface temperature records reliable. These issues are rather obvious, and have been addressed by the research. Your objections are quite simply not valid, but rather contentious, and do not reflect you reading any of the links that have been provided.
    0 0
  4. Camburn, Again with the obfuscation. RH is a very unreliable measure of atmospheric moisture content, because it is a relative measure of moisture, not an absolute measure. Dessler et al. and others tend to look at the mixing ratio, or even better the specific humidity when tracking moisture. Globally, the specific humidity in the troposphere is increasing in response to the warming.
    0 0
  5. Camburn, essentially you are saying that because all the indicators we are currently able to track to a relatively high degree of accuracy indicate human driven global warming they must all be wrong and we need to use a different indicator... which would require a new network of global monitoring stations to be installed (which 'skeptics' will simultaneously fight against as part of the evil scientist conspiracy to get research money by lying about 'global warming') and then take a few decades to gather enough data to show a trend. It should be obvious that this is an unreasonable position, but in any case... atmospheric heat content HAS been examined (as noted by others above). We don't have a global monitoring network, but general trends can be determined from satellite readings. This data supports human driven global warming too... so if you really want to lobby to spend the money needed to get precise totals of global atmospheric heat content all you will achieve is further confirmation of AGW. So please, by all means... push for massive increases in funding for climate research. I'm all for it.
    0 0
  6. #50: "WE have the tools at hand do we not? Let's use those tools." Here's the use of some of those tools from Gossard et al 1999: The authors show that if the total integrated humidity is independently available [for example, from the Global Positioning System (GPS)] and if the surface value of humidity is known, the profiles of humidity are retrievable with good accuracy. Those profiles, shown below, provide evidence that humidity (middle set of curves) decreases sharply with altitude. So I have to wonder: Averaged over the entire atmospheric column to the height of the troposphere, how much of a contribution to total heat content can a few hundred meters of surface humidity represent? I note further from my local weather reports that relative humidity does indeed rise in the evenings, but each morning my car's windows are covered with condensation. That suggests to me that water goes into the air and comes out of the air, with an overall equilibrium around the cycle. So why should there be any net heat gain?
    0 0
  7. I have a question for anyone regarding the mechanism by which greenhouse gases slow down the radiative cooling process. Am I correct in the following scenario: 1) Outgoing infrared radiation from the surface (oceans, atmosphere, land?)is absorbed at characteristic frequencies by greenhouse gases, promoting them to higher energy excited states. 2) Inelastic collisions between N2 and O2 in the atmosphere and excited greenhouse gases results in energy being transferred to the diatomic molecules as kinetic energy, raising the temperature of the atmosphere and resulting in a net loss of outgoing radiation. 3) The higher temperature in the atmosphere creates a reduced thermal gradient, resulting in slower heat transfer from the surface to the atmosphere. 4) Additionally, excited state greenhouse return to ground state by emission of IR radiation in all directions, including downward. Please let me know where I am right or wrong. Thanks.
    0 0
  8. muoncounter: Who is worried about net heat gain or loss? I was indicateing that we have the tools to measure the heat content of the atmosphere and are not using them. As far as the content of a few hundred meters of h2ovapor. It holds a lottttttttt of heat. How much, I don't know. I do know that a humid night cools much less than a dry night because of the retained heat.
    0 0
  9. oamoe: 2) This is wrong. The N2 and O2 recieve the kinetic energy at the expense of the co2. Once that collision has occured, the co2 is much less excited because it has lost some of its energy. You can't create energy, only consume energy. The sun is the source of most of the energy on earth. The earth contributes a small amount of heat from the core to the surface. It is not a source of consequence tho.
    0 0
  10. #58: "worried about net heat gain or loss?" If there is no net gain or loss due to water vapor, then it is merely a cycling agent. In climate change we're interested in long term trends; apparently you are saying that water vapor doesn't contribute to climate change? "holds a lottttttttt of heat." Well, that might be worth looking into, to see if this is much ado about not that much heat. "a humid night cools much less than a dry night" Agreed. If evaporation stores latent heat in the atmosphere, does the condensation of said humidity in the cool morning release that heat? What happens to that thermal energy from that point on? Suppose a desert area showed long term atmospheric temperature increase. Low humidity all of the year. How does that fit into your 'temperature isn't a measure of heat' paradigm?
    0 0
  11. Actually, oamoe's summary looks pretty clear to me, whereas Camburn's attempt at a correction doesn't really seem to add anything useful.
    0 0
  12. oamoe - That's a good summary of the effects. GHG's absorb and emit thermal IR at Earth temperatures, sending ~50% back to the ground, reducing the energy leaving the atmosphere. Camburn - First, a humid night cools slower than a dry one because water vapor is a greenhouse gas, and slows the IR cooling of the ground. Secondly, quite frankly, I don't care what the thermal mass values of air, water vapor, or the ground are. What's important is the temperature, since that's what affects crops, pest ranges, weather, ice mass, sea level, etc. Exact values for thermal mass are useful for predicting rates, but actual temperature observations do a pretty good job of that too.
    0 0
  13. KR: correction. The GHG's do NOT send more than 50% back to the ground. In fact, it is less than 50% because of the sperical shape of the atmosphere. I care what the thermal mass values are because those values are a true measure of heat content. Models deal daily with heat content, not temperature. That is the metric in climate science that is important. I would love to have layman's availability to the measured heat content variances. The heat content exerts a large forcing in temperatures affecting urban island heat effect. Without knowing all the dynamics it is impossible to accurately portray how much effect UHI really has.
    0 0
  14. Camburn - I'm sure I'm not the first to point this out, but you should read Does Urban Heat Island effect exaggerate global warming trends. The answer, in short, is no. I did say "~", by the way. It's just under 50% in the bands where CO2 and other GHG's are fully saturated, with increasing levels of GHG's broadening those bands. Heat content, yes, that's an important part of predicting rates. But that's really not relevant to what climate changes will occur - resulting temperatures are. The temperature at which crops change zones, where sea level affects coastal cities through thermal expansion and ice cap melt, etc. And the models, including the feedback amplifications that so greatly affect the final result of our CO2 output, are based upon temperature. Because temperature and GHG concentrations determine the IR output at the top of the atmosphere (TOA), determine whether we're at equilibrium or in an energy imbalance that will change that temperature. Our measurements of total energy budget are not as accurate as we would like, but our temperature measures are accurate, redundant (multiple ground station networks, multiple satellite data), and those tell us that we're in energy imbalance, with rising temperatures. Even if we don't really know thermal mass values (and we do, you've ignored that) or the exact energy imbalance, the rate of temperature change (anomalies) indicates where we are going, and to a large extent how much of a problem we're going to have. Not heat content. I really hate to say this, Camburn, but you appear to be searching for an out - looking to find some explanation that won't make rising temperatures true. I've seen people playing 'ostrich', burying their heads in the sand (yes, yes, I know they don't actually do that); you're giving me that impression. You've certainly not proposed anything not already accounted for in climate models, data sets, or our understanding of how our world is changing.
    0 0
  15. Camburn 63. Maybe you have a point. GHGs emit 50% of their radiation _towards_ the ground. Most importantly, there's a substantial quantity of GHG and non-GHG molecules in the atmosphere to intercept, absorb, emit this re-radiated energy. In both directions. And those molecules do the same thing. In both directions. Which is why less of the radiation can exit at TOA and why there is more energy retained and circulating within the atmosphere-ocean climate system. Temperature is a good indicator for the process. Ice melt is also a good indicator - which can itself be related to temperature.
    0 0
  16. Of the number of CO2 molecules absorbing outgoing blackbody radiation, what fraction re-emit the radiation, and what fraction transfer the excess energy to N2 and O2 molecules? Anyone know?
    0 0
  17. oamoe - At surface pressures, air molecules collide with other molecules ~1 billion times per second. The CO2 electron relaxation time for emission is about 100 nanoseconds, so a CO2 molecule on average collides with ~100 N2 and O2 molecules before it's able to re-emit. Given the statistics there, any excess or deficit of energy in the CO2 molecule will rapidly be dispersed through the air mass, meaning that CO2 will be very close to thermal energy with the rest of that air mass. And it will emit at a rate based upon the air mass temperature, and with the spectra of CO2. At lower pressures (stratosphere?) these numbers will change, but I would expect close equivalence between CO2 energies and the total air mass temperature down to around ~1/100th an atmosphere.
    0 0
  18. oamoe, you might want to check out the discussion in another thread. Commenter KR notes that the typical CO2 molecule will experience around 100 collisions during the time it takes to engage in the IR emission process. In essence, all CO2 molecules will both share kinetic energy with N2 and O2 molecules and emit longwave IR radiation.
    0 0
  19. Argh, I wasn't fast enough! During the time it took me to link to KR's comment in another thread, KR himself/herself appeared to add a comment here.
    0 0
  20. Thanks, Ned - I couldn't remember where I had posted that!
    0 0
  21. Actually, the rotational changes of an excited CO2 molecule occur at 10^-7 second, while emission appears to occur on the order of 10^-6 second. Hence that should be 1000 collisions before a CO2 molecule emits a photon. I read the wrong number, my apologies on the order of magnitude error! Note that these numbers are from laser work, with deliberately pumped energy levels and cascaded emission; thermal emission can be no faster than from this highly excited state. So to answer your question, oamoe, the fraction of CO2 that re-emits before sharing energy with the rest of the air mass is negligible.
    0 0
  22. KR, Thank you. So the re-emission b y CO2, then, will be of lower energy than the energy originally absorbed? And the energy from the thermal radiation from the surface that is absorbed is almost completely transfered to the higher atmosphere as heat? Am I correct on those points? Thanks again.
    0 0
  23. Almost; CO2 will (dependent on particular rotational and vibrational states prior to emission) emit photons over the full emissive spectra of CO2. There's sufficient variation in thermal states to cover the entire spectra, with the particular bands (aside from doppler effects and Lorentzian broadening) determined by the electron shell structure of the CO2 molecule. At thermal equilibrium emissivity equals absorbitivity - the energy, the spectra of photons going out equals that coming in. Or rather total energy in (convection, latent heat, absorbed radiation) will equal outgoing energy (convection, latent heat, emitted radiation). So the atmosphere will reach (or follow, if conditions are changing, as they currently are) an equilibrium state where incoming energy equals outgoing energy.
    0 0
  24. oamoe - Actually, a better link might be this one on thermal radiation. I think that's more complete than the emissivity link I provided in the last post.
    0 0
  25. KR, Thanks so much. So, is the thermal emission spectrum of planet earth characteristic of the surface temp or of some temperature in the troposphere? If so, approximately what temp does the emission spectrum correspond to.
    0 0
  26. There's a paper in JGR Oct 2010 Associations of diurnal temperature range change with the leading climate variability modes during the Northern Hemisphere wintertime and their implication on the detection of regional climate trends. Qigang Wu doi:10.1029/2010JD014026 While claiming to measure part of the DTR as coming from external forcing (anthropogenic or natural - no claim here of a human fingerprint) they assign most of the Tmax and Tmin warming trend and the decreasing DTR trend to by internal climate variability modes. Here's their numbers "Approximately 87%, 76%, and 43% of the total Tmax, Tmin, and DTR trends over NH land are accounted for by the three climate indices together [AO,PNA,PDO], respectively; these numbers drop to about 13%, 38%, and 62% represented by the AAO index over the SH land. At the global scale, 1.41 K of 1.60 K [88%] of warming of Tmax, 1.64 K of the 2.02 K [81%] warming of Tmin, 0.25 K of 0.43 K [58%] of cooling of the DTR during JFM of 1951–2000 is linearly congruent with the indices of four circulation modes considered here." (I added the square brackets)
    0 0
  27. oamoe - The overall emissions spectra outline (without the GHG notches) is about 267K, the notches drop as far as 225K. See The greenhouse effect and the 2nd law of thermodynamics (intermediate) for this graph: Sources of this radiation are spread between the surface (where there are no GHG notches) to the upper atmosphere (say, around a wavenumber of 650-670), with some coming from clouds as well. I can't give you exact proportions off the top of my head.
    0 0
  28. From the OP: "the stronger the greenhouse effect, the smaller the difference between daytime and nighttime temperatures." And whaddya know? Here's NOAA's assessment of the New Normal: This time around, the 30-year window for the U.S. Climate Normals is 1981-2010: the decade 1971-1980 was dropped, and 2001-2010 was added. Since the ’70s were an unusually cool decade, while 2001-2010 was the warmest ever recorded, it is not surprising that the average temperature rose for most locations. For the United States as a whole, it was not daytime highs (maximum temperatures) but overnight lows (minimum temperatures) that rose the most compared with the 1970s. --emphasis added Anecdotally, the ongoing heat emergency in Texas and Oklahoma isn't likely to be canceled anytime soon, because nighttime temperatures are stubbornly high. Watches, warnings and advisories, Aug 3, 2011 AN EXCESSIVE HEAT WARNING REMAINS IN EFFECT UNTIL 10 PM CDT SATURDAY. -- NWS Advisories use all caps (they should be shouting this). * DAYTIME TEMPERATURES: 100 DEGREES BY 10 AM TO NOON. HIGHS GENERALLY 105 TO 113 DEGREES THROUGH SATURDAY. AREAS NORTH AND NORTHWEST MAY SEE LOWER TEMPERATURES...BUT ALSO MUCH GREATER HUMIDITY. THE EFFECT WILL CONTINUE TO BE DANGEROUS HEAT FOR ALL OF THE NORMAN OFFICE FORECAST AREA. * NIGHTTIME TEMPERATURES: 85 TO 95 DEGREES MUCH OF THE NIGHT... FOLLOWED BY ONLY A BRIEF DIP AROUND SUNRISE. * DURATION: MOST LOCATIONS HAVE SEEN HIGHS ABOVE 90 DEGREES EVERY DAY FOR ABOUT 2 MONTHS... AND HIGHS ABOVE 100 DEGREES EVERY DAY FOR 1 TO 5 WEEKS. -- emphasis added Yes, I know, it gets hot during the summer. But this is ridiculous ...
    0 0
  29. muoncounter: The cause of the high temps in Texas etc is the warm waters in the Pacific NW. This is causing a blocking high. All signs are now pointing towards another La Nina, so relief from drought in this area will be marginal as the monsoon season during the onset/duration of a La Nina is quit weak. It appears the only hope of substantial drought busting precip in this area will require a hurricane of enough strength to over ride the effects of the blocking high.
    0 0
  30. First, I am aware of no study that has demonstrated that teleconnections cause nights to warm faster than days. And the warm nights are not limited to TX and OK, ac clearly stated by NOAA (it was even bolded by muoncounter)the results apply to the whole United States. My, how "skeptics" are quick to attribute these events to teleconnections (yes, they are important and may possibly playing a role in the TX/OK drought and heat wave, but that is not the whole story). ENSO has been neutral since mid May and is expected to stay neutral until at least the fall. I do agree that if another La Nina is in on the cards, that does not bode well for the SW'rn USA. "Skeptics" are not quick to acknowledge the role of feedbacks. That is less rain, lower soil moisture and less vegetation, increase in surface sensible heat flux and as a result higher temperatures. And the impacts are not limited to the boundary layer (see reference below). The low soil moisture is known to have played an important role in elevating temperatures observed during the 2003 European heat wave. See this paper by Fischer et al. (2007): "The evaluation of the experiments with perturbed spring soil moisture shows that this quantity is an important parameter for the evolution of European heat waves. Simulations indicate that without soil moisture anomalies the summer heat anomalies could have been reduced by around 40% in some regions. Moreover, drought conditions are revealed to influence the tropospheric circulation by producing a surface heat low and enhanced ridging in the midtroposphere. This suggests a positive feedback mechanism between soil moisture, continental-scale circulation, and temperature." The same physics probably hold true now in southwest USA. PS: SSTs off the Pacific NW coast are below normal. SSTs in the central Pacific are above normal, reflecting the negative phase of the PDO.
    0 0
  31. Albatross: If you can't see the very warm temps off the Pacific North West in your map, maybe this one will be clearer. Do you see the are that is labeled 6.2? This is what is causing the blocking high. Hot water creating blocking high
    0 0
  32. Albatross: ENSO has been neautral since May, but the climatic effects of the La Nina have not been. I was stating the reasons why the drought is prevelant right now in Tex/Ok/Ks etc. I was also stating why the temps are what they are. I don't know where you are from, so it is probable that you don't understand the dynamics of what affects weather in the USA. I farm, the weather dynamics that affect production areas are extremely well understood by farmers. A lack of that knowledge will make or break this profession. In fact, it is so important that it is updated twice a day, and the dynamics are discussed in great detail to allow us to plan accordingly. Are they 100% accurate all the time? No, but the best information available at this time. Thank you in advance for acknowledgeing that.
    0 0
    Response:

    [DB] A word to the wise:  It is best not to lecture to someone until you are sure that you actually are the expert.

    In this battle you pick, you are far outgunned.

  33. When I came here, I had the expectation that there was a certain amount of at least rudimentary climate knowledge on this site. With that expectation in mind, the mundane characteristics of weather should have been a slam dunk. Apparantly, I was disillusioned. Moderator: Feel free to delete this post, but also understand that the condescending attitude will drive away more peple than it will attract. And a lot of us live in the real world where we observe, and use intuition derived from decades of observation. And that intuition does have predictive power. Thank you.
    0 0
    Response:

    [DB] I am truly sorry you feel that way, Camburn.  Because that tells me you have only skimmed the surface of what SkS has to offer those truly interested in learning.  Thousands of posts and comment threads exist here on virtually any and everything related to climate science.  All posts abound with links to source references.  Actual working climate scientists not only read this blog daily, some contribute guest posts or participate in discussions here.  One such is Albatross.

    All of us live in the real world, not in the myth of the ivory towers of academia.  The fact that you feel disllusioned about what this site has to offer is telling.  Honestly, it is your preconceptions that are holding your understanding back, not the lack of knowledge or expertise on display here.  To say only a rudimentary understanding of climate science is on display here is a stunning example of the Dunning-Kruger effect.

  34. Daniel: feel free to delete again. No....in this battle I am not even close to being outgunned. I am talking a specific area of the world. In this specific area....I not only have my knowledge, but a host of people who sell forcasts and to keep getting paid, they have to have a good track record. The payments seperate the wheat from the chaff.
    0 0
    Response:

    [DB] I understand your point.  However as one who knows whom you are up against, your expertise and resources, while considerable, are still less than the mighty Albatross, that ancient mariner of yore.

  35. Camburn, the point being made is that the weather pattern you refer to cannot explain the pattern of warming nights relative to days. Also, while it could explain a persistent period of warmth and drought, what is so unusual about that setup that would cause long standing temperature and drought records to be broken?
    0 0
  36. Camburn, Your talk of SSTs in the north-central Pacific in a thread about record high nighttime temperatures over the USA is OT. Please explain the physical mechanism by which a blocking high over the north-central Pacific is causing record high nighttime temperatures across most of the USA, and parts of Canada too. Referring to your link, that is the SST anomaly I was referring to, over the north-central Pacific-- your language has not been very specific or clearand the N. Pacific is huge. Now instead of making subjective assertions, how about we look at a quantitative measure of blocking? That SST anomaly may well be contributing to a blocking high aloft over the north-central Pacific or Aleutian region, however the blocking index does not support that assertion. The figure shows there certainly has not been persistent blocking in the vicinity of the SST anomaly for the last 40 days during which time the highest temperatures have been observed. But, again, what is at issue here is what is causing the huge number of nighttime records that are being broken across the USA. Now can we please get back on topic. Tks.
    0 0
  37. Stephen: Cause and effect is the very high temperature of the pool of water off the PNW. This is causing a blocking high that while it shifts at times, refuses to break down. There are two areas of the world that affect climate/weather in the central US corridor. They are the PNW and the Greenland high/Icelandic Low. I should explain that the PNW refers to not only US territory, but Canadian as well. The worry that the forcasters are seeing is the blocking high finally breaking down, but the return of La Nina which will continue the dry parched conditions. This will allow summer highs to be very warm, and winter temps to be very cold. DB: My point was that people who are regular posters here have enough knowledge to understand the effects/causes etc of a blocking high. I do not mean to imply that this is not a good site. What I did mean to imply is that others have a knowledge base that should be examined, thought about, and then replied to in a civil manner. (-Snip) Thanks, my intention was not to disrupt. That is never my intention when I post.
    0 0
    Response:

    [DB] Text snipped per request.

  38. Thanks Albatross: I have no desire to pollute the thread, and if I can find the description of the whys etc that I read, I will post the link to your attention.
    0 0
  39. Albatross#86: "explain the physical mechanism by which a blocking high over the north-central Pacific is causing record high nighttime temperatures across most of the USA, and parts of Canada too." Considering that this DTR decrease appears as a result of the 'new normal' calculation, it's cause cannot be seasonal. A blocking high running for a large part of the decade? Now, that would be an anomaly indeed -- what would cause that? An effect significant enough to show up in a 10-year statistic is neither a transient nor an oscillation.
    0 0
  40. Muoncounter @89, Agreed. I was curious to see whether the assertion could be backed by something of substance. Now to be fair, the reduction of DTR is perhaps not the most robust AGW fingerprint, b/c it is quite sensitive to a number of factors. That has been discussed elsewhere at SkS and in the literature. But that is of little solace to the poor folks enduring nights when the minimum temperatures are hovering around +30 C.
    0 0
  41. Albatross, Agreed. Which is why I thought it so striking that the normals moved in the direction they did. And that my local weatherman started talking about not being able to take down the heat advisory because nights weren't cooling. And here's another look at DTR. Even though repeat heat waves brought sizzling hot days, overnight temperatures broke far more records: According to the National Climatic Data Center (NCDC), in July there were 6,106 record high minimum temperatures, and "only" 2,722 record high daytime temperatures.
    0 0
  42. Albatross: Apparantly NOAA now agrees with what I have been observing concerning a potential La Nina. I guess I am not the only one that is nuts. (Said with tongue in cheek) La Nina watch Back to DNT: The effects of this summer's warm night time temps are hurting corn yields. Last time this happened in this intensity was 1955. The high daytime/nightime temps will provide statistical verification over time to extent the trend. This climate year is an outlier, and hopefully will not be repeated for another 60 years. But the significance of it can not be denied.
    0 0
  43. Moderator: I don't know where else to post this. In this link, the commentator talks about the blocking high etc. Thank you. Farm Futures commentary
    0 0
  44. muoncounter @ 78 Your comment "From the OP: "the stronger the greenhouse effect, the smaller the difference between daytime and nighttime temperatures." And whaddya know? Here's NOAA's assessment of the New Normal: This time around, the 30-year window for the U.S. Climate Normals is 1981-2010: the decade 1971-1980 was dropped, and 2001-2010 was added. Since the ’70s were an unusually cool decade, while 2001-2010 was the warmest ever recorded, it is not surprising that the average temperature rose for most locations. For the United States as a whole, it was not daytime highs (maximum temperatures) but overnight lows (minimum temperatures) that rose the most compared with the 1970s. --emphasis added Anecdotally, the ongoing heat emergency in Texas and Oklahoma isn't likely to be canceled anytime soon, because nighttime temperatures are stubbornly high." muoncounter, I have to disagree with your post on this topic. Where the overall nightime temps may be closer to the highs overall this is definately not the case in Texas! The available evidence does not support your position and accually shows the opposite to be true. I think Camburn has the Texas heat and drought correct, a blocking high that does not allow rain storms into the area. From Accuweather website they list the entire month of high/low temps and the normal high/low temps. I used Dallas, Texas but will also link to Austin, Texas to demonstrate that Dallas is not an exceptional condition but the same pattern persists over a large area. I started Dallas temp on July 2 (day over 100 F in the long series of such hot temps) Here are the links. Month of July and early August temperature record.Austin Texas temperature record for supporting evidence. Dallas resembles Phoenix, Dallas lattitude 32.90 Phoenix 33.43. I took the Dallas high temp and wrote down how much above normal the daytime temp was for each day from July 2, 2011 to August 3, 2011. I did likewise with the low temperature. The daytime temperature averaged 7.03 F above normal. The nightime average was 4.24 F above normal. The daytime temp was almost 3 degrees F more above normal than the nightime temps. Conclusion: Logically determined from the evidence available. The higher Dallas nightime temperatures are not the cause of the higher daytime temperatures. The higher daytime temperatures are what are causing the higher nightime temperatures. Here is another one I calculated. The average difference between the High and Low temperature in Dallas from July 2, 2011 to August 3, 2011 was 21.97 F. The normal difference between high and low temperatures in Dallas is 19.27 F. So it is obvious from the data that your inserted quote in 78 "the stronger the greenhouse effect, the smaller the difference between daytime and nighttime temperatures." that the greehouse effect is not the responsible feature in Dallas heat wave. The blocking high is not allowing rain and clouds into the area so the increased solar insolation during the day is raising the overall temperatures and the nightime cooling (although greater than normal) is not enough to go down to normal.
    0 0
  45. Norman#94, The NOAA Normals are based on a 30 year period; their observation of a DTR change occurred when the decade components of the 30 year period changed. Climate change, not cyclical weather phenomena. My reference to current nightly high temperatures began with the word anecdotally, as in - based on or consisting of reports or observations of usually unscientific observers ; - of, relating to, or being the depiction of a scene suggesting a story . You present additional anecdotal evidence: The Dallas data link clearly shows that nightly lows are consistently well above the average. When nights are that much warmer than usual, I don't see how that's greater than normal cooling. And nowhere did I suggest that warm nights cause hot days. But this is what Austin's Emergency Management says: Extreme heat with higher than normal evening temperatures has caused the National Weather Service to issue a Heat Advisory for the Central Texas Region until Friday evening at 10pm. Peak temperatures happen between approximately 3-6pm daily. Temperatures of 105 degrees and above are expected this week. Limited nighttime cooling only serves to enhance this effect and limit the relief that people may expect in the nighttime hours. This 'blocking' seems to get a lot of play: Is it really a cause or an effect? The Weather Channel map for 4 August looks a lot like this cartoon from a weather prediction site: This high pressure cell, which is an extension of the Bermuda-Azores high, can become fixed over the same general region for several days, especially if the jet stream is weak and with a lack of Canadian cool fronts. The air is most stable at the center of the high pressure. Rather than dismiss this weather system with 'blocking,' look into what causes the blocking.
    0 0
  46. Norman @94, "I think Camburn has the Texas heat and drought correct, a blocking high that does not allow rain storms into the area." Sorry but this is wrong, Camburn is referring to a block thousands of km away over the Northern Pacific. Problem is, the blocking index data do not show any hint of blocking in the vicinity of the warm SSTs there. Regarding the DTR. While I appreciate your enthusiasm and interest in crunching numbers, what you have done is just not the way to go about it, and could lead you astray. Note too that you looked at two sites in a region experiencing a significant drought. Now that affects local temperatures three ways. First, during the day the sensible heat flux is much greater than normal which causes higher than normal temperatures. Second, that also means that the latent heat flux (flux of moisture) into the boundary layer is much lower than normal. Third, on account of the drought means that cloud cover and PWV content are both reduced. As a result, over the drought area at least, the daytime highs are inflated, while the nighttime lows may not be as high as one would expect during a heat wave. So that may be what you are seeing....not I said "may be". As Muoncounter showed, the NWS has noted that the temperatures at night are still way above average allowing people little or not reprieve from the heat. With that said, there could be a major issue with the data that you are using. I compared the AccuWeather numbers with the National Weather Service (NWS) numbers for Austin and they do not agree do not agree (for third August, NWS= 106/79, Accuweather = 105/74). A little disconcerting. So those data you are using do not appear to be vetted, quality controlled official data, and appear to have errors. Now the aforementioned hypothesis may hold true for the drought area. But the data show that for most of the USA, nighttime minimums are way above average and that the number of nighttime temperature records are outpace the daytime records. So when one looks at the body of evidence it points to something unusual going on, and something that is consistent with warming pattern expected with AGW. The following paper by Zhou et al. (2010) is the definitive paper on the subject of DTR, and I suggest that you carefully read it in its entirety. It is a complex issue (hence it not being the best fingerprint), for example, you will see different climate regions respond differently to the DTR affect.
    0 0
  47. This study http://dspace.mit.edu/bitstream/handle/1721.1/28612/57559869.pdf?sequence=1 shows that the UHIE in Phoenix manifested mostly as an increase in minimums (0.19F/year) rather than maximums (0.042F/year). I can also say that the record high minimums noted at Washington National in my area are only partly matched at other locations. National has had increases in paved areas in that location over a recent period (since 1942). Please note that this does not mean that higher lows are not real, they are real independent of UHIE and are best explained by AGW. But I have pointed out before that records are not corrected for site effects or UHIE. Quoting raw numbers like in this post #59575 above needs to have that caveat.
    0 0
  48. Nice new graphic from NOAA, comparing daytime temp records to nighttime temp records. Of course, its only one month. Almost 9,000 daily records were broken or tied last month, including 2,755 highest maximum temperatures and 6,171 highest minimum temperatures (i.e., nighttime records). ... The statistics reported here only include weather stations with real-time electronic reporting, which accounts for about two-thirds of the locations. Final numbers should be available later in August. The ever insightful Michael Tobis has an interesting perspective: As I saw somewhere today "100 is the new 90".
    0 0
  49. "100 is the new 90". Being generous (since lows warm more than highs) I would say 91.5 is the new 90 (at least in the US http://www.noaanews.noaa.gov/stories2011/20110629_newnormals.html The current 100's are mostly weather, helped along to some extent by AGW. The blocking high phenomenon behind the current extremes can be discussed on another thread, perhaps AGW-related but certainly debatable and too soon to see a trend.
    0 0
  50. Eric#99: "I would say 91.5 is the new 90" Well, that's something of a start. "The current 100's are mostly weather" OK, so I'll quote the rest of Tobis' posting: Climate change is always in the future. What we are seeing is merely weather. It is in the nature of Climate change that you can never observe it because only weather is observable. So everything is fine, Austin will never have a string of days over 110 F, and even when we do it will be a coincidence... That guy's a hoot.
    0 0

Prev  1  2  

You need to be logged in to post a comment. Login via the left margin or if you're new, register here.


The Consensus Project Website

THE ESCALATOR

(free to republish)


© Copyright 2024 John Cook
Home | Translations | About Us | Privacy | Contact Us