Climate Science Glossary

Term Lookup

Enter a term in the search box to find its definition.

Settings

Use the controls in the far right panel to increase or decrease the number of terms automatically displayed (or to completely turn that feature off).

Term Lookup

Settings


All IPCC definitions taken from Climate Change 2007: The Physical Science Basis. Working Group I Contribution to the Fourth Assessment Report of the Intergovernmental Panel on Climate Change, Annex I, Glossary, pp. 941-954. Cambridge University Press.

Home Arguments Software Resources Comments The Consensus Project Translations About Support

Bluesky Facebook LinkedIn Mastodon MeWe

Twitter YouTube RSS Posts RSS Comments Email Subscribe


Climate's changed before
It's the sun
It's not bad
There is no consensus
It's cooling
Models are unreliable
Temp record is unreliable
Animals and plants can adapt
It hasn't warmed since 1998
Antarctica is gaining ice
View All Arguments...


Username
Password
New? Register here
Forgot your password?

Latest Posts

Archives

Did Global Warming stop in 1998, 1995, 2002, 2007, 2010?

Posted on 27 December 2010 by villabolo

A common claim, made by those who deny man-made global warming, is that the Earth has been cooling recently. 1998 was the first year claimed by 'skeptics' for "Global Cooling". Then 1995 followed by 2002. 'Skeptics' have also emphasized the year 2007-2008 and most recently the last half of 2010.

NASA and climate scientists throughout the world have said, however, that the years starting since 1998 have been the hottest in all recorded temperature history. Do these claims sound confusing and contradictory? Has the Earth been cooling, lately?

To find out whether there is actually a "cooling trend" it is important to consider all of these claims as a whole since they follow the same pattern. In making these claims, 'skeptics' take short periods of time, usually about 10 years or less, out of context ("Cherry picked.") from 30 years of evidence; the minimum needed to make a valid judgment.

'Skeptics' also take selected areas of the world where cold records for the recent past are being set while ignoring other areas where all time heat records are being set.

The temperature chart below is based on information acquired from NASA heat sensing satellites. It covers a 30 year period from January 1979 to November 2010. The red curve indicates the average temperature throughout the entire Earth.

The red line represents the average temperature. The top of the curves are warmer years caused by El Niño; a weather phenomenon where the Pacific Ocean gives out heat thus warming the Earth. The bottoms of the curves are usually La Niña years which cool the Earth. Volcanic eruptions, like Mount Pinatubo in 1991 will also cool the Earth so they are not counted. Although they are affected by Global Warming, El Niños and La Niñas occur whether or not there is Global Warming.

Figure 1: University of Alabama, Huntsville (UAH) temperature chart from January 1979 to November 2010. This chart is shown with no trend lines so the viewer may make his own judgment.

Below is the same temperature chart, showing how 'skeptics', manipulate the data to give the impression of 'Global Cooling'. First, they choose the warmest most recent year they can find. Then, in this case, they exclude 20 years of previous temperature records. Next, they draw a line from the warmest year (The high peak.) to the lowest La Niña they can find. In doing this they falsely give the impression that an ordinary La Niña is actually a cooling trend.
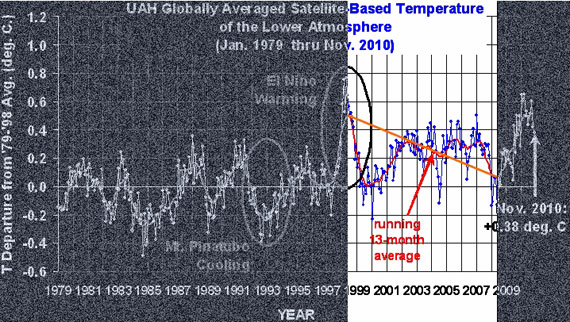
Figure 2: Representation of how 'skeptics' distort the temperature chart. Even though the chart clearly indicates increased warming, 'skeptics' take small portions of out of context to claim the opposite.

What do the past 30 years of temperature data really show? Below is the answer.
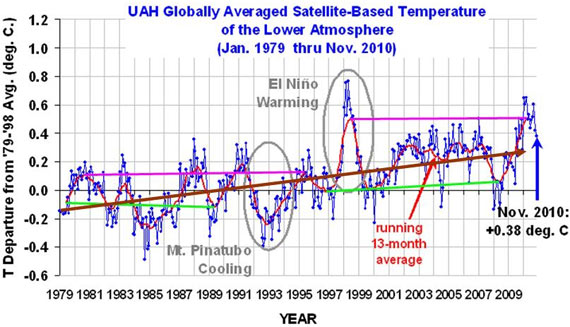
Figure 3: Trend lines showing the sudden jump in temperatures in the 1995 La Niña (Green lines) and the 1998 (Pink lines) El Niño events. Brown line indicates the overall increase in temperatures.

The chart above clearly shows that temperatures have gone up. They are, however, not going up in a steady curve as most people would expect. They are, instead, rising in a staircase fashion. That means they can remain flat for a few years and then suddenly jump up. Then once more they flatten out only jump up again a few years later.

When temperatures for the warm El Niño years (Pink lines) during 1980-1995 are compared to 1998-2010, there is a sudden increase of at least 0.2o Centigrade (0.36o Fahrenheit). Temperatures also jumped up by about 0.15oC (0.27oF) between the cool La Niña years (Green lines) of 1979-1989 and those of 1996-2008 (the eruption of Mount Pinatubo in 1991 lowered the Earth's temperatures in the midst of an El Niño cycle).The overall trend from 1979 through November 2010 (Brown line) shows an unmistakable rise.

While these increases do not sound like much they are more than enough to disrupt weather systems and cause severe damage to crops and human populations.

In spite of these facts, 'skeptics' simply keep changing their dates for 'Global Cooling'.

0 0

Printable Version  |  Link to this page

Comments

Prev  1  2  3  4  Next

Comments 101 to 150 out of 157:

  1. @BP: If temperatures are above average, there they are warmer. The use of the relative term for warmth is pretty useless in this context. You might feel that 0C is "cold", but for me 0C on Jan 1 is unusually warm (I live in Canada). Anyway, this is all useless, as we should talk about global averages rather than individual locations. Furthermore, I though contrarians no longer tried to claim the warming wasn't happening? In fact, I've had deniers swear to me no one seriously challenged the notion that the Earth was warming...and after that you wonder why we don't take you seriously? Give me a break...
    0 0
  2. @Argus: never mind, I didn't noticed you talk about daily highs, I though you meant averages. The link you provided clearly shows that average temperatures are around -6 to -7 (I was a bit too high, but my source wasn't as precise as yours, thanks!) "Are you serious? I was inundated by weather reports and weather maps from frantic so-called warmists" Oh, come on. Contrarians started with the cherry-picking, the only reason people gave counter-examples was to illustrate that cherry-picking. Don't lie in our faces and expect us to believe you.
    0 0
  3. @BP: "Currently it is colder than average everywhere, except in some regions where no one lives and where "warmer than average" is still damn cold." Actually, right now it is warmer than average everywhere, except in some heavily-populated areas. Of course, an area's population has *nothing* to do with whether or not the planet is warming. To insinuate otherwise is to indulge in a logical fallacy, which seems to have become your specialty as of late. There are 3 million people living in the Montreal area, and it is warmer than average. It is not 'cold', again an entirely subjective appreciation.
    0 0
  4. Taking both #86 and #73 together, we may learn quite a lot about outgoing IR radiation from the Arctic. However, this is not the best thread for further discussion of OLR; continuing with comment here.
    0 0
  5. @BP makes the unsubstantiated (and erroneous) claim that WV content is decreasing in the polar regions. Well, that is certainly not what the ERA-interim data show for the Arctic. From Screen and Simmonds (2010): "A final consideration arises from model simulations which suggest that changes in atmospheric water vapour content may amplify Arctic warming. Increases in water vapour are expected with increasing air temperatures and reduced sea ice cover. In turn, water vapour is a powerful greenhouse gas and can lead to further warming and sea ice loss. In ERA-Interim, specific humidity trends are found only during the summer and early autumn, and are confined to the lower part of the atmosphere (Fig. 4a). The largest humidity increases are found in the Arctic basin. An associated increase in incoming long-wave radiation has probably enhanced warming in summer and early autumn. It is of further interest to determine whether these increases in humidity are locally driven or are a result of increased moisture transport into the Arctic. It is worth noting that the humidity trends coincide with the months of lowest sea ice coverage and largest sea ice declines. The pronounced warming in winter and spring is not accompanied by increases in humidity. A large portion of each total humidity trend is linked to changes in sea ice (Fig. 4b) and, furthermore, to significant increases in the surface latent-heat flux (that is, evaporation) in the Arctic basin (Fig. 4a). The humidity increases at latitudes 50–65 N show weaker links to sea ice and are probably influenced by other processes. However, within the Arctic these lines of evidence support the notion that part of the humidity increase is driven by enhanced surface moisture fluxes associated with sea ice reductions".
    0 0
  6. Albatross - Thank you, that's what I thought. Arctic water vapor is increasing, not decreasing. Once again, BP has proposed a complex theory of negative feedback that will somehow prevent or limit global warming. And once again, it turns out to be contradicted by the data. Berényi - Arguing from complexity, which is how I (personal opinion) interpret your repeated attempts to propose fractal and critical point issues, does not do your arguments any favors. First: If there is unrecognized complexity affecting the climate system (which you have not established), it could vary in either direction, either reducing warming as you argue or actually increasing it with additional positive feedbacks. Second: Proposing (as you have on several occasions) hypotheses unsupported or even contradicted by the actual data, and that are hence incorrect hypotheses, leads to reader evaluation that you are "crying wolf", and that new inputs from you are not likely to be helpful.
    0 0
  7. KR, it is not complex at all. If weather on average creates a more uneven distribution of water vapor, then amplification of CO2 warming will be low or even nonexistent. The distribution of water vapor is what matters, not the average amount, whether Arctic or not. Heat works similarly. If lots of cold ends up in the temperate zones and heat in the arctic (e.g. by current negative AO), then that is "global cooling" or maybe just less amplification of CO2 warming. Conversely if air flow patterns are less meridional then there will be more amplification of CO2 warming. This is mostly because the dominant short term factor in earth average temperature is latent heat transfer. The other two are LW and albedo. Outgoing LW is obviously higher in BP's scenario that you linked. Albedo is not as clear (NPI), but a meridional pattern would indicate more clouds (cooling or warming) and more convection (generally cooling).
    0 0
  8. Eric (skeptic) - My "short answer" to BP's claims of a lowered Arctic humidity lie in the data; Arctic humidity is increasing, not decreasing. As to distribution, I will have to disagree most strongly with you. Small scale variations in WV distribution will affect small scale longwave radiation (LR) values; but our satellite measurements of OLR provide large scale values - and it's the global OLR that determines radiation balance. Having worked with fractal systems before, I will point out that once you are looking at a system from sufficient distance, whatever fractal nature is inherent in the system can be accurately dealt with as a parametric evaluation for statistical summary. In addition (as I found your less amplification statement a bit confusing): CO2 warming is extremely smooth on a global scale - local variations of CO2 are of very small values. The WV feedback is driven by CO2, but is an addition based upon CO2 values, not an amplification - the CO2 signature is quite significant in and of itself. Even in the driest conditions, a lack of water vapor will not cause the CO2 forcing to drop to lower values. Lastly, "Outgoing LW is obviously higher in BP's scenario that you linked: - quite true. It's also higher due to Arctic amplification - with the Arctic several degrees warmer than it used to be. If BP is claiming that the OLR from the Arctic is larger than could be expect from actual surface temperatures due to atmospheric window effects, he's going to have to run some numbers and data and prove it. It's certainly not what's been observed by people doing the work.
    0 0
  9. Eric: "KR, it is not complex at all. If weather on average creates a more uneven distribution of water vapor, then amplification of CO2 warming will be low or even nonexistent. The distribution of water vapor is what matters, not the average amount, whether Arctic or not" Actually, it's observations that shoot the "weather will save us" hypothesis down. Too bad, eh?
    0 0
  10. #107: "Outgoing LW is obviously higher in BP's scenario that you linked." Doesn't that mean the 'scenario' is incorrect? Read the comment, look at the data. "Albedo is not as clear" Albedo? In the Arctic, in winter? It's dark; there's nothing to reflect.
    0 0
  11. #99 dhogaza at 07:06 AM on 2 January, 2011 Yesterday was 6 degrees warmer than average in NY City, and a couple of days ago it was well above average in London. Obviously he's never been to NYC or London, or else he wouldn't make the outrageous claim that "no one lives there". We are talking about December, 2010, don't we? For most of this month temperatures ran well below average in both NYC & London, you can check it. And yes, in those parts of the globe where monthly average temperatures were high above normal, that is, Northern Canada, South Eastern Greenland & Eastern Siberia, including Kamchatka (almost) no one lives. It explains the general perception of the last month of last year being one of the coldest on record. And now... meet your strawman. BTW, I happened to live in both cities you've mentioned and noticed crowds there. A Happy New Year!
    0 0
  12. #108 KR, the radiation balance (see daily global average temperatures: http://discover.itsc.uah.edu/amsutemps/) changes sign every few days down to one or two times a month. The problem is we cannot look at the system from a "sufficient distance" (e.g. monthly averages balances) yet see the changes that matter. For example, November brought us negative NAO which caused two things: the redistribution of heat and (part of the) net global cooling. December had several smaller episodes with no net effect (or was offset by other areas of the globe). Redistribution may not change the balance much, but the cooling that follows does. La Nina also had an impact on November temperatures but it is not a correct assumption that all the variation in GAT came from La Nina. For one thing La Nina doesn't change that often. In this particular case our La Nina leveled off in November after an initial steep drop. We're not in super La Nina territory by any stretch http://www.cpc.noaa.gov/products/analysis_monitoring/ensostuff/ensoyears.shtml The bottom line is that the short term cooling had a weather component along with La Nina. #109 dhogaza, which observations? Weather partly saved us in November and December. The albedo increased (snow in Europe and N. America, low clouds over the Atlantic), OLR increased (arctic warmth, more low clouds). Right now weather is not saving us (zonal flow with none or less of the above). One of the theories of AGW is that weather won't save us because CO2 will warm the arctic more and lower the amount of meridional circulation which is a positive feedback. The recent blocking negated that effect. #110 muoncounter, yes, no sun, no albedo, I was thinking beyond the Arctic.
    0 0
  13. @Berényi Péter #111 "It explains the general perception of the last month of last year being one of the coldest on record." General perception where? London and NYC, I presume. Define "general". Why don't you let Kamchatka aside and link the other 23 megacities in the world? We are 450 million people living there. Crowded enough? You'll be surprised.
    0 0
  14. Berényi Péter, #95, Thanks for the link to the British climate prediction (snowfalls-are-now-just-a-thing-of-the-past), written some ten years ago! Little did they know. Parts of it were hilarious read, in the light of this winter. Some quotes: - According to Dr David Viner, ... within a few years winter snowfall will become "a very rare and exciting event". - "Children just aren't going to know what snow is," he said. - Professor Jarich Oosten ... says that even if we no longer see snow, it will remain culturally important. - David Parker ... says ultimately, British children could have only virtual experience of snow. Via the internet, they might wonder at polar scenes - or eventually "feel" virtual cold.
    0 0
  15. #111: "parts of the globe where monthly average temperatures were high above normal, ... (almost) no one lives." But this is bizarre; a kind of reverse UHI? If it matters, here's a place where 1.22M people live. San Diego: December was wetter, warmer than normal Isn't arguing about how one month's weather was 'perceived' completely irrelevant? The broader pattern remains intact: an anomalously warm year ending an anomalously warm decade. Whether you think December where you lived was warmer or cooler than usual, it certainly was wet (including snow). And there is ample reason, consistent with a warming environment, for more atmospheric moisture in the early winter. See: lake effect snow.
    0 0
  16. Hi, michael sweet (#96): "Argus, I am still waiting for your to produce data on a location that is colder than average. Hot locations support my position that it is still warming." I am not sure of what this dispute is about. I still maintain that it has been unusually cold in most of Europe, most of Siberia, in Alaska (and Eastern U.S.). See the map in #51! That's a lot of locations. Or do you just mean Greenland? I certainly agree that, at the same time, it has been an unusually mild December on the south-eastern coast of Greenland, especially. What I wanted to oppose was the erroneous picture of Greenland having +14 C every day. When I looked, the daily highs on that coast were about -5 to +5. Also, I do not trust your German maps that show "a high of 13C for Greenland". First, it is just in one isolated spot. Second, these numbers of joy do not agree with the Danish/Greenland weather site. (see: http://www.dmi.dk/dmi/) I still think that December will show to be cold.
    0 0
  17. Argus, #114: "Thanks for the link to the British climate prediction (snowfalls-are-now-just-a-thing-of-the-past), written some ten years ago! Little did they know. Parts of it were hilarious read, in the light of this winter." They would be wrong, as a short term prediction (i.e. temporarily), not because their general concept of Global Warming is wrong, but because they were unaware of what the severe NAOs would do and, of course, to the uneducated public's general perception that their backyard is the whole world. There is nothing 'hilarious' in the longer term; still within the lifetime of children 10 years ago; when the Arctic Ice Cap meltdown gets to the point where the Artic will be mostly open water during the summer*. Winters will be shortened, perhaps warmer and even more severe (If Super NAOs become a semipermanent feature.). Summers will be worse still with the Arctic Ocean's drastically changed albedo boosting water temps by 3-5C. It will then become obvious to even 'skeptics' that the climate will be that of extremes (I'm sure that their rationalization 'du joure' would be 'Natural Global Warming' with a revisionist history of "we told you all along".). There will be nothing hilarious to the children of ten years ago, or their children, as they get repeatedly flooded with rains and buried in warm wet snow year after dreary year. Briefly put, Argus, is that; little do you know; parts of this thread will, in the future, make a hilarious read in light of the next [winter] 20 winters. * Predictions are that the Arctic Ocean will be ice free in the summer anytime from 2020 to 2030; for a few days at first, then weeks and months in subsequent years. These predictions do not take into account the effect of NAOs diminishing winter ice build up. That, of course, will accelerate summer ice loss. This makes NAO another feed back loop that has not been taken into account. 2020 to 2030 for ice free summers may actually be 2016 to 2020.
    0 0
  18. #117: "Winters will be shortened, perhaps warmer and even more severe" Some interesting observations from Jun 2010. There really is a consistent theme, as also reported here: Polar heat pushing jet stream south, bringing harder winters for U.S./Europe/Japan Climate change has warmed the entire Arctic region, melting 2.5 million square kilometres of sea ice, and that, paradoxically, is producing colder and snowier winters for Europe, Asia and parts of North America. This huge mass of warmer air over the Arctic in the late fall not only generates more wind and snow locally, ... altered normal wind patterns, pushing the jet stream further south and bringing arctic cold to much of Eurasia and Japan. In eastern North America, the same conditions of 2007-8 produced increased precipitation and colder temperatures in the winter.
    0 0
  19. Eric (skeptic) - A question of clarification, if you please. Do you mean that monthly averages over large areas are (a) insufficient information to determine radiative balances, or (b) we are incapable of measuring such averages? I thought we were doing a decent job of measuring the averages, through satellite observations and confirmatory surface back-radiation measurements. And I cannot understand arguing that long term regional averages are inappropriate to measure long term climate.
    0 0
  20. archiesteel, #102: "Contrarians started with the cherry-picking, the only reason people gave counter-examples was to illustrate that cherry-picking. Don't lie in our faces and expect us to believe you." I have gone through the history of this thread, and the first uses of cherry-picking temperatures that I can find, are from dhogaza (#24 and #32). After that I gave some counter-examples.
    0 0
  21. villabolo #116, and muoncounter #117, That's roughly what I meant: "colder and snowier winters for Europe, Asia and parts of North America", And they thought they'd never see snow again in England... Climate is hard to predict.
    0 0
  22. Argus, "and the first uses of cherry-picking temperatures that I can find, are from dhogaza (#24 and #32)." Let us regroup here and go back to this claim made @19 "An all time record cold spell in Europe, however, is worth nothing" Actually, it was this comment made by Argus and his/her strawman accusation of "warmists" cherry-picking which started the whole "cherry-picking" fiasco. And for the record, those who know dhogaza know that he was being sarcastic when he made his alleged "cherry-pick". Both you, Argus, and BP have made several claims that have been demonstrated to be patently false. What do you then do-- move the goal posts or continue with yet more gish-gallop. This behaviour by you and BP is now bordering on trolling, and I would not be surprised if John or someone else has to clean up the mess left on this thread by you guys over the next couple of days Please stop with the gish-gallop (feel free to go to another forum if you want to do that), and please remind yourselves what the topic of this thread is about. I'll help: BP and Argus and fellow "skeptics": "Has anthropogenic global warming stopped (and by that I do not mean slowed down). If so, when exactly? If claiming that is has, please back up your claims with some science, data or statistics.
    0 0
  23. Re Argus @90, Just a quick follow up. BP's post @73 was directed at Archiesteel. My post @85 was not made directly in response to BP's post@73-- I should have been clear about that. Anyhow, as it turns out I have corrected two claims made by BP in 73. Specifically, I corrected his erroneous claim about the globe being cooler than average in December @85 (made before your whining @90). And his erroneous claim about the alleged decrease in WV over the Arctic being "depleted fast" was corrected @105. Other posters have also dealt with erroneous/misleading claims made by BP @73 and elsewhere. And maybe it is time for those in denial about AGW, such as you, to ponder this figure of global temperatures: One has to be a hard core denialist (including things that I cannot say here) to be trying to argue that the globe is cooling in one of (if not the) warmest years on record. Really the desperation of the wannabe skeptics is truly pathetic and mind boggling.
    0 0
  24. KR, if outgoing LW and SW (albedo) is captured on the time scale shown in the link in #112, then averaged over the month and the earth, the balance could tell us how much energy the earth gained month to month. We would be able to answer dhogaza's question "did weather save us" for that month. I don't know of any study that has done this over a decade or two and compared the results to OHC changes. I wouldn't be surprised if someone has and I would like to read it. My point in #107 was that the distribution of water vapor determined the radiative balance, not the average. If the average goes up, it will be more likely to capture outgoing LW, but only to the extent that it is evenly distributed. If it is uneven, such as what we see in blocking patterns (stationary lows and instead of a stronger but fixed latitude jet stream) then outgoing LW will be more likely to escape. In Screen and Simmonds (2010), they seem to be using averages for 1.5 degree concentric circular strips. There is no doubt about the summer increase in humidity and associated summer and early fall increase in incoming LW. Of course their use of averages for that analysis makes my evenness point moot. It doesn't address the other seasons (no increase in humidity in that study) nor the effect of weather patterns (on evenness).
    0 0
  25. #122 Albatross, my view comes from BP's repetitive claim that OHC has stopped increasing with the main objection that it is too short a time period. OTOH, there is often a claim made that with a quiet sun we should be seeing cooling and we are not (likewise too short a time period). I put those together and conclude that the ocean is releasing stored heat to create part of the temperature increase. Or even more to your question, AGW from GHG continues as usual to create the observed temperature increase while the release of stored heat is offsetting the "quiet sun". Of course that is not quantitative because it is very hard to quantify the solar magnetic effects and the effects of the full solar spectrum on weather patterns.
    0 0
  26. Eric, in a seemingly hopeless effort to keep this thread on track. Could you please also answer the question @122 which I directed at Argus and BP. Thanks. If people wish to discuss OHC and Arctic amplification or negative feedbacks then people can go to the appropriate threads-- as will I.
    0 0
    Moderator Response: Thank you for trying to wrangle this thread back on topic. Deletions might begin soon on this thread.
  27. @Argus: my bad, you didn't start with the cherry-picking. You did, however, make a strawman argument that "warmists cherry-pick all the time," which is complete bull. Contrary to deniers, who cherry-pick temperature records and use these as evidence AGW is false, people who understand the science will not use record highs as evidence supporting AGW. Rather, they will (correctly) point out that such temperature records are *consistent* with AGW theory. There is an important difference, here, although I'm afraid it will be lost on those who long ago decided they didn't believe in global warming... The fact you believe dhogaza was cherry-picking in the two comments you referred to clearly shows you have no idea what you're talking about - just like back on digg. Why not actually try to learn some genuine science instead?
    0 0
  28. Argus, Albatross beat me to the reference to your wild claim @19 "An all time record cold spell in Europe, however, is worth nothing". You have not provided a single location where this winter has set any record at all, much less an all time record cold December . I have produced data on anomalies of +20C. The data at 51 show normal winter temperatures: it is December. You should admit you have no data that shows record cold, since you have not produced anything except unusually hot weather data. See these pictures of people ice skating on the Thames river for a cold year, it is much too warm to do that this year. "Skeptics" like to compare the weather to the past decade- the warmest ever recorded- and claim it is cold because it was not the warmest ever. Produce some data that supports your position or stop wasting my time with your absurd claims.
    0 0
  29. Albatross, we must have crossed posts. I will find a more appropriate thread for the other discussion.
    0 0
  30. @BP: "And yes, in those parts of the globe where monthly average temperatures were high above normal, that is, Northern Canada, South Eastern Greenland & Eastern Siberia, including Kamchatka (almost) no one lives. It explains the general perception of the last month of last year being one of the coldest on record." So many errors in just one paragraph, it makes me think BP has sunk to RSVP's level. Sad. First, your list of places where monthly average temperatures were above normal is longer than what you've indicated. For starters, even in southern Canada (which is far from empty) temperatures are above normal. Almost 15C higher than normal here in Quebec City. Other places you could have mentioned: the western US, southern Europe, Africa, the Caucasus, the Philippines, South America...all places where no one lives, right? The fact there was a "general perception of cold" is irrelevant. What matters is the scientific reality...perhaps you should start trying to figure that out before continuing to write such nonsense.
    0 0
  31. Eric,@129, indeed we did :)
    0 0
  32. Eric @129, For the record, would you mind please answering my question @122 here. Thanks.
    0 0
  33. Eric (skeptic) - The data is available; twice daily outgoing radiation from pretty much every spot on earth. Longwave radiation values are also available from other resources, such as IRI here. As to distribution versus averages - When Trenberth 2009 updated his outgoing IR from 390 (1999 values?) to 396, it was due to the local variances and the T^4 relationship increasing the estimated IR. But if you are measuring OLR from a satellite, that's a measurement, not an estimate. We're measuring the totals. Given the current state of the art and consensus of climate science, I think the Burden of Proof is on the skeptic side here. If you feel that low scale variances in water vapor distribution are increasing OLR radiation to point of providing a significant negative feedback - well, take the data and show it. But (getting back to post #73, which I had originally responded to) - unsupported and erroneous assertions of lower Arctic humidity are a lousy scientific argument.
    0 0
  34. #121: "roughly what I meant: "colder and snowier winters ... " Thank you for roughly agreeing; the linked article states that the cause of the those deeper winter conditions is the Arctic melt. Of course, if you play that tape forward a decade or two, all that open water in the Arctic summer will absorb plenty of heat --- that'll be nice vacationing.
    0 0
  35. Albatross, this question? "Has anthropogenic global warming stopped (and by that I do not mean slowed down). If so, when exactly?" Has not stopped.
    0 0
  36. Eric @135, thanks. OK, good to hear that you agree.
    0 0
  37. Nope, still hasn't stopped: Courtesy of Tamino And the monotony goes on... The Yooper
    0 0
  38. #137: Yooper, I am shocked and disappointed. Showing a graph in which one point is by itself, not connected to all the others? As if to draw the viewer's attention to that point? Clearly a cherrypick. And since its obviously above the 'trend', it must be an ella NinoNinaPDOAOAMOSDI anomaly. Due to blocking. Or cosmics. Or UV. Or ocean heating or lack of ocean heating. Or excess WV and low clouds. Or lack of WV and high clouds. Or all those football fans tailgating, cooking up BBQ wings in stadium parking lots. Why just cherrypick one reason, must be all of 'em put together!
    0 0
    Moderator Response: [Daniel Bailey] SDI? Strategic Defense Initiative? Or something more sinister?
  39. Re: muoncounter (138) And the best part is: it's a cherry-red dot... I so loved cherry-pickin' time growin' up... The Yooper
    0 0
  40. Thanks for the link @137 Daniel. Reading that led to this interesting graphic from CCE: Yup, still warming....but global SATs will no doubt be cooler for 2011, and then the whole "it is cooling" denier meme will have to be whacked again.
    0 0
    Moderator Response: [Daniel Bailey] Yup, Ron Broberg over at the Whiteboard has put up a series of those (here). See his post here for more details plus the ultra-cool Snoopy ditty.
  41. archiesteel #127: You did, however, make a strawman argument that "warmists cherry-pick all the time," What good does it do in a debate to invent false quotes? The only thing remotely similar to your fabricated quote, which I did write (partly borrowing wordings from the top post), was "that 'warmists' also frequently take selected areas of the world where heat records for the recent past are being set, while ignoring other areas where cold records are being set".
    0 0
  42. michael sweet, #128: "The data at 51 show normal winter temperatures: it is December. " The graph at 51 shows anomalies. Blue means considerably lower than normal. What you asked for in #82 was "data on a location that is colder than average." michael sweet, #128: "You have not provided a single location where this winter has set any record at all" Here are a few assorted records for you: - Stockholm, Sweden, longest continuous cold spell since the winter of 1788-1789. Also coldest November temp. since 1884 (-18) - Åland (autonomous part of Finland): all-time low (set on Nov 29) -18,9. - Germany record cold in November: 3-5 degrees Celsius below the long-term averages. - "Both Wales and Northern Ireland recorded the coldest November night since records began. In Wales, temperatures fell to -18.0 °C at Llysdinam, near Llandrindod Wells, Powys. Northern Ireland recorded -9.5 °C at Loch Fea." - December 20, all-time low in Northern Ireland (-18°C). - "Christmas Day is the coldest ever with mercury plummeting to - 18 as UK heads towards the biggest December freeze since 1890." / "December is the coldest across the UK since the national series began in 1910." (Pick one!) - The coldest December on record for the main climate sites in South Florida. (According to 'The National Weather Service'). P.S. This is not cherry-picking - I was asked to provide data!
    0 0
  43. @Argus #142 So, do you think that many instances of record cold in 100 years or unprecedented cold are not evidence of global warming or compatible with global warming?
    0 0
  44. FWIW, the RSS data for December 2010 have been released. Global anomaly for TLT (lower troposphere) was +0.251 C. The UAH lower-tropospheric global anomaly was +0.18 C. So much for BP's suggestion that global temperatures were below average in December 2010. Spencer also says that 2010 and 1998 are in a statistical tie for warmest year in the UAH record. For comparison, here are the RSS December anomalies going back to 1998. Note, the RSS product doe not extend north of 80N and south of 72.5 S. Annual values are in parentheses. 1998: +0.312 (+0.55) 1999: +0.116 (+0.09) 2000: +0.008 (+0.08) 2001: +0.292 (+0.24) 2002: +0.236 (+0.33) 2003: +0.487 (+0.36) 2004: +0.166 (+0.25) 2005: +0.219 (+0.37) 2006: +0.334 (+0.28) 2007: +0.096 (+0.31) 2008: +0.172 (+0.09) 2009: +0.243 (+0.26) 2010: +0.251 (+0.51) Remarkably, the global RSS anomaly for December 2010 was higher than that for December 2009 despite the moderate/strong La Nina event developing in the early summer of 2010 and despite the PDO being strongly negative since July 2010.
    0 0
    Moderator Response: [Daniel Bailey] You may be interested in David B. Benson's decadal temperature prediction over at RC in October then.
  45. Argus, It is good to see you finally produce some data that we can review. Can you provide links to the data, at least three appear to be newspaper reports (the last two especially), not actual data. (I live in Florida and while it has been below average in December, it has not been record cold). You have found a few sites where it has been cold this winter. I doubt that it will be "An all time record cold spell in Europe" as you claim. A few cold nights in Ireland and Sweden are not a record cold spell in Europe. Germany did not rate a mention in November in the NCDC report and on their dot map of world temperatures Germany is shown as warmer than usual. From the NCDC November report: "The most notable warm anomalies around the world during November 2010 occurred across the northern high latitudes, including Alaska and a large swath of Canada and encompassed most of Europe and Asia. The coolest anomalies were seen over Scandinavia, most of Australia, and the eastern and central Pacific Ocean." It was not "record cold" in most of Europe during November, it was unusually warm. Perhaps Europe will get a mention for its December temperatures. We should wait for the GISS and the NCDC yearly and December summaries to come out. GISS usually comes out around the 10th and NCDC around the 17th of the month. NCDC will mention cold spots around the globe and say how they compare to past records.
    0 0
  46. Re: Albatross (144) Good thing Ma Nature's had Her foot on the brake, then (do you smell brake pads wearing out?). 2011 is the year the foot comes off da brake and onto the accelerator in 2012. A good run while we had it. On the plus side, instead of heading south for spring break I can save money & just stay at home... The Yooper
    0 0
  47. Daniel @146, Yes, 2012 is going to be an interesting year. The 2011 Arctic melt season could also be interesting given the current low ice volume and extent. Warning signs everywhere that the break pads are wearing out quickly ;) An yet here we are "debating" those in denial about AGW. Sadly, I suspect others will be doing so circa 2050 and beyond. Thanks for the like to David Benson's model-- so far it is working out pretty well, as are Arrhenius's estimates of global SAT.
    0 0
  48. #144: "Spencer also says ... " "the Northern Hemisphere also cooled in December, more consistent with the anecdotal evidence. :) " That's his cute little smiley face. He'd do better with these faces to back up his anecdotes. Yooper, I'm heading north.
    0 0
  49. Florida had numerous record low average temperatures in December, but no extreme cold. For example, Tampa was about 10 degrees below average at 53.2 breaking the old record of 54.5 (Dec 1935). It was interesting that no daily records were broken during the month (in Tampa). It just reached 32 twice (the all time low for December is 18 in 1962).
    0 0
  50. Re:muoncounter (148) "Spencer also says ... " I'll play: "The noblest mind the best contentment has." Come on up. Superior'll be like bath water soon... Thee Yooper
    0 0

Prev  1  2  3  4  Next

You need to be logged in to post a comment. Login via the left margin or if you're new, register here.


The Consensus Project Website

THE ESCALATOR

(free to republish)


© Copyright 2024 John Cook
Home | Translations | About Us | Privacy | Contact Us