Climate Science Glossary

Term Lookup

Enter a term in the search box to find its definition.

Settings

Use the controls in the far right panel to increase or decrease the number of terms automatically displayed (or to completely turn that feature off).

Term Lookup

Settings


All IPCC definitions taken from Climate Change 2007: The Physical Science Basis. Working Group I Contribution to the Fourth Assessment Report of the Intergovernmental Panel on Climate Change, Annex I, Glossary, pp. 941-954. Cambridge University Press.

Home Arguments Software Resources Comments The Consensus Project Translations About Support

Bluesky Facebook LinkedIn Mastodon MeWe

Twitter YouTube RSS Posts RSS Comments Email Subscribe


Climate's changed before
It's the sun
It's not bad
There is no consensus
It's cooling
Models are unreliable
Temp record is unreliable
Animals and plants can adapt
It hasn't warmed since 1998
Antarctica is gaining ice
View All Arguments...


Username
Password
New? Register here
Forgot your password?

Latest Posts

Archives

Did Global Warming stop in 1998, 1995, 2002, 2007, 2010?

Posted on 27 December 2010 by villabolo

A common claim, made by those who deny man-made global warming, is that the Earth has been cooling recently. 1998 was the first year claimed by 'skeptics' for "Global Cooling". Then 1995 followed by 2002. 'Skeptics' have also emphasized the year 2007-2008 and most recently the last half of 2010.

NASA and climate scientists throughout the world have said, however, that the years starting since 1998 have been the hottest in all recorded temperature history. Do these claims sound confusing and contradictory? Has the Earth been cooling, lately?

To find out whether there is actually a "cooling trend" it is important to consider all of these claims as a whole since they follow the same pattern. In making these claims, 'skeptics' take short periods of time, usually about 10 years or less, out of context ("Cherry picked.") from 30 years of evidence; the minimum needed to make a valid judgment.

'Skeptics' also take selected areas of the world where cold records for the recent past are being set while ignoring other areas where all time heat records are being set.

The temperature chart below is based on information acquired from NASA heat sensing satellites. It covers a 30 year period from January 1979 to November 2010. The red curve indicates the average temperature throughout the entire Earth.

The red line represents the average temperature. The top of the curves are warmer years caused by El Niño; a weather phenomenon where the Pacific Ocean gives out heat thus warming the Earth. The bottoms of the curves are usually La Niña years which cool the Earth. Volcanic eruptions, like Mount Pinatubo in 1991 will also cool the Earth so they are not counted. Although they are affected by Global Warming, El Niños and La Niñas occur whether or not there is Global Warming.

Figure 1: University of Alabama, Huntsville (UAH) temperature chart from January 1979 to November 2010. This chart is shown with no trend lines so the viewer may make his own judgment.

Below is the same temperature chart, showing how 'skeptics', manipulate the data to give the impression of 'Global Cooling'. First, they choose the warmest most recent year they can find. Then, in this case, they exclude 20 years of previous temperature records. Next, they draw a line from the warmest year (The high peak.) to the lowest La Niña they can find. In doing this they falsely give the impression that an ordinary La Niña is actually a cooling trend.
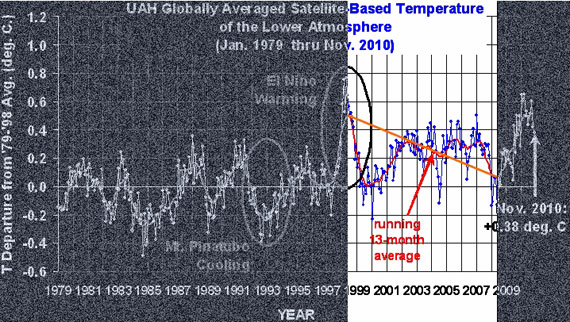
Figure 2: Representation of how 'skeptics' distort the temperature chart. Even though the chart clearly indicates increased warming, 'skeptics' take small portions of out of context to claim the opposite.

What do the past 30 years of temperature data really show? Below is the answer.
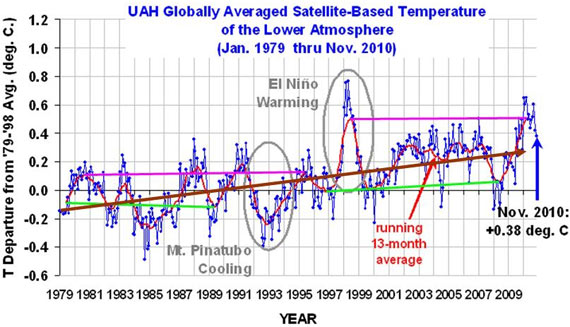
Figure 3: Trend lines showing the sudden jump in temperatures in the 1995 La Niña (Green lines) and the 1998 (Pink lines) El Niño events. Brown line indicates the overall increase in temperatures.

The chart above clearly shows that temperatures have gone up. They are, however, not going up in a steady curve as most people would expect. They are, instead, rising in a staircase fashion. That means they can remain flat for a few years and then suddenly jump up. Then once more they flatten out only jump up again a few years later.

When temperatures for the warm El Niño years (Pink lines) during 1980-1995 are compared to 1998-2010, there is a sudden increase of at least 0.2o Centigrade (0.36o Fahrenheit). Temperatures also jumped up by about 0.15oC (0.27oF) between the cool La Niña years (Green lines) of 1979-1989 and those of 1996-2008 (the eruption of Mount Pinatubo in 1991 lowered the Earth's temperatures in the midst of an El Niño cycle).The overall trend from 1979 through November 2010 (Brown line) shows an unmistakable rise.

While these increases do not sound like much they are more than enough to disrupt weather systems and cause severe damage to crops and human populations.

In spite of these facts, 'skeptics' simply keep changing their dates for 'Global Cooling'.

0 0

Printable Version  |  Link to this page

Comments

Prev  1  2  3  4  

Comments 151 to 153 out of 153:

  1. #150: I don't see the good Dr. as the noblest mind; "That cursed man, low sitting on the ground, Musing full sadly in his sullein mind." But I was wondering who would be his Hawk.
    0 0
  2. Re: muoncounter (151) Artegal = Mann Archimago = McIntyre Braggadocchio = Monckton (apropos) Redcross = Hansen Talus = Tamino The Blatant Beast = Watts (very apropos) The Yooper
    0 0
  3. Argus wrote : "It seems that the the vast majority of so-called warmists are also male, so what was it you were trying to hint at? Please elaborate!". I don't know what you imagine the word 'warmists' means (it seems to mean different things to different so-called skeptics, depending on which particular urban myth/so-called skeptical argument they are putting forward at any particular time - often in contradiction to their previous argument), but those in opposition to the so-called skeptics (or deniers) are the vast majority of scientists and other rational thinking people - up to half of whom are women. I am pleased to be a part of that mixed community, as opposed to the community of so-called skeptics (or deniers), the vast majority of whom are male, middle-aged (or above) and of a right-wing persuasion. But each to his own...
    0 0
    Moderator Response: [Daniel Bailey] It is perhaps best to avoid such labels altogether and to think of it thusly: There are those who prefer to focus on what is the best explanation for what all of the data shows, using the scientific method. And there is everyone else. Then there's no danger of running afoul of the Comments Policy.
  4. Hello, Is the year average of 2010 already published?
    0 0
    Moderator Response: [Daniel Bailey] See the last paragraph of Michael Sweet's comment here.
  5. #143 Alec Cowan, I have no response to that - I was just challenged to produce some data. #145, michael sweet, As for links, I think it's too much work to edit complete link information to all items, with the current comment posting system. You can google like I did - you should have enough search keywords/key figures. Since you live in Florida I can give you the Florida link directly (cut in two parts): http://voices.washingtonpost.com/capitalweathergang/2010/12/ coldest_december_on_record_in.html The UK stuff came from: http://en.wordpress.com/tag/record-cold/ The Åland item is in Swedish: http://www.abounderrattelser.fi/news/2010/12/nytt-koldrekord-pa-aland.html
    0 0
  6. JMurphy 153, I just made a guess that most of those who are active on this website (and who seem to share the exact same convictions) are, or at least seem to be, male, judging from their names and the way they write. It is interesting that you have such exact sociological data on those you categorize as skeptics/deniers. What is the source of that?
    0 0
  7. @Argus #155 "Alec Cowan, I have no response to that - I was just challenged to produce some data." I think you were challenged to make some sense before of that. I fail to understand the purpose of your comments #19, #43, #64, #74, #78, #80, #89, #90, #92, #93, #94, #114, #116, #120, #121, #141, #142 (and counting). There's a lot of things going on there but all seems to be summarized in "hey, hey, look this", "I don't like what you are saying", and probably some pleasure of getting +50 replies to your comments. Can you state your point in a nutshell (be aware I don't even use your 'scientifically') provided you can't even answer #143.
    0 0
  8. Berényi Péter wrote : "It is predicted, indeed. The only problem is warm snow, unlike the one we are having, is called rain." Why do some people prefer newspaper reports of comments by scientists ? Couldn't you find a newspaper report of a paper which suggests what you are hoping to show ? Berényi Péter wrote : "Let's be a bit more specific. Currently it is colder than average everywhere, except in some regions where no one lives and where "warmer than average" is still damn cold." "Let's be a bit more specific" without actually specifying anything in particular ? Right Berényi Péter wrote : "Now, that's preposterous. You should immediately provide peer reviewed references to support this abominable insinuation." My last off-topic comment on this : if you'd read the article, you would have seen that the study in question is being peer-reviewed prior to publication. I wonder if you will still call it an "abominable insinuation" then ?
    0 0
  9. Argus wrote : "It is interesting that you have such exact sociological data on those you categorize as skeptics/deniers. What is the source of that?" So as to not go any more off-topic, or into controversial labels, here are a few links for anyone who wishes to do their own research into those who are into anti-AGW : ExxposeExxon Wikipedia 'Climate Change Denial' Wikipedia 'Opposing scientists' Wikipedia "List of Climate Scientists' Wikipedia 'IPCC WG1 authors Wikipedia 'Merchants of Doubt' IPCC AR5 WG1 Authors It is very easy to work out from those simple links (which lead to loads more) what political persuasions are represented, how many women are involved in this field and how many of them are so-called skeptics.
    0 0
  10. BP and Argus, Please stop obfuscating, arguing strawmen and disrupting this thread and answer this pertinent question here. Thanks.
    0 0
  11. Alec Cowan 157, - I am rather touched by seeing the effort you have put into finding all my comment numbers. I don't know why you bother asking for an answer from me about #143, but (providing I understand the question correctly) my answer is: instances of record colds do not form evidence of global warming, nor do they form evidence of global cooling. Record highs and record lows are both perfectly compatible with global warming. Albatross 160, - So what is this thread about? What is pertinent? I haven't seen many significant contributions from either side in this thread. As for your earlier question in #122 - ("Has anthropogenic global warming stopped (and by that I do not mean slowed down.) If so, when exactly?") - I believe in AGW, and there is no hard evidence yet that it has either stopped or slowed down, (but I am hoping that it will slow down, and looking at some curves and other diagrams presented, I can sometimes see reasons for hope in the latest decade). I think the purpose of these two rather aggressive and hostile comments must be to get rid of all opposition, so that everybody here agrees about everything. But what then would you debate about, with whom, and why? Anyway, I am out of here.
    0 0
  12. @Argus #161 If that's your position -which I can't share with intellectual honesty- there's still the matter of what argumentation are you trying to do with this long thread of comments to this post. It all looks fuzzy, like a bunch of examples of heights and lows that should make somebody think that while the sound of clanging may be heard, there's still a possibility to win some kind of battle. I prefer you to explain it, but we could also start a careful analysis of what you wrote here.
    0 0
  13. Arus@160, "I believe in AGW, and there is no hard evidence yet that it has either stopped or slowed down," Thanks for answering the question. It appears to me though that your posts here are not consistent with that position. Also, as Alec points out @162, until now it has been incredibly difficult to determine exactly what your position is. "I think the purpose of these two rather aggressive and hostile comments must be to get rid of all opposition, so that everybody here agrees about everything" I save us the "surprise" at the alleged "aggressive" comments-- a perusal of this thread shows that you are not innocent in all this. It is no wonder that people have grown extremely tired of playing the same game of whack-a-mole with contrarians over the years. In fact, people here have been tolerant of your posts, and you have made many posts. All we ask is that you bring some constructive and substantive to the table. Requesting that is not unreasonable. And nobody has been trying to "get rid of all opposition". Early in your post @161 you agreed that AGW has not stopped or slowed down (on that we agree), and yet, later in the same post you claim that SS is trying to get rid of 'opposition'. How can SS posters like me be guilty of that when (a) you are allegedly in agreement regarding the topic of this thread (i.e., there is actually no opposition), and (b) when you have had the opportunity to post so many comments? "But what then would you debate about, with whom, and why? Anyway, I am out of here. Healthy (and oftentimes vigorous) scientific debate continues daily in coffee rooms, journals, talks, and at conferences. You, on the other hand, seem to be here solely for the sake of arguing because some has to. That is not constructive debate. Pick your battles, but be prepared to back up your assertions with data, science and the scientific literature.
    0 0
  14. Hi, On the CNN website there is an intersting (and popularized) artcle about the GW and the slight decrease of warming speed the last decade. case for man made warming increased in 2010, scientist say Next to the aerosols and water vapor they mention, it's also a fact that the sunspot cycle went downwards the last 10 years, so even if this is a small influence it might also slow down the heating (until it goes up again of course). solar cycle data
    0 0
  15. @stefaan #164 Be careful when speaking about the Solar Cycle. The data you linked to is of course correct, but it runs out in 2005. If you want more detailed information that Wikipeadia gives, could I please direct you to credible sources. http://solarscience.msfc.nasa.gov/SunspotCycle.shtml http://www.spaceweather.com/ http://www.solarstorms.org/ http://www.nswp.gov/ Over the last couple of years the Sun was at the minimal phase of the 11yr solar sunspot cycle, and it has been the most inactive since the 1850's according to some researchers, other imply the turn of the 20th century (records back then are sketchy). Regardless of that, the average minima usually lasts about 450 Earth Days, this one has lasted more than 800 Earth Days. Whether this will continue or not is uncertain. There are certainly more sunspots now than for sometime, but how this impacts the climate of our planet is unsure, making direct links is dangerous, however it does not seem to be a coincidence that the Northern Hemisphere has been experiencing some of the coldest winters for a number of decades. This could be a weird coincidence, but I think there is more going on here than many accept. Many have bashed what they call "sceptics" (why put this is speech marks is beyond me and childish personally) because they complain that highlighting 10 years of data out of 30 years is wrong and 30 years of data shows AGW...but this is always based on statements like "Since records begun". What a silly statement that is, records go back a lot longer, but often get ignored, I agree they are patchy and have error, but they do exist. We have records of summers and winters going back thousands of years in literature, they may not be accurate and calibrated temperature records, but they do tell us what the weather was doing, and it surprising how many of these stories and records coincide with what we now know from scientific evidence of the climate in the past, and this record clearly demonstrates that the climate over the last 10,000 years has been variable over periods of hundreds of years. This cannot be dismissed out of hand, the medieval warm period was real, as was the Little Ice Age. It is a fact that Romans in Britain (AD73-AD490~) grew wine grapes as far north as Hadrian Wall..currently anywhere further north than Bristol and you need a straight jacket as your barking mad. It is right we monitor and study the climate, it is right that we stop polluting our world, but many claims for AGW are not based on real evidence, they are based on evidence to fit the argument, although I concede that most anti AGW claims are often no more than pseudo science or snake oil as many reputable scientists stay away from the campaign for fear of harming their career...and that is not good for science.
    0 0
    Moderator Response: [muoncounter] Please review the Newcomers Guide and the Comments Policy. Your posts drift off-topic into what could quickly become ideological rants. This is a science discussion site; if you have arguments to make about the topic of various threads, do so with the supporting evidence in hand.
  16. @Muoncounter. None of my posts are meant to be or taken as ideological rant. The comments I have made are not specifically off topic they are simply explaining a truth which is connected to and related to the response I gave. Whether we like it or not, most things in science are interconnected, and treating them is isolation creates confusion and misleading statements.
    0 0
  17. #165. LandyJim It is a fact that Romans in Britain (AD73-AD490~) grew wine grapes as far north as Hadrian Wall..currently anywhere further north than Bristol and you need a straight jacket as your barking mad. I can't find any evidence that the Romans grew grapes any farther north than Lincolnshire, looks like it was almost all imported. Can you point us to some? The most northerly vineyard currently in the UK is in Camforth, Lancs which is a bit farther north than Bristol (about 200 miles). The English Wine Producers have over 30 barking mad vineyards located in the Midlands and the North alone.
    0 0
  18. Since I have never posted a graphic, hopefully the moderators will allow me this one
    0 0
    Moderator Response: [Daniel Bailey] Graphics are permitted when they pertain to the topic of the thread. Give us the context of how this is on-topic or we'll have to delete it. Thanks!
  19. #168. lol Eric! I thought I'd found a Roman Vineyard at Hadrian's Wall, but it would appear to be a new one, from here Since the publication of the first edition in 2004 the northern limit of English vineyards has advanced from Mount Pleasant, Lancashire, to Accomb, Yorkshire, within 5km of Hadrian's Wall. The book also states the following: The latest predictions of global warming show that the average summer temperature in southern England may rise by 4.5-5.0 degrees C. by 2080 and by 6.0 degrees by 2100. The new edition describes how these data can be used to predict the areas where different grape varieties may be planted across the UK. Some parts of southern England may be too hot for viticulture by 2080. Sobering stuff!
    0 0
  20. OK..on reflection comments about Vineyards are unhelpful and very misleading. I was remembering statements made in History of Roman Britain from School and as I am not really a wine drinker..I was not aware of the extend of modern British Vinyards. The Most Northerly I have found, which clearly blows my earlier comments well out of the water is this one.. Holmfirth Vineyard, Woodhouse Farm, Woodhouse Lane, Holmbridge, Holmfirth HD9 2QR This is surprisingly close to surviving sections of Hadrian's Wall and thus I think in future I will ignore Vinyards and Hadrian's wall comments... Apologies for that.
    0 0
  21. Continuing from here. EtR#57: "rather that we are not deviating from the long term trend. What we have currently experienced (and may continue) is a return to that trend after the large increase in the 1990s. " This statement begs two questions: a. What, in your interpretation, is 'the long term trend'? b. What, in your interpretation, are we currently experiencing - and what is driving it? If you look at the GISSTemp graph and focus solely on the 1990s, you will see a large decrease (well-known to be the cooling effect of the Pinatubo eruption), followed by what you label the 'large increase,' which is equally well-known as the 1998 el Nino anomaly. The net effect is an excursion of more than 0.5C within the decade. You seem to ignore the fact that these are transients -- not due to the 'long-term trend.' Further, 1910-1940 was approx 0.3 degC in 3 decades; 1975-2005 was 0.7C in 3 decades; what part of 'acceleration' do you not recognize?
    0 0
  22. The "acceleration" is severely lacking in this plot. http://www.cru.uea.ac.uk/cru/info/warming/ The increase for the three decades 1911-1940 was 0.154C / decade, while the 1971-2000 increase was 0.171C / decade. While the rate is slightly higher, I would hardly call this an acceleration. The 1990s were influenced by the two events you mentioned. That is one reason why I prefer not to use these decadal trends, and have been cautioning others who claim that the increase is accelerating based on this change. I am not "ignoring" these transients, but trying to focus people on the long term. Since 1880, both the CRU and GISS datasets show a long-term trend of 0.6C / century. For the first five months of 2011, the CRU data falls right on the trendline, GISS is 0.05 above. This is short term fall due to the recent strong La Nina, and I expect that temperatures will climb later in the year. The long term trend is not linear, but rather oscillating with a long period. The linear portion is largely driven by man, while the oscillations are natural, most likely driven by ENSO changes. Other drivers, like volcanoes and solar, are apparent on shorter intervals. Aerosols are a wildcard in the entire scenario, possibly being a very large influence.
    0 0
  23. 172, Eric the Red,
    The "acceleration" is severely lacking in this plot.
    No, it's not. Your eye is deceived, because you are paying attention to those final 10 years which are not part of the trend (i.e. averaged over a full 15 year time frame). Such incomplete "tails" often show anomalous behavior, because their true shape depends very much on the years that have not yet come to pass. In this case, by looking at that tail, it levels everything out. If you instead focus on the statistically significant portion of the graph, from 1970 to a about 2003 (which has 7 full years before and after it to account for 15 years worth of data) then it is clearly accelerating. You can't opt to give weight to a shorter trend at the end just because it shows what you'd like to see.
    0 0
  24. Eric the Red @172, by my calculation the linear trend on gisstemp from 1880 to 2010 is 0.00586 per annum, with an R^2 of 0.756 In contrast the accelerating curve shown below has an R^2 of 0.8142. Leaving aside the virtues of curve fitting, why should we use a linear trend for the effect of GHG concentrations when an exponential curve gives a better fit? And if you insist on curve fitting with an oscillation thrown in, why not add the oscillation to the exponential trend rather than to a linear trend? It seems to me that as you do not have a physical theory to fall back on to guide your choice, excluding an exponential curve as the underlying trend is at best ad hoc.
    0 0
  25. EtR#172: ""acceleration" is severely lacking in this plot." Surely there is more to this disagreement than just CRU vs. GISS. So let's plot both together using WFT (note there is a -0.1 shift applied to GISS to bring the two curves into visual alignment). -- link to original I've applied a 5 year (60 month) average to both to be consistent with the GISSTemp graph refd above. Your '0.6C/century' is the blue line. The other line is a trend from 1970 on; it is a much larger slope than your 'long-term trend.' Is this larger slope 'what we are currently experiencing' or do you persist in saying we are still on 0.6C/century? "The linear portion is largely driven by man," Agreed! We have driven the slope up to nearly 2C/century. You're a genuine AGWarmist now.
    0 0
  26. Muoncounter, The two datasets show similar trends. The slope is the same for both sets (I use monthly data, but annual should produce similar results). The changes in slope that occurred in 1880, 1910, 1940, and 1970 are real; it is too soon to ascertain if a change har occurred in 2000. These oscillations occurred about the linear trend, which has remained unchanged. Tom, The oscillation could be fitted about an exponential trend. In this case the R2 for the linear would be 0.81, while an exponential would be 0.80, essentially no difference. Sphaerica, ( -Snip- ). We were comparing the periods of steep slopes, not the last decade which you pointed out were not part of the slope.
    0 0
    Response:

    [DB] Inflammatory snipped.  I suggest taking a deep breath to cool off prior to composing your messages.

  27. EtR#176: "These oscillations occurred about the linear trend, which has remained unchanged." That same linear trend, which you said was man made, is unchanged since the 1880s, 1910s, 1940s? Despite significant differences in man made and other environmental (forcing) factors? How strange. How unphysical. But your comment explains quite a bit; you are another 'line and sine' man. No physical mechanism exists to support this purely observational exercise, but then again, no mechanism is needed as you can rely on the mythic 'natural cycles'. What next, the harmony of the spheres?
    0 0

Prev  1  2  3  4  

You need to be logged in to post a comment. Login via the left margin or if you're new, register here.


The Consensus Project Website

THE ESCALATOR

(free to republish)


© Copyright 2024 John Cook
Home | Translations | About Us | Privacy | Contact Us