Climate Science Glossary

Term Lookup

Enter a term in the search box to find its definition.

Settings

Use the controls in the far right panel to increase or decrease the number of terms automatically displayed (or to completely turn that feature off).

Term Lookup

Settings


All IPCC definitions taken from Climate Change 2007: The Physical Science Basis. Working Group I Contribution to the Fourth Assessment Report of the Intergovernmental Panel on Climate Change, Annex I, Glossary, pp. 941-954. Cambridge University Press.

Home Arguments Software Resources Comments The Consensus Project Translations About Support

Bluesky Facebook LinkedIn Mastodon MeWe

Twitter YouTube RSS Posts RSS Comments Email Subscribe


Climate's changed before
It's the sun
It's not bad
There is no consensus
It's cooling
Models are unreliable
Temp record is unreliable
Animals and plants can adapt
It hasn't warmed since 1998
Antarctica is gaining ice
View All Arguments...


Username
Password
New? Register here
Forgot your password?

Latest Posts

Archives

Deep ocean warming solves the sea level puzzle

Posted on 18 February 2011 by Ari Jokimäki

Recent sea level rise has so far been difficult to fully explain: satellites measure global sea level rise since 1993 to be about 3.1 mm/year. The warming and expanding 'upper ocean', or the top 700 metres measured by ships and buoys can explain 1.2 mm/year whilst the water added by melting snow and ice can be estimated from satellite gravity measurements for ice sheets and other methods for smaller glaciers, and is about 0.85 mm/year.
Deep ocean thermal expansion

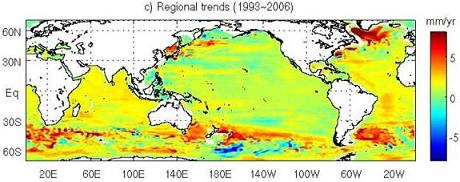
Figure 1. Model result for sea level rise from thermal expansion of the deep ocean.

Simple addition of the numbers above (1.2 + 0.85 mm/year = 2.05 mm/year) shows that the result from the upper ocean thermal expansion and addition of water mass is still about 1 mm/year short of the observed 3.1 mm/year sea level rise. However, some previous studies have had these numbers quite close to each other when the uncertainties in the estimates have been considered.

Most of the previous studies and the analysis above are missing one thing – the effect of the deep ocean. Recent studies have shown the global deep ocean to be warming. We have also gained some knowledge of the transmission of the heat to the deep ocean, which can now occur on decadal timescales instead of previously thought centennial timescales. However, temperature measurements of the deep ocean have been very sparse, so it is difficult to estimate the thermal expansion of the deep ocean from them.

Ocean models have been an important tool for estimating sea level rise and ocean heat content, as they use physics to 'fill in' the data between observations. Most models conserve volume which makes thermal expansion to have no effect to the sea level, so they require so-called "Boussinesq correction" in order to estimate sea level rise from the thermal expansion of the sea water. The correction is globally uniform so the regional estimates might not be correct even if the global estimate would be good.

A new study by Song & Colberg has aimed to improve the estimates of the sea level rise. They used the sea level satellite measurements from TOPEX/Poseidon, Jason-1, ERS-1 and EVISAT. They also used gravity measurements from GRACE to determine the addition of melt-water. Thermal expansion of the upper ocean was determined from the CTD, XBT and Argo measurements. They also used a non-boussinesq ocean model to simulate the sea level budget.

The annual variability is very similar in the estimates of upper ocean thermal expansion and the measurements of the sea level rise. This suggests that the annual variability in sea level rise is originating from the thermal expansion and contraction of the upper ocean with annually varying temperatures. Also the model simulations show similar annual variability. The regional trends are remarkably different in all three data sets. This indicates that there is something missing from the sea level budget.

The model simulations generally agree with the observations rather well with some minor differences here and there. The model simulations also show the deep ocean thermal expansion. There is a long-term expanding trend. This suggests that there should be warming in the deep ocean. Model results show that especially North Atlantic and Antarctic Circumpolar Current deep waters should be warming and that the warming is related to the ocean circulation.
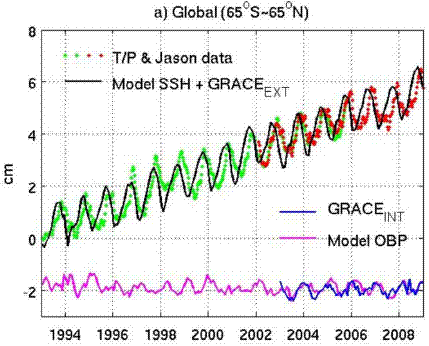
Figure 2. Comparison of model results and observations.

This deep ocean warming might be the reason why the sea level budget does not close. To gain a further confidence to the situation, the model results were compared to the available deep ocean measurements. The result from this comparison is a general match, even if some minor regional differences between the model results and the observations exist. The model results also show that the deep ocean warming is strongest in the Southern Ocean, which matches the results of the recent study by Purkey & Johnson.

The model simulations give a sea level rise of 1.1 mm/year from the thermal expansion of the deep ocean. When that is added to the 2.05 mm/year calculated above, the result (3.15 mm/year) is remarkably close to the observed rise of 3.1 mm/year (which more accurately is 3.11 mm/year).

Here it is important to note that most (82%) of the volume of the global ocean lies deeper than 700 meters from the surface. Therefore even slight warming in the deep ocean causes a large rise in sea level. Observations show that the upper parts of oceans have warmed for decades, which is sufficiently long time for the warming to show up in the deep ocean as well.

Reference: Song, Y. T., and F. Colberg (2011), Deep ocean warming assessed from altimeters, Gravity Recovery and Climate Experiment, in situ measurements, and a non-Boussinesq ocean general circulation model, J. Geophys. Res., VOL. 116, C02020, 16 PP., 2011, doi:10.1029/2010JC006601.

See also this Skeptical Science article on the recent study by Purkey & Johnson: Billions of Blow Dryers: Some Missing Heat Returns to Haunt Us. Here's also Ari Jokimäki's article on Purkey & Johnson.

This post was translated into English by Ari Jokimäki who wrote the original Finnish version.

0 0

Printable Version  |  Link to this page

Comments

Comments 1 to 28:

  1. Does this include water coming from aquifers? I seem to recall last year a paper claiming about ¼ of the sea level rise was due to aquifer being emptied (and in itself that is a huge problem).
    0 0
  2. Just to confirm the majority of the energy getting into the deeper layers is getting their by transport (currents) and not conduction, so things like where the thermohaline overturn in the North Atlantic it takes energy with it to the deeper oceans.
    0 0
  3. For once I am in agreement with you: however, you have left out the source of the warming, which is exploding methane hydrates which bring up heat from the deep earth to the ocean floor. You have also left off another source of rising seas: Methane oxidation. Methane oxidizes to formaldehyde and water, before progressing to carbon monoxide and then carbon dioxide. Rising methane means rising amounts of water vapor in our air that comes down as rain and snow and hail, and off course the oxidation of methane which takes place on our seas and does not escape to the air contributes as well. Yet another reason our seas are rising is that a weaken crust of the earth is subsiding; the continental shelfs are collapsing and we are sliding toward the seas. How about calculating: Given methane has risen 140% at the same time carbon dioxide has risen 26% What percentage of the 26% rise in methane is wholly attributible to methane oxidation. Andrea Silverthorne
    0 0
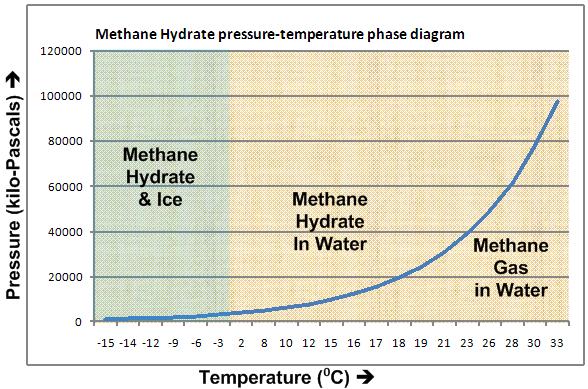
  4. Andrea: "exploding methane hydrates which bring up heat from the deep earth to the ocean floor." Methane hydrates (or clathrates) form when gas is frozen within ice crystals in the deep ocean. This is quite cold and would not carry 'heat from the deep earth.' Here is a phase diagram: See this thread for additional discussion. "methane has risen 140% at the same time carbon dioxide has risen 26% " Atmospheric methane concentrations are typically measured in parts per billion; CO2 in ppm.
    0 0
  5. The expansion of the deep ocean should suggest a temperature rise of the deep ocean, and that should relate to the (currently) mysterious Trenberth's travesty of the global heat budget. Can someone with more maths than I confirm or deny (or more likely, shed grey where needed) that this deep ocean expansion does plug that hole in the equation?
    0 0
  6. Fantastic post Ari and very interesting! This answer is a little surprising, and somewhat distressing too.
    0 0
  7. It might be worth pinging Roger Pielke Sr. on the subject of this post. RPSr made a series of comments on this site last summer, where he claimed that ocean heat content measurements weren't supporting the planetary heating rate expected by AGW. He hinted revisions to OHC and SLR measurements would support his view. With this paper it now appears the planetary energy budget is closing, If RPSr is consistent with his previous comments, he should now reverse his position, and agree that the planetary energy budget supports AGW.
    0 0
  8. Zinfan94, I was wondering how this translates into OHC. Have yet to look at the paper, but I'm wondering if they calculated OHC? If yes then it sure would be nice to see those data; if not, their data could probably be used to calculate OHC.
    0 0
  9. dorlomin #1: I didn't see mention of aquifers in this study. dorlomin #2: Read the Purkey & Johnson mentioned above. They seem to suggest that Southern Ocean plays a large role (by circulation) in the deep ocean warming. Andrea Silverthorne #3: Methane has not risen much during the study period of this paper (1993-2008). Atmopheric methane concentration has been quite steady since 1999 (although it has been rising again since 2007). There's also Dlugokencky et al. (2009), who say that "Near-zero CH4 growth in the Arctic during 2008 suggests we have not yet activated strong climate feedbacks from permafrost and CH4 hydrates." By the way, there's a new paper out that gives satellite measurements of methane concentration. actually thoughtfull #5: It seems to me that the amount of warming discussed in Purkey & Johnson might not be enough to close that budget, but it would be nice to see actual analysis on that. Here's a relevant quote from Purkey & Johnson: "From 1993 to 2008 the warming of the upper 700 m of the global ocean has been reported as equivalent to a heat flux of 0.64 (±0.11) W m–2 applied over the Earth’s surface area (Lyman et al. 2010). Here, we showed the heat uptake by AABW contributes about another 0.10 W m–2 to the global heat budget." Albatross #8: They didn't calculate deep ocean OHC in this paper. They used an ocean model to determine the deep ocean situation, so they don't actually have any new observational data.
    0 0
  10. Ari Jokimaki #9 & zinfan94 #7 If the above paper is using Purkey & Johnson quoting Lyman 2010 viz: "From 1993 to 2008 the warming of the upper 700 m of the global ocean has been reported as equivalent to a heat flux of 0.64 (±0.11) W m–2 applied over the Earth’s surface area (Lyman et al. 2010)." - then it is probably wrong. The 0.64W/sq.m is derived from linearizing a step jump in OHC over the 2002-04 period which has been extensively discussed elsewhere on this blog.
    0 0
  11. This new paper or Purkey & Johnson do not depend on the 0,64 W/sq.m figure. It's just used in Purkey & Johnson to compare their result. This new paper doesn't seem to use it in any way.
    0 0
  12. Albatross #8 Ari Jokimaki #9 and Ken Lambert #10 I read the paper last night, and found it very interesting. They used gridded satellite altimeter data for sea level and compared this to gridded ocean bottom pressure (OBP) from GRACE. They then took the upper level (700m) ocean heat content (OHC) info from XBT/ARGO and translated that into a steric sea level (SSL) contribution. The contribution of eustatic rise from ice sheet and glacier melt is removed, leaving the SSL contribution from the deep ocean heating in each particular grid cell. In these two paragraphs from the paper, they explain the deductive reasoning: [30] So far, we have mostly assessed the upper ocean (0–700 m) data, satellite SSH and OBP data, and compared them with the model. In this section we focus our attention on the deep ocean. Figure 12 shows the model deep ocean SSL below 700 m. Note that the seasonal variability in the deep ocean SSL is rather weak, particularly for the annual amplitude. This is consistent with the previous data assessment, suggesting that deep oceans contribute very little to the seasonal variability of the sea level. However, the story is different for the regional trends. The model suggests a significant deep ocean warming trend, particularly in the North Atlantic and along the Antarctic Circumpolar Current (ACC). The warming features appear closely related to the oceanic circulation and dynamics. As such they may provide an explanation as to why altimetry SLR cannot be adequately explained by the sum of upper ocean (0–700 m) SSL and ocean mass change calculated from GRACE (discussed in section 3). [31] In order to verify a possible hypothesis that connects the deep ocean warming to the missing part of the sea level budget closure, the following two conditions should be fulfilled: (1) The model deep ocean warming should be consistent with available bottom water measurements, and (2) its combination with the in situ upper ocean SSL and GRACE data should explain the altimetry SLR in both global mean and regional trends. In the following we discuss these two conditions in more detail. They estimate that eep ocean heating contributes about 1.1 mm of the observed 3.1 mm per year of sea level rise (SLR). The paper also shows significant regional deep ocean warming variation, with the Southern Ocean and portions of the Atlantic warming much faster. The authors compare the regional results with other studies and discuss many similarities and a few discrepancies. Although not discussed in the paper, this amount of SLR should translate into the deep ocean acting as a heat sink with a rough estimate that the deep ocean is taking as much as 70 x 10^20 J per year of the planetary energy imbalance, roughly the same as the upper 700m level. In essence, this would close the planetary energy budget, and confirm the planet is heating about 0.9 W per square meter, the estimated top of atmosphere (TOA) imbalance from AGW models (and roughly confirmed by measurements of outgoing longwave radiation). Dr. Trenberth has published extensively on the planetary energy imbalance, and it will be interesting to hear his views on the Song and Colberg results. This paper may go a long way in helping resolve the famous “Trenberth Travesty”.
    0 0
  13. Thanks for the feedback Zinfan, I am pretty busy right now, which means that I cannot devote as much time to this as I would like. Yes, it will be interesting to hear Trenberth's thoughts on this, and I'd be curious to know what Pielke Snr's and other contrarians' spin will be on this. Ari, I realise they do not have any new observational data for the deep ocean, but surely their model calculates deep water temperatures, b/c they do calculate the contribution from the deep water to the SSL? Then again, a closer read of zinfan's post suggests that the deep water contribution to SSL was determined as a residual.... Anyways, if zinfan's maths is correct then this paper is very exciting indeed, at least in terms of trying to close the planetary energy budget.
    0 0
    Moderator Response: (DB) My first read-through yielded the same interpretation as Zinfan.
  14. Concur with zinfan94, I too calculate the same heat flux into the deep (deeper than 700m) ocean as the upper (less than 700m deep) ocean. I also find interesting the phase shift between the model and the data, which only has some small discussion on page 9. sidd
    0 0
  15. Will the melting of the Tundra make a contribution to sea level rise?
    0 0
    Moderator Response: [Daniel Bailey] Directly (melt water raising sea levels), maybe a bit (haven't seen any papers quantifying that. But a Wiki search finds that permafrost accounts for 0.022% of total water). Indirectly, absolutely (see this paper - nice discussion of it by Romm over at Climate Progress).
  16. zinfan94 #12 How does this paper fit with NOAA chart which shows flat OHC from ARO 2003-2010 since the step jump of the 2002-2003 period? See here: http://www.nodc.noaa.gov/OC5/3M_HEAT_CONTENT/
    0 0
  17. Avi, This seems like an extraordinary over simplification. You like the model result but fail to mention that Purkey & Johnson have attempted to use observational data to do exactly the same. They find 0.14(0.053+0.093)mm/yr SLR from the deep. That's close to a magnitude lower than the model. If the model fails to match the data shouldn't we question the model? I like the confidence of the title for this article but it seems completely misplaced. Ari I'm also curious where you got the two estimates for the first paragraph? Apart from the fact that you didn't state any dates for those estimates I'm not aware of any recent attempts to close the sea level budget in the literature that gave those figures. Here's four recent one's I've found which focus on the 2003-2007 period. Could you provide a reference for the numbers you use? Chang et al (2010) STERIC −0.11±0.22 MASS 0.70±0.34 TOT 2.67±0.52 Willis et al. (2008) STERIC −0.5±0.5 MASS 0.8±0.8 TOT 3.6±0.8 Leuliette and Miller (2009) STERIC 0.8±0.8 MASS 0.8±0.5 TOT 2.4±1.1(2.7±1.5) Cazenave et al. (2009) STERIC 0.37±0.1 MASS 1.9±0.1 TOT 2.5±0.4
    0 0
  18. HumanityRules #17: You seem to misunderstand my post. It's not about what I like or not, it's just a report of this new study. I'm only reporting what they say in their article. On the mismatch between Purkey & Johnson and this new study, you need to remember that Purkey & Johnson's data is sparse and one point of this new study is to emphasize that there are regional differences in deep ocean warming trends which might be important. The references of the figures used are here quoted from the Song & Colberg article: "Satellite altimeters have observed a global mean SLR of 3.11±0.6 mm/year since 1993 until 2008 [Ablain et al. 2009]." "These in-situ measurements include using conductivity, temperature and depth (CTD) sensors, expendable bathythermographs (XBT), and Argo floats (Argo), which give a rate of 1.2±0.8 mm/year for the same period [Willis et al. 2004; 2008; 2009; Ishii and Kimoto 2009]." "In addition, GRACE (the Gravity Recovery and Climate Experiment) data infer an ocean-mass change of 0.85±0.5 mm/year over 2002-2008, after corrected by a glacial isostatic adjustment (GIA) model [Paulson et al., 2007]."
    0 0
  19. #16 Ken Lambert: "How does this paper fit with NOAA chart which shows flat OHC from ARGO 2003-2010 since the step jump of the 2002-2003 period? See here: http://www.nodc.noaa.gov/OC5/3M_HEAT_CONTENT/ " The Argo graph you show is for the top 700 meters. Preliminary updated information is discussed by Josh Willis in e-mails to Pielke Sr at http://pielkeclimatesci.wordpress.com/2011/02/13/update-of-preliminary-upper-ocean-heat-data-analysis-by-josh-willis-%E2%80%93-%E2%80%9Can-unpublished-update%E2%80%9D/ and http://pielkeclimatesci.wordpress.com/2011/02/07/where-is-the-missing-argo-upper-ocean-heat-data/ ---------------- The very brief summary is: Argo measures about 0.16 watts/meter-squared (referenced to total earth surface, using the same units as top-of-atmosphere imbalance figures) in the upper 700 meters of ocean. Pukey says 0.095+/-0.062 w/m^2 in the deep ocean. (roughly 0.1w/m^2). 0.16 + 0.1 is much less than the 0.6w/m^2 expected by models for top-of-atmosphere imbalance. (0.6w/m^2 is the old Hansen number). In post #12 above, Zinfan uses the 0.9w/m^2 number of later, improved models, which only increases the gap in closure of the energy budget.
    0 0
  20. zinfan94 at 15:52 PM on 19 February, 2011: "It might be worth pinging Roger Pielke Sr. on the subject of this post. RPSr made a series of comments on this site last summer, where he claimed that ocean heat content measurements weren't supporting the planetary heating rate expected by AGW. He hinted revisions to OHC and SLR measurements would support his view." See the links in my comment above. The main problem most readers of this blog will have with his comments is that it only uses the most recent instrumentation systems .... Argo and satellites, so the analysis only goes back to around 2004. If we ignore satellites and only use tide gauges and XBT temp measurements, the analysis is quite different.
    0 0
  21. If the deep ocean can warm on decadal time scales (an order of magnitude faster than previously thought) and if that turns out to balance the heat budget and the sea level rise budget, there is one silver lining. It means we get the thermal inertia of the deep ocean as a brake on the rate that the surface can warm. That would be very good for survivability of the next 200y or so. Unfortunately this could just make deniers think they're right longer than if the deep ocean wasn't a player.
    0 0
  22. Charlie A Quite right Charlie A. 0.16 (top 700m) + 0.1 (deep ocean) = 0.26W/sq.m. Dr Trenberth et al say TOA imbalance is 0.9W/sq.m. We are finding less than one third of the warming imbalance in all the oceans. Possible conclusions: A) The 0.9W/sq.m is right and we are not measuring the oceans correctly (the its there but we can't measure it story) B) The 0.26W/sq.m are right and the TOA imbalance of 0.9W/sq.m constructed from models is wrong. C) Or both are wrong and the correct answer lies somewhere in between. FFS (fat finger syndrome)on above post - went early.
    0 0
  23. "Deep ocean warming solves the sea level puzzle" Does it really?? - certainly does not solve the energy imbalance puzzle. HumanityRules #17 illustrates that the Sea level balance does not close too well either. viz: "If the model fails to match the data shouldn't we question the model? I like the confidence of the title for this article but it seems completely misplaced." Quite right HR - it seems we have another SS Headline which on closer examination; is a fizzer.
    0 0
  24. Ken Lambert #23: Why are you bringing up already answered arguments as if they haven't been answered? "Does it really?? - certainly does not solve the energy imbalance puzzle." If you claim certainty here, then go ahead and prove your claim. But it will take lot more than simply pretending that the Purkey & Johnson number is the ultimate truth - that is not certain. So, show us where the certainty arises from.
    0 0
  25. Ari, Sorry but this is about what you like. Here's what you wrote about P&J at AGW Observer "This study seems to suggest that in the warming of the deep world ocean the Southern Ocean plays a remarkably large role. The warming found in this study has been poorly known before, so this study seems to make the ocean heat budget, and even the whole Earth heat budget, more accurate." And here's what you wrote about P&J in response to my criticism. "On the mismatch between Purkey & Johnson and this new study, you need to remember that Purkey & Johnson's data is sparse and one point of this new study is to emphasize that there are regional differences in deep ocean warming trends which might be important." So you choose to argue the positive features of the data in your first article and negative when you try to tell a different story. You're trying to elevate the S&C model estimate over the P&J observational estimate by changing your position on P&J. I don't see the rational for that. There's a general issue about to what extent climate science conclusions are interpretive rather than based on hard facts. Often what one chooses to like or dislike about a data set is key to that interpretation. I know that OHC and closing the sea level and energy budget seem to be tricky problems at the moment, especially with regard to the ARGO data. But I don't think you solve that by simply imagining a heap of certainty from the lastest model result. Your headline is misleading, the puzzle is certainly not yet solved.
    0 0
  26. "Sorry but this is about what you like." No, it isn't. In both P&J and this new paper case I have reported what the authors are telling. There of course might be some problems with my interpretations, but that still doesn't mean it's about what I like or not. Suggesting something like that about me is what I don't like. "So you choose to argue the positive features of the data in your first article and negative when you try to tell a different story. You're trying to elevate the S&C model estimate over the P&J observational estimate by changing your position on P&J." Nonsense. In your first quote I just said that P&J seems to make the ocean heat budget more accurate which I think is still true as before P&J the role of deep ocean was practically non-existent. In your second quote I said that P&J data is sparse, which it is. So, perhaps you could clarify to me where exactly you think I have changed my position on P&J? On the other hand, you are trying to make it look like that this new paper is just some make believe model exercise which has no relevance to anything. You seem to ignore that the model results were compared to the existing body of observations with rather good results. "Your headline is misleading, the puzzle is certainly not yet solved." Sure, that might be the case. Headlines are short and it's not always easy to write them so that it wouldn't be misleading to someone. Hopefully people sometimes also read past the headline and don't stop arguing there.
    0 0
  27. I know this question is way out there, but I have to ask. Does the rise of sea level take into account changes in the Earth's radius, or is this considered a constant?
    0 0
  28. If the deep ocean is gaining heat how does this impact climate response time? Does it reduce the rate of warming at the surface we can expect?
    0 0
    Moderator Response: [DB] Fixed text.

You need to be logged in to post a comment. Login via the left margin or if you're new, register here.


The Consensus Project Website

THE ESCALATOR

(free to republish)


© Copyright 2024 John Cook
Home | Translations | About Us | Privacy | Contact Us