Climate Science Glossary

Term Lookup

Enter a term in the search box to find its definition.

Settings

Use the controls in the far right panel to increase or decrease the number of terms automatically displayed (or to completely turn that feature off).

Term Lookup

Settings


All IPCC definitions taken from Climate Change 2007: The Physical Science Basis. Working Group I Contribution to the Fourth Assessment Report of the Intergovernmental Panel on Climate Change, Annex I, Glossary, pp. 941-954. Cambridge University Press.

Home Arguments Software Resources Comments The Consensus Project Translations About Support

Bluesky Facebook LinkedIn Mastodon MeWe

Twitter YouTube RSS Posts RSS Comments Email Subscribe


Climate's changed before
It's the sun
It's not bad
There is no consensus
It's cooling
Models are unreliable
Temp record is unreliable
Animals and plants can adapt
It hasn't warmed since 1998
Antarctica is gaining ice
View All Arguments...


Username
Password
New? Register here
Forgot your password?

Latest Posts

Archives

Muller Misinformation #1: confusing Mike's trick with hide the decline

Posted on 29 March 2011 by John Cook

The most cited 'Climategate' email is one from Phil Jones discussing a graph he produced for a World Meteorological Organization (WMO) report, where he discusses "Mike's trick" and "hide the decline". A number of misconceptions have arisen concerning this email. Unfortunately a prominent source of 'hide the decline' misinformation Professor Richard Muller from Berkeley. One of Muller's errors is confusing several separate techniques, blurring them into a single "hide the decline". Muller commits this error in a public lecture (emphasis added):

"A quote came out of the emails, these leaked emails, that said "let's use Mike's trick to hide the decline". That's the words, "let's use Mike's trick to hide the decline". Mike is Michael Mann, said "hey, trick just means mathematical trick. That's all." My response is I'm not worried about the word trick. I'm worried about the decline."

Muller uses the phrase "Mike's nature trick to hide the decline" as if it's Phil Jones's actual words. In a lecture recorded last weekend at Berkeley, Muller continues to expound on how Michael Mann's trick was used to hide the decline (emphasis added):

"What they said is "how can we hide the decline?" And the suggestion came back from Phil Jones at the UK, "Let's use Mike's trick to hide the decline". Mike's trick consisted of erasing that data, calling it unreliable, and then substituting the temperature data from thereon."

However, the original text from Phil Jone's email indicates otherwise:

"I’ve just completed Mike’s Nature trick of adding in the real temps to each series for the last 20 years (ie from 1981 onwards) and from 1961 for Keith’s to hide the decline."

It's clear that "Mike's Nature trick" is quite separate to Keith Briffa's "hide the decline". Muller has taken different sections of Phil Jone's emails and morphed them into a single phrase. To understand how this is a misleading characterisation, it's helpful to examine exactly what "Mike's Nature trick" and "hide the decline" refer to.

What does "hide the decline" refer to?

Phil Jones' email is often cited as evidence of an attempt  to "hide the decline in global temperatures". This is incorrect. The decline actually refers to a decline in tree-ring density at certain high-latitude locations since 1960. However, Muller doesn't make this error - he clearly understands that global temperatures have been rising in recent decades as indicated by the instrumental record.

Tree-ring growth has been found to match well with temperature, and hence tree-ring width and density is used to plot temperature going back hundreds of years. However, tree-rings in some high-latitude locations diverge from modern instrumental temperature records after 1960. This is known as the "divergence problem". Consequently, tree-ring data in these high-latitude locations are not considered reliable after 1960 and should not be used to represent temperature in recent decades.

In Phil Jones' original email, he refers to a graph produced for the cover of a 2000 WMO report.

WMO graph by Phil Jones

Figure 1: Northern Hemisphere temperatures were reconstructed for the past 1000 years (up to 1999) using palaeoclimatic records (tree rings, corals, ice cores, lake sediments, etc.), along with historical and long instrumental records (WMO 2000).

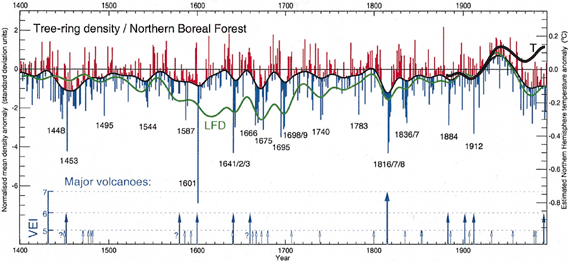
To construct the green line, Jones took tree-ring density data from Annual climate variability in the Holocene: interpreting the message of ancient trees (Briffa 2000). Note - the reason the paper was eventually published in 2000, not 1999, was due to a publication delay. We can see the original tree-ring density data in the figure below, taken from Briffa 2000. The green line represents Low Frequency Density (LFD) and diverges from the instrumental temperature record (the thick black line), as noted by Briffa in the caption.
Briffa tree-ring density

Figure 2: An indication of growing season temperature changes across the whole of the northern boreal forest. The LFD curve indicates low-frequency density changes. Note the recent disparity in density and measured temperatures.

In creating the WMO graph, Jones cut off the tree-ring density curve around 1960 when it diverged from instrumental temperature and grafted the instrumental temperature onto the green line. This technique has been rightly criticised for failing to distinguish between reconstructed temperature and the instrumental temperature in a graph. However, the decline in tree-ring density is not a hidden phenomena - it's been openly discussed in the peer-reviewed literature since 1995 (Jacoby 1995) and was also discussed in the IPCC Third Assessment Report (TAR) and Fourth Assessment Report (AR4).

Lastly, it bears remembering that other research finds tree-ring density is reliable before 1960. Briffa 1998 finds that tree-ring width and density show close agreement with temperature back to 1880. The high-latitude tree-rings that show divergence after 1960 also match closely with other non-diverging proxies going back to the Medieval Warm Period (Cook 2004). This indicates the divergence problem is restricted to modern times.

What is "Mike's Nature trick"?

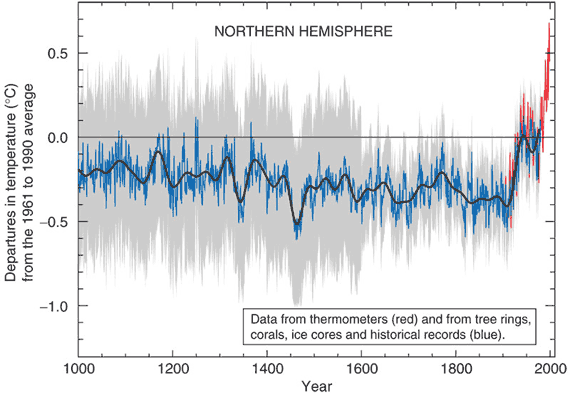
This refers to a technique (in other words, "trick of the trade") used in a paper published in the journal Nature by lead author Michael Mann (Mann et al 1998). The "trick" is the technique of plotting recent instrumental data along with the reconstructed data. This places recent global warming trends in the context of temperature changes over longer time scales. This graph is commonly known as the hockey stick.

Mann's 1998 paper in Nature plotted temperature back to 1400 AD. The temperature reconstruction was extended back to 1000 AD and published in Mann et al 1999 which was reproduced in the IPCC Third Assessment Report (TAR). The IPCC TAR version of Mann's hockey stick is shown below:
Hockey Stick

Figure 3: Northern Hemisphere mean temperature anomaly in °C (IPCC TAR).

There is nothing secret about "Mike's trick". Both the instrumental (red) and reconstructed temperature (blue) are clearly labelled in Mann's 1998 Nature article, the follow-up Mann et al 1999 and the IPCC Third Assessment Report.

A common and broadly held misconception is that Mann's hockey stick hides the decline. There is no "decline" in Mann's reconstructions. As we shall examine shortly, the source of "the decline" come from temperature reconstructions calculated from tree-ring density at high northern latitudes (Briffa 1998). There are very few of these in Mann's proxy data and hence his reconstructions never required removal of any declining tree-ring density.

Thus it's clear that "Mike's Nature trick" has nothing to do with Briffa's "decline". There is no "decline" in Mann et al 1998 and Mann et al 1999. To conflate two separate techniques via the phrase "Mike's Nature trick to hide the decline" is adding to the glut of 'Climategate' misinformation.

0 0

Printable Version  |  Link to this page

Comments

Prev  1  2  3  4  

Comments 151 to 200 out of 200:

  1. Damn! My french witticisms don't work, given the mods (snips) Editors, hu? Can't publish without them, Can't publish with them.
    0 0
  2. Les what is the non sequitur nil point? John Cook writes that Mr Jones "has been rightly criticised for failing to distinguish between reconstructed temperature and the instrumental temperature in a graph." I ask, do you agree? Why is it so hard getting straight answers (or any answer) to straight questions around here?
    0 0
    Moderator Response: [DB] The specific text from the original post does NOT say that Jones was being criticized, but rather: "This technique has been rightly criticised for failing to distinguish between reconstructed temperature and the instrumental temperature in a graph." (emphasis added) Perhaps the lack of clarity and the holiday weekend have a lot to do with the lack of response.
  3. Ryan Star @147 both fails to interpret the graph @146 and presents a graph he declares to be self interpreting. To start with, the graph does not tell us which "Mornington" it provides figures for. It is produced by the Australian Bureau of Meteorology, so I shall restrict myself to Australian Morningtons. So is it from Western Australia, Tasmania, Mount Isa, Queensland, Victoria (and if so, is it figures for the Peninsular or the town?), or is it in fact for the Island. As a Queenslander (and indeed originally a north west queenslander, the Island came first to mind, with the peninsular as a close second. But I did not know while I wrote the preceding paragraph which was referred to. Checking the station number, however, I find out that it is Mornington, the town in Victoria that is referred to. Note that this checking of additional data is exactly equivalent to what is required to properly interpret the WMO graph, and which Ryan insists should not be needed. Proceeding on, the graph shows mean rainfall for given months. But is that mean daily rainfall in each month for a given year? Or is it the mean total rainfall in each month over a number of years? Well, I know a little about Victoria's weather, so I'll guess the second - but to do that I need to call on extraneous information to do so. The graph does not self interpret. Shown a similar graph for Alice Springs (for example) but without the location data, I would not be able make the judgement as to whether it was arid monthly totals, or temperate daily means for a given month. Checking the http://www.bom.gov.au/climate/averages/tables/cw_086079.shtml I can determine that my hunch was right. It was the mean monthly totals over a number of years. But that is not a given from the graph. It is only additional information that allows me to make that interpretation. Finally, over what period is it the mean? Is it over the most recent 30 years? From the establishment of the station? And if so, when was that? As it happens, I now know that it was from 1868 to 2011. But I only know that with certainty because the BOM site from which the graph was obtained draws the graph differently for other options: There are still other issues left uninterpreted here. Was the weather station always at the same location? If not, where the data adjusted to compensate for the change in station location, and if so how? Where there any issues with the station site such as overhanging branches or eaves which might have distorted the data? How frequently was the data recorded (daily, every few days, weekly), and was that consistently done? All these are relevant issues to interpreting the graph which the graph does not inform us of. So, and very clearly, the graph does not self interpret. It isn't a graph on a controversial issue so Ryan does not notice that, but it remains true. Indeed to properly interpret the graph I needed to do the same amount of sleuthing as I needed to do to interpret the WMO graph. Despite that equivalence, Ryan accuses Jones of wrongdoing, and considers the BOM graph self interpreting.
    0 0
  4. 152 Ryan I did not respond directly to your question because it had nothing to do with the issue of whether graphs should be perfectly self interpreting. simple. Had you wanted to you could have inferred from my input, my answer; if the method section of a paper does not properly describe the techniques and data used, which may or may not be shown in a pretty picture, the paper is at fault. The reason I emphasise this - and fir my input on this subject a few times, is that a lot of people seem to think the work all about looking at graphs. This is because that is how a lot of scientists illustrate their story (which is fine); but the real story is in the words and equations nit the illustrations.
    0 0
  5. I asked what was a non sequitur nil point and pointed out that it was difficult getting a straight answer to straight questions from you guys. The question being do you agree with John Cook's quote. The mod snipped the whole post. He/She leaves your post unedited telling me that I act like a school teacher. Is this how we discuss science?
    0 0
    Moderator Response:

    [DB] In order to be fair, comments with content in violation of the Comments Policy yet containing substantive points germane to the topic of the thread will typically have the egregious portions snipped. Repeated violations of the policy will result in the comment being deleted en toto.

    Per my response to you above, the criticism mentioned was of the technique, not the person utilizing the technique.  Just to be clear.

    I did not infer from Les' comment about teaching that there was intent to demean. Les? Want to elaborate on that point?

  6. Ryan Starr @155, your problem is that we have already given you a straight answer to your question, it is just not the answer that you want. That answer is that Jones did not follow best practice. He could have done it better. But that is a long way a way from the answer that you want. You have tried leading the witness, but to your chagrin, the witnesses keep on telling the truth.
    0 0
  7. 155 mod/DB:- My point about teaching was simply, although I admit obliquely - to point out that there's a lot of "they should do this..." and "scientists should do that..." and a range of dictums pronounced on best-practice etc. which are, on the one hand, not the absolutes people (and particularly non-science practitioners) think they are. Teachers give simple rules - which are, in practice, only rules-of-thumb. Context and common practice need to be taken note of; and deviation from those 'rules' isn't a sign of incompetence or, worse, malfeasance! In general, what's taught in class to budding scientists is what should be done in a lab book. This is really important as lab-book results are the base line of evidence - which can even have legal consequences. In this example, a graph is a review article isn't the same as one in a detailed results paper, isn't the same as one in a lab-book, or one on a power-point etc. One size-rule does not fit all.
    0 0
  8. Thanks for all these explanations. I understood a lot of this from other reading, but I thought that Dr. Mann had taken off the incorrect line. I also like the Climate Crock film and will watch your new shows. I understand enough to realize that it's not the climate scientists who were trying to trick me.
    0 0
  9. Your description of “Mike’s Nature trick” is false. The trick is not merely “plotting recent instrumental temperature data along with historical reconstructed data.” If it were, there’d be no problem. The trick actually consists of splicing instrumental data onto the reconstructed series (starting at 1980), smoothing the resulting series, then truncating the series at the point the instrumental data had been appended. That is nothing like what you describe. For more information on the subject of “tricks,” I highly recommend readers look at this post.
    0 0
  10. Brandon, you're describing a difference without a distinction. That is, the process you lay out can be accurately described as "plotting recent instrumental temperature data along with historical reconstructed data"... the statement you are ostensibly 'refuting'. You're just specifying minutiae of how the two data sets were plotted together. Does this focus on minutiae change the conclusion that Muller misrepresented the 'trick' as hiding a decline in global temperature data? No... because the whole point of the trick was to show the global temperature data! There isn't any decline in that data. The decline is a known error in the proxy data from tree rings. Mann excluded provably erroneous proxy data in favor of showing the actual global temperature measurement results. The 'skeptic' claim that failing to show false results is some kind of scientific misconduct demonstrates just how divorced from reality they have become.
    0 0
  11. CBDunkerson, your response is wrong. In no way does modifying the reconstructed data by using data from another series qualify as "plotting recent instrumental data along with the reconstructed data." How could modifying a series possibly be just plotting it along with another series? There are two sets of data plotted in the graph. One is the instrumental series. The other is the reconstructed series modified by using the instrumental series. This is not as you describe, and it's effect can readily be seen in the link I provided. Moreover, you make an untrue remark about Michael Mann. You say, "Mann excluded provably erroneous proxy data in favor of showing the actual global temperature measurement results." You're claim that Mann "excluded" data is untrue in this context. The reconstructed series he had ended at 1980, as did his final result. While data in that series was modified, none was excluded. I assume you are just mixing up this case and a case involving Keith Briffa, but whatever the cause, your claim is wrong. As for the rest of what you say, I don't have any intention of discussing the significance (or lack thereof) of these points. I'd just like for people to stop saying untrue things about simple facts.
    0 0
  12. @Brandon Shollenberger #161: Since the NH land instrumental series spans a temperature range of >1˚C, would the effect really be any different than merely plotting the tree ring chronology against the instrumental period with an overlap along the calibration period? I wonder if you're making much ado about nothing. I also don't know much about the Butterworth filter, but how much of the effect seen at the end of the series from the non-smoothed-with-instrumental data, in other words how much of that downward angle, is due to the choice of filter itself and how it behaves at the endpoints of series? Certainly Mann didn't splice instrumental data at the beginning of the time series, but the filter that McIntyre applied certainly seems to drop below what Mann's data shows. The tree ring data also doesn't show such a drop to the zero mark at the very end so the filter's doing something at the endpoint that reflects the trend of the data preceding, but doesn't respond to higher frequencies as might have actually existed at, say, ~1970-1980. Indeed from a brief lookup e.g. here: http://ocw.mit.edu/resources/res-6-007-signals-and-systems-spring-2011/lecture-notes/MITRES_6_007S11_lec24.pdf Butterworth filters are low-pass and will suppress higher frequencies. So the ends of the smooth won't necessarily behave as the trend might actually be in the later data.
    0 0
    Moderator Response: [DB] Fixed text per request.
  13. Brandon Shollenberger @159 and @161, given the nature of your concluding comments, it would be helpful if you were careful with the facts. Let's actually start with those facts: 1) The only person who knows what was meant by Jones when he wrote of "Mann's Nature trick" was Jones himself. Comments by any other person, including most especially Steve McIntyre consist of conjecture only. 2) The person next best placed to know what was meant was Michael Mann himself, who has said:
    "The paper in question is the Mann, Bradley and Hughes (1998) Nature paper on the original multiproxy temperature reconstruction, and the ‘trick’ is just to plot the instrumental records along with reconstruction so that the context of the recent warming is clear."
    I am unaware of any specific statement by Phil Jones on the issue. Consequently this statement is the only available statement by a principle and should be taken as definitive unless substantial evidence to the contrary exists. Neither you, nor so far as I am aware, anyone else has provided that substantial evidence. Rather, you have insisted that McIntyre's conjecture should trump Mann's word on, apparently little other basis than the desire that Mann should be wrong. 3) Mann did use a technique similar to that described by you in generating the smoothed curve for MBH 98 and MBH 99. Specifically, he appended the mean of the instrumental data from 1981-1997 (MBH 98) and from 1981-1998 (MBH 1999) and use that to pad the proxy data for generating the smoothed curve. Note that contrary to McIntyre, he did not use the instrumental values themselves, but the mean of the values over a given period. Further, and again contrary to McIntyre, he ended the smooth in 1973 (MBH 98) and 1979 (MBH 99), ie, the period determined by necessity when using a 50 year (MBH 98) or 40 year (MBH 99) smooth. Clearly McIntyre has not even got the reconstruction of Mann's smoothing method correct. His supposition that he can deduce from his flawed reconstruction of Mann's smoothing method the nature of the "Nature trick" is absurd. Specifically, McIntyre gives no evidence that the trick relates to the smoothing function as opposed to appending of the full instrumental record as claimed by Mann. 4) Assuming Jones was referring to his graph for the WMO report, he did not do anything like what Mann did in his Nature article (MBH 98). Consequently the name of "Mike's Nature trick" is a complete misnomer. Fake climate-auditors, however, insist on using it, and in trying to suggest that Mann did something similar. Clearly the purpose is not to criticize Jones' techniques, which stand or fall on their own merits. Rather it is an attempt to try and tarnish as many reputations as possible on no substantive basis. 5) As always, the holy grail for so-called climate auditors is to detract from Michael Mann's work. In this case, the absurdity of their attack is shown by the fact that: a) As Michael Mann says:
    "[The scientific results] were based on comparisons of the individual reconstructed annual values (individual years and decadal averages over 10 consecutive years) from AD 1000-1980, with those from the recent instrumental record (1981-1998), and centered on the fact that the recent instrumental values were outside the error range of the reconstructed values over the past 1000 years and were not related to the smoothed curve."
    and b) The smoothing technique used by Mann in MBH 98 and MBH 99 do not significantly effect the visual appearance. (Original text snipped to correct error) Original smooth shown in blue, amended technique shown in green. : Shollenberger says he wants people to stop saying untrue things about simple facts. We will be able to determine the strength of his desire by whether he in fact stops doing just that.
    0 0
  14. It's amusing how the skeptics continue to try to bring down the hockey stick as if the entire body of knowledge on global warming rests on a single study done in the 90s.
    0 0
  15. Alex C, you can see the effect of the decision in the link I provided. The visual impact is undeniable. If one uses the method Mann used (including his Butterworth filter) without appending the instrumental series to the reconstructed series, the series ends on a downturn. That's the opposite of what the instrumental series shows. It's obviously something readers should be informed about. As for the data not dropping to zero, you are right. You can find an explanation via the link I provided, but the simple version is when one smooths a series, the ends of the series can't be treated the same as the middle. You just don't have any data on the edges to use for averaging. To address that problem, sometimes "padding" is used. This is a process where data is artificially generated to be used in the smoothing function. There are a number of ways of doing it, but in Mann's case, he padded the series with zeroes (the mean of the instrumental record during the calibration period). By padding the end with zeroes, he forces the data to trend to zero. You can debate whether or not Mann's approach was right. You can say he should have done something else. I won't disagree. However, the point here is given the methodology Mann used, his figure should have been notably different. The only reason it isn't is he spliced instrumental data onto his reconstructed series. And that is "Mike's Nature trick." It is not merely plotting two series together as this article claims.
    0 0
  16. Shollenberger @165:
    "You can debate whether or not Mann's approach was right. You can say he should have done something else. I won't disagree. However, the point here is given the methodology Mann used, his figure should have been notably different. The only reason it isn't is he spliced instrumental data onto his reconstructed series."
    So, given that Mann used a particular method it should have looked one way, but it looks different because he didn't use the method that he used. Got it!
    0 0
  17. Tom Curtis, you claim I haven't provided "substantial evidence" for my description of the trick. The link I provided contains links to exactly that. In fact, one link provides code to exactly replicate what was done. Given that, your points 1-3 are without merit. As for your point 4, you claim "fake climate-auditors" use the term "Mike's Nature trick" to give a false impression. The reality is people like Steve McIntyre have gone to great lengths to explain just what was done, and by who. Your accusation here is without basis, just like the rest of your disagreement has been As for your point 5, it's hard to tell exactly what you're showing when you provide nothing but an image with no legend, caption or source. Since the image you provide is different than images provided with the code needed to replicate them, one could safely dismiss it as is. There is simply no way to know what was actually done in it. To put it simply, code has been provided which allows one to exactly replicate the results stated by Steve McIntyre. Nobody has shown any mistake in that code. Dismissing the results without showing any flaw in them is inappropriate.
    0 0
  18. Tom Curtis @166, if you have a question about what I said, I'd be happy to clarify. However, if all you want to do is mock a comment because you think it is wrong, I don't see anything worthwhile coming from it.
    0 0
  19. Shollenberger @168, I was merely pointing out that your claim as written contradicts itself. If you cannot recognize the contradiction, that is not my problem.
    0 0
  20. Hi Tom, Brandon is merely recycling longed debunked claims made by the self-styled "auditor". DeepClimate has long ago addressed McIntyre's efforts to mislead readers of a UK newspaper and do what he likes to do, make mountains out of molehills, and then suggest misconduct by certain climate scientists (oddly, almost never "skeptics") . In fact, McIntyre's missive and distortion of the facts was so bad that DeepClimate had to split up his rebuttal into two parts. The second one can be found here. DeepClimate concludes [my highlights]: "Judging from his recent presentation at the Heartland Institute sponsored International Climate Conference, it appears that Steve McIntyre has not changed his narrative and interpretation of the "climategate" emails of September 1999. Neither is there any indication, as far as I know, that McIntyre has responded to the facts presented above. Based on currently available information, then, McIntyre appears to have chosen option (b) and has ignored the evidence, at least so far." Now had Mann posted such an article as McIntyre's in a newspaper, I'm sure allegations of "fr@ud" would be rampant by the usual suspects who specialize in promulgating misinformation, feeding fodder to the skeptics and attacking climate scientists. It is sad that some are so willing to (knowingly?) defend the mendacious actions and flawed arguments of people like Mr. McIntyre.
    0 0
  21. Shollenberger @167, code for a purported reconstruction of a smoothing technique is not evidence that that smoothing technique was "Mann's Nature trick". Before the reconstruction of the smoothing technique can be evidence of what is involved in the "Nature trick", you must first establish that the smoothing technique used in MBH 98 was the trick that either Jones referred to or that Mann understood Jones to be referring to. McIntyre provides exactly zero evidence on this point. He merely asserts it. I do not expect you to appreciate this point as your ability to condemn depends on your not understanding it. But so much, therefore, for your commitment to truth.
    0 0
  22. @Brandon Shollenberger #167: >>>To put it simply, code has been provided which allows one to exactly replicate the results stated by Steve McIntyre. But if McIntyre did not accurately describe what Mann did then the code he provided to allow others to replicate his results will only cause others to replicate his inaccurately applied description. Tom's point was that Mann used the mean of the instrumental data to pad, not the instrumental data itself. I again propose you're making a mountain out of a molehill. The paper's conclusions would stand with or without the filter and as such the different padding choices would have (a) a marginal effect on the endpoints and (b) no impact on the paper's conclusions. I would contend that choosing zeros for a padding method at the end is the wrong thing to do, too. The tree ring data was calibrated to reflect temperatures of the northern hemisphere, so the better thing to do would be to use actual NH data, if it existed (which it just so happened to).
    0 0
  23. Shollenberger, to establish one simple fact, you claim that:
    "The trick actually consists of splicing instrumental data onto the reconstructed series (starting at 1980), smoothing the resulting series, then truncating the series at the point the instrumental data had been appended."
    (My emphasis) As, according to you and McIntyre the instrumental data was appended from 1980 onwards, this would mean that the smoothed series terminates in 1980. Is that correct?
    0 0
  24. I get so tired of deniers trying to knit pick Mann (a very, very small part of the climate puzzle) to death, while: 1) No one has ever succeeded in demonstrating that the MCA was warmer than current temps, and if it is then that's bad, not good, news for the future climate. 2) Multiple studies, done in a variety of ways, have reinforced Mann's original conclusions. 3) The number of hockey sticks we see in the world -- from temps to sea ice to extreme events -- is increased every day. Really, this is getting tiring. Deniers need to stop focusing on Mann and either put up or shut up, as far as "proving" their point. The complete failure of the denial movement to generate any actual, factual arguments sort of makes this nonsense about Mann crystal clear -- it's a distraction from reality, because it's the only place where deniers think they can remotely "win", and then only because no one really cares (except for Steve "The Auditor" McIntyre)!
    0 0
  25. Sphaerica @174 and Alex @172, Hear, hear! What this nonsense essentially amounts to is people like McIntyre being obsessed by a paper from almost 15 years ago, engaging in an orchestrated and mendacious vendetta against climate scientists and using any opportunity (real or imagined) to shout "Squirrel!". In the meantime, while we fiddle Rome burns...
    0 0
  26. Tom Curtis @169, there is no contradiction in saying results generated by a particular methodology are different than the results generated by the same methodology applied to a different data series. @171, McIntyre shows what was done in Mann's work that appeared in Nature. The e-mail in question is discussing a figure with three lines. One is Mann's work being referred to in my discussion. Another is from Keith Briff's work. Phil Jones says, "I’ve just completed Mike’s Nature trick of adding in the real temps to each series for the last 20 years (ie from 1981 onwards) amd from 1961 for Keith’s to hide the decline." It is obvious what work he is referring to. Phil Jones referred to a trick in Michael Mann's work "of adding in the real temps to each series for the last 20 years." Steve McIntyre discusses Mann having appended 18 years of instrumental temperature data to his reconstructed temperatures. "Mike's Nature trick" is exactly what Steve McIntyre says it is.
    0 0
  27. Indeed. We should create a new "Law" rule, aka Godwin's Law: Mann's Law: "As an online discussion about climate science grows longer, the probability of a comparison involving Michael Mann to tricks/fraud/misconduct/secret cabals/world domination is inevitable." Corollary to Mann's Law: "Once such a comparison is made, the thread is finished and whoever mentioned Michael Mann has automatically lost whatever debate was in progress; the coupling of this corollary with the initial statement of the law proves every threaded discussion to be finite in length."
    0 0
  28. Methinks Brandon is sounding shrill.
    0 0
  29. Brandon: "The reality is people like Steve McIntyre have gone to great lengths to explain just what was done, and by who." I believe you've hit upon the problem, Brandon.
    0 0
  30. Tom Curtis @173, yes, that's correct. And as Steve McIntyre (as well as many others) has pointed out, Phil Jones did not truncate the series as Michael Mann did. This means what he did is not actually the same as what Mann did. But that has no bearing on the fact Michael Mann appended instrumental temperature data to his reconstructed historical record, smoothed the resulting series then published that (truncated at 1980) as a reconstructed historical series. It also has no bearing on the fact this Skeptical Science article contains a factual error.
    0 0
    Moderator Response: [DB] Note that a laser-like focus on some minor technical point doesn't alter a paper's conclusions at all.
  31. Shollenberger @180: Detail of fig 5 of MBH 98: (Red marks added to show 1900 and 1950) Please note that the smoothed curve terminates around 1973, not 1980. Clearly, therefore, McIntyre's reconstruction of Mann's "third step" is incorrect. You will note, of course, that no matter how carefully we examine McIntyre's code, it will not make the smoothed curve MBH 98 terminate in 1980. So, here is the question, will you acknowledge that McIntyre's reconstruction of Mann's smoothing method did not in fact successfully reconstruct that method? Or will you continue to "say untrue things about simple facts"?
    0 0
  32. Shollenberger @180:
    "But that has no bearing on the fact Michael Mann appended instrumental temperature data to his reconstructed historical record, smoothed the resulting series then published that (truncated at 1980) as a reconstructed historical series. It also has no bearing on the fact this Skeptical Science article contains a factual error."
    You certainly like throwing out falsehoods. MBH 98 contained a reconstruction of temperatures over the last 600 years at annual resolution. The smoothed line was not the reconstruction and has not been claimed to be the reconstruction by Mann or his co-authors. The claim that it is the reconstruction is an invention by fake climate-auditors who, by that invention pretend they are making substantial criticisms when they are quibbling about irrelevancies. Again, I quote Michael Mann:
    "In some earlier work though (Mann et al, 1999), the boundary condition for the smoothed curve (at 1980) was determined by padding with the mean of the subsequent data (taken from the instrumental record). This does make a small difference near the end of the series. It doesn't effect any of the conclusions drawn in the paper though. These were based on comparisons of the individual reconstructed annual values (individual years and decadal averages over 10 consecutive years) from AD 1000-1980, with those from the recent instrumental record (1981-1998), and centered on the fact that the recent instrumental values were outside the error range of the reconstructed values over the past 1000 years and were not related to the smoothed curve. This figure shows the comparison of the originally published result with an alternative smoothing based on our more recent approach which does not use any instrumental data."
    (My emphasis) Again, when will you stop "saying untrue things about simple facts"?
    0 0
  33. Shollenberger @183:
    "@181, that's a dashed line. You are saying a gap in a dashed line means the series terminated earlier than I say."
    1) It is a dashed line that just happens to end 25 years after the start of the series (1400 AD) and 25 years before the end of the instrumental record with both gaps being wider than the gaps than the typical gap between dashes. But lets ignore that inconvenient evidence (as it becomes apparent you are wont to do). If the actual dashed line ends 7-8 years prior to 1980, how could McIntyre know that the truncation was to 1980? At the very best he is relying on a bald assertion to claim his reconstructed technique was Mann's technique. Of course, the smoothed curve in MBH 99 terminates one or two years before 1980, in contradiction to McIntyre and consistent with a 40 year smooth with the end point of the padded data being 1998. How odd. Let me guess, is that also because its a dashed line?
    "One of the reconstructions [in an SkS post] was Mann's hockey stick. It, and all the other reconstructions in the figure, are smoothed. I take this to mean Skeptical Science is okay with people calling smoothed versions of temperature reconstructions temperature reconstructions. It technically isn't true, but effectively it is."
    2) It is one thing to use a smoothed curve of a reconstruction to represent a reconstruction in popular exposition. It is an entirely different thing to treat the smoothed curve as being the actual reconstruction so that you can impute malfeasance. You are clearly evading at this point. You have been shown to be straight forwardly wrong on two counts. Fess up, or show that you are quite happy with people saying untrue things about simple facts, so long as it is you saying the untruths.
    0 0
    Moderator Response: TC: Edited to add quotes from a deleted comment to provide context, and so that that part of his claims not in direct violation of the comments policy can see light of day. (DB, feel free to delete this post if you think that crosses any boundaries.)
  34. Albatross, I'm a very open person, and I'll happily answer questions people have for me. However, my last comment here got deleted. I don't know why it was, and since I apparently don't know how to post here without getting moderated, I don't think I'll be answering questions here. But anyone should feel free to get a hold of me elsewhere if they have questions for me.
    0 0
    Moderator Response:

    [DB] Your previous comment received moderation due to a combination of inflammatory insinuations and moderation complaints. As has this one.

    The vast majority of participants in this venue never need nor receive any moderation, as they construct their comments to be in compliance with this site's Comments Policy. Having forced moderation on yourself in the past, this should come as no surprise to you.

  35. I have sometimes thought that Mann 98 and the mention of "trick" retains traction by the deniers is because the paper and the comment were directed at an audience then that is different from the audience receiving it now. The audience then was more limited and all the members were quite familiar with the divergence problem. Not showing the declining (negative?) correlation in the graph in no way changed the knowledge base of the audience members at the time. Everyone had the same knowledge and no one was deceived, or felt that they had been. The audience today is broader and less informed, and so not showing it has the appearance (only) of an attempt to deceive, at least to some that don't like the implications of the data.
    0 0
  36. Brandon, I am an open person too, so are all the people posting here. I am not sure what the point of you saying that is. Numerous of my comments here at SkS have been moderated (no one's fault but mine I might add), and IIRC even deleted (again, my wrong doing), but that is not an excuse for me or anyone else to stop posting here or to avoid answering direct questions. So please stop making excuses and avoiding answering the question; I have posed it to you again on the relevant thread here and would be very grateful if you answered it. Thank you.
    0 0
  37. Daniel Bailey, I have a copy of my deleted comment, and no matter how many times I reread it, I can't figure out what in the world you're talking about. I'm going to take that as a sign I shouldn't post here anymore. I apparently just can't figure out how to do it successfully.
    0 0
  38. Brandon, you used what in sales and marketing is called a presumptive internal call for agreement for an implied conditional statement; an agreement equivalent to saying "if beating your wife is unacceptable on this site..." Stick to the science instead of ideology and spin and you will find, like most participants here, that this site is a haven of adult dialogue (and moderation-free) in a blogosphere predominantly adolescent in nature. It really isn't all that difficult. I recall a 14-year old girl posting here with no difficulties whatsoever.
    0 0
  39. Brandon... We've all had our comments deleted from time-to-time here. I've written articles here, I'm pro-AGW, and occasionally I step over the line and get my comments deleted. This is not an "anything goes" website. It's more of a regulated boxing match here with rules on how to keep the fight clean and fair. It's not a cage match like many other climate related sites. And I know this is off topic so that's all I'll say. Thx.
    0 0
  40. Sphaerica - That you don't care is interesting. When the "hockey stick" was first shown to the public in presentations and documentaries, I don't believe this truncation and appending was made clear. They were trying to prove a point, and they didn't want to muddy the waters. Well, whether you care or not, the waters are muddy now!
    0 0
  41. Hameiri... If anyone bothered to actually read the papers it would be clear what Mann was doing. Heck, the color version of the graph clearly uses a different color for the instrumental record. What more can you want? Also, Sphaerica didn't say that "he" doesn't care, he said, "no one" cares. I have to agree with him. It's really a completely pointless exercise to "audit" a scientific paper the way McIntyre has. Scientists are allowed to get things wrong! But wrong results become apparent when further research shows things to be different. That's not what has happened with Mann's work. Further research has, in fact, confirmed MBH's conclusion... repeatedly. So far no multiproxy reconstruction has shown anything other than what MBH showed. So, the "skeptics" need to put up or shut up. Either produce a good quality reconstruction that produces results that calls the other research into question, or... (self snip)
    0 0
  42. Hameiri - Rob Honeycutt is quite correct. The _right_ way to disprove someone's conclusions is to provide your own, with better support from the evidence. Every year there are more science papers submitted. Many don't get through peer review due to obvious mistakes. Others pass peer review, and are found lacking - additional papers point out the issues, and we learn, and we move on. Others are found to be rather pointless (gravity proven for the Nth time!) and are just ignored. There are no paleotemperature reconstructions that contradict the basic conclusions of Mann's work, whether the initial 1998 paper or later ones (including by Mann himself) - recent warming is faster, and currently warmer than, any time in the last few thousand years. If you disagree, present your evidence and let everyone take a look at it. That's science, not whining about minutia and claiming it invalidates the broad strokes of the work in the field. And so far, skeptics have not ponied up...
    0 0
  43. Hameiri @190, when the so-called hockey stick was first presented to the public by Nature in 1998, there was no truncation. MBH 98 and MBH 99 did not use any data with a divergence problem, so there was no "hide the decline" either, which is a separate issue. Nor was the proxy record extended by the use of instrumental record. Individual proxies that terminated before 1980 where extended to 1980 by persistence, ie, by repeating the last value up until 1980. As proxies tended to follow temperature, and temperatures were rising in the 20th century, this would introduce a cold bias to the proxy record in the 20th century. Instrumental values were used to create end points beyond 1980, ie, where no proxy record existed, in creating the smoothed function. However, as discussed above, the smoothed function was not the reconstruction, and was not used in deriving any scientific results. What is more, using other methods (persistence, proxy mean, mean of last 25 values) all represent a choice to "predict" that global temperatures cooled significantly after 1980 and that therefore the proxies would show that "cooling" when in fact we know global temperatures warmed. This is what really annoys the fake skeptics about Mann's choice with regard to smoothing. He chose not to show a cooling in the smooth which he (and they) knew to be spurious.
    0 0
  44. Brandon, if Mann's so called 'trick' is so central to your critique of mainstream climate science,and results in what appears to be nit-picking on your part,what then,do you make of the many errors that the 'skeptical' climate scientists have been called on? Do you or McIntyre,Watts,etc. endlessly probe the minutiae of those scientist's works for any cracks in the facade of their scientific credibility,searching endlessly for fraud? Point me to any 'climate skeptics' who did this same level of trashing of the Douglas et al 2007 paper for example. Why do I have the feeling that you have only challenged the consensus climate science?
    0 0
  45. Not sure it's worth adding this, but given that I'm playing the polymath today I may as well dig myself a hole... From a literary theory perspective there is not one 'Mikes' Nature Trick'. There are lots of different ones. Which one of them is real is a non-trivial question. Whether you can even claim one of them as 'real' is also a genuine issue. Here are the versions I identified after a too-brief consideration. 1. The calculation Mike did. 2. The calculation Mike thought he was doing at the time he did it. 3. The calculation Mike wanted the readers of MBH98 to think he had done. 4. The calculation a reader of MBH98 might infer from the text that Mike had done. (Technically there are as many of these as there are readers, although we could probably reduce that to a list of common interpretations.) 5. The calculation Mike thought he had done years later when the issue was first raised. 6. The calculation Mike thought he had done after checking back over what he had done. 7. The calculation Jones thought Mike had done from MBH98. (An instance of point 4) 8. The calculation Jones thought Mike had done on the basis of subsequent communications. (There may be multiple examples of these.) I suspect some of the confusion arises from the fact that we don't clearly distinguish which version of 'Mikes's Nature Trick' we are talking about. All this is fascinating if you are a literary theorist, but given the only impact is an irrelevant tail of an early and outdated analysis, it bears no relevance to the science. The fact that this article even had to be written, let alone that we have to discuss whether it is right, and get into these details, show how far the public debate has perverted the scientific process. MBH98 was groundbreaking science. Groundbreaking science is usually flawed, and gets refined in subsequent work. The subsequent work is probably still wrong. Give it another 30 years and we'll probably have a fairly clear picture. However to pretend this is pivotal to climate science or any political implications it may have represents at the very least a failure of perspective.
    0 0
  46. An Irishman was travelling in South America, where he fell in with two climate science deniers. They travelled together for a bit, but then had the misfortune to be captured by a gang of bloodthirsty banditos. These banditos had little use for foreigners so decided to execute them on the spot. As usual in these jokes, the three were allowed one last request. "Well," the first denier said "I will take time to tell you about the iniquitous Professor Michael Mann and his nororious Hockey Stick." "And, me "said the second denier, "I will tell you about the disturbing Climategate e-mails from the University of East Anglia.! "Oh, J**** Chr***!" said the Irishman, "Shoot me first! I can't stand antother lecture about bl***y Michael Mann and the Hockey Stick."
    0 0
  47. shoyemore @196, that joke still cracks me up. You may be interested to know that I passed it on to some other SkS authors, one of whom passed it on to Michael Mann. He liked it!
    0 0
  48. Tom #197, Thanks. You made my day, possibly my week. :)
    0 0
  49. An Irishman was travelling in Spain around 1620, where he fell in with 2 heliocentric heritics. They travelled together for a bit, but then had the misfortune to be captured by a gang of bloodthirsty banditos. These banditos had little use for foreigners so decided to execute them on the spot. As usual in these jokes, the three were allowed one last request. "Well," the first heretic said "I will take time to tell you about the 3 stars Galileo observed and how they orbit Jupiter and not the Earth." "And, me "said the second heretic, "I will tell you about the Kepler's Supernova and how it so far away disproving the immutability of the heavens! "Oh, J**** Chr***!" said the Irishman, "Shoot me first! I can't stand another lecture about bl***y Supernovas and Heaven immutability."
    0 0
  50. The Galileo Gambit. How original.
    0 0

Prev  1  2  3  4  

You need to be logged in to post a comment. Login via the left margin or if you're new, register here.


The Consensus Project Website

THE ESCALATOR

(free to republish)


© Copyright 2024 John Cook
Home | Translations | About Us | Privacy | Contact Us