Climate Science Glossary

Term Lookup

Enter a term in the search box to find its definition.

Settings

Use the controls in the far right panel to increase or decrease the number of terms automatically displayed (or to completely turn that feature off).

Term Lookup

Settings


All IPCC definitions taken from Climate Change 2007: The Physical Science Basis. Working Group I Contribution to the Fourth Assessment Report of the Intergovernmental Panel on Climate Change, Annex I, Glossary, pp. 941-954. Cambridge University Press.

Home Arguments Software Resources Comments The Consensus Project Translations About Support

Bluesky Facebook LinkedIn Mastodon MeWe

Twitter YouTube RSS Posts RSS Comments Email Subscribe


Climate's changed before
It's the sun
It's not bad
There is no consensus
It's cooling
Models are unreliable
Temp record is unreliable
Animals and plants can adapt
It hasn't warmed since 1998
Antarctica is gaining ice
View All Arguments...


Username
Password
New? Register here
Forgot your password?

Latest Posts

Archives

How do we know CO2 is causing warming?

Posted on 8 October 2009 by John Cook

We've just perused the empirical evidence that humans are raising atmospheric CO2 levels. In earlier posts, we noted that tallying up the planet's heat content shows that our climate is accumulating heat, proof of global warming. But is there any evidence that links the two? Is there empirical data proving that increased CO2 contributes to the energy imbalance that causes global warming?

The greenhouse gas qualities of CO2 have been known for over a century. In 1861, John Tyndal published laboratory results identifying CO2 as a greenhouse gas that absorbed heat rays (longwave radiation). Since then, the absorptive qualities of CO2 have been more precisely measured and quantified by laboratory results and radiative physics theory (Herzberg 1953, Burch 1962, Burch 1970, etc).

Satellite measurements of the change in outgoing longwave radiation

So according to lab results and radiative physics, we expect that increasing atmospheric CO2 should absorb more longwave radiation as it escapes back out to space. Has this effect been observed? The paper Increases in greenhouse forcing inferred from the outgoing longwave radiation spectra of the Earth in 1970 and 1997 (Harries 2001) attempts to find out. In 1970, NASA launched the IRIS satellite that measured infrared spectra between 400 cm-1 to 1600 cm-1. In 1996, the Japanese Space Agency launched the IMG satellite which recorded similar observations. Harries 2001 compared both sets of data to discern any changes in outgoing radiation over the 26 year period. The resultant change in outgoing radiation was as follows:
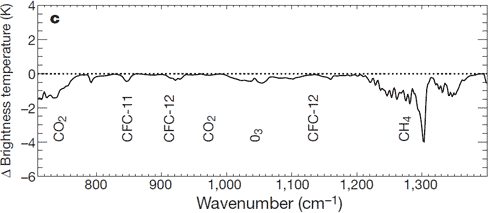

Figure 1: Change in spectrum from 1970 to 1996 due to trace gases. 'Brightness temperature' indicates equivalent blackbody temperature (Harries 2001).

What they found was a drop in outgoing radiation at the wavelength bands that greenhouse gases such as CO2 and methane (CH4) absorb energy. The change in outgoing radiation over CO2 bands was consistent with theoretical expectations. Thus the paper found "direct experimental evidence for a significant increase in the Earth's greenhouse effect".

This result has been confirmed by subsequent papers using the latest satellite data. Griggs 2004 compares the 1970 and 1997 spectra with additional satellite data from the NASA AIRS satellite launched in 2003. Chen 2007 extends this analysis to 2006 using data from the AURA satellite launched in 2004. Both papers found the observed differences in CO2 bands matched the expected changes based on rising CO2 levels. Thus we have empirical evidence that increased CO2 is preventing longwave radiation from escaping out to space.

Measurements of downward longwave radiation

What happens to longwave radiation that gets absorbed by greenhouse gases? The energy heats the atmosphere which in turn re-radiates longwave radiation. This re-radiated energy goes in all directions. Some of it makes its way back to the surface of the earth. Hence we expect to find increasing downward longwave radiation as CO2 levels increase.

Philipona 2004 finds that this is indeed the case - that downward longwave radiation is increasing due to an enhanced greenhouse effect. Evans 2006 takes this analysis further. By analysing high resolution spectral data, the increase in downward radiation can be quantitatively attributed to each of several anthropogenic gases. The results lead the authors to conclude that "this experimental data should effectively end the argument by skeptics that no experimental evidence exists for the connection between greenhouse gas increases in the atmosphere and global warming."

So we have multiple lines of empirical evidence for CO2 warming. Lab tests show CO2 absorbing longwave radiation. Satellite measurements confirm that less longwave radiation is escaping to space. Surface measurements detect increased longwave radiation returning back to Earth at wavelengths matching increased CO2 warming. And of course the result of this energy imbalance is the accumulation of heat over the last 40 years.

Acknowledgements: A big thanks must go to AGW Observer. Their lists of papers on changes in outgoing longwave radiation, changes in downward longwave radiation and laboratory measurements of CO2 absorption properties made this post possible.

0 0

Printable Version  |  Link to this page

Comments

Prev  1  2  3  

Comments 101 to 106 out of 106:

  1. Henry Pool wrote:
    The current paper shows increase in down going longwave radiation. This again may have a number of causes - whatever it is that is causing more heat on earth.. For all I know it could be aeroplanes or rockets or whatever.
    . No, Henry, it cannot be aeroplanes or rockets or whatever. It is greenhouse gases, as evidenced by the empirical measurements that show the radiation signatures of greenhouse gases. That's right there in the original post at the top of this page:
    Evans 2006 takes this analysis further. By analysing high resolution spectral data, the increase in downward radiation can be quantitatively attributed to each of several anthropogenic gases. The results lead the authors to conclude that "this experimental data should effectively end the argument by skeptics that no experimental evidence exists for the connection between greenhouse gas increases in the atmosphere and global warming." If you need more details, you need merely click that link to read the extended abstract of that Evans (& Puckrin) paper.
    0 0
  2. PaulK, in comment #96: "the temperature at TOA should be exactly the same as before more CO2 was added". No, it's not. More energy is absorbed (more on this later), temperature increases and blackbody emission follows untill balance; you need to increase emission (temperature) to reach balance. Nothing puzzling here. What is puzzling you (correct me if i'm wrong) is that you associate more absorption with more emission and then you can't see how more CO2 can increase temperature without violating Kirchhoff law. What you miss here is that IR radiation comes from the earth surface, is abosorbed in the atmosphere and part of it is sent back toward the surface. No need of a collisional mechanism to dissipate energy directly to kinetic energy. Infact, you didn't find it in the radiation trasnfer scheme of Kiel and Trenberth. Then you'll have less energy in the CO2 bands and more in the background blackbody emission. Also in comment #96: "since most of this energy loss would take place close to the ground and be overwhelmed by convective forces". But a measurable amount of energy find it's way through the atmosphere, so we have no near surface confinement of the absorbed energy.
    0 0
  3. Riccardo #102 I think you have taken a part of what I said out of context. I stated that: "If the imaginary Earth does indeed act like a black body emitter, then the temperature at TOA [in our imaginary model] should be exactly the same as before more CO2 was added (Stefan-Boltzman), since the total flux, we agree, has to be exactly equal to our conveniently constant solar flux." Note the conditional clause. I am trying to stay within basic physics here. If the Earth at TOA acts like a blackbody, then, by definition, the total flux is solely a function of temperature (Stefan-Boltzmann), as is the wavelength of maximum emission intensity (Wien's Law). Since under our simplified model we have a constant ingoing and outgoing radiation, then the temperature at TOA must be exactly equal to the temperature before CO2 addition. If not, then our simplified Earth at TOA is not behaving like a blackbody. Hence my question regarding the relevance of the application of Stefan-Boltzmann in your view of the universe. Your second paragraph talks about energy, and your argument is plausible if we consider just a single packet of energy. However, in order to restore equilibrium to our simple system we have to balance ingoing and outgoing POWER rather than energy at our TOA, so we cannot accept a solution which leads to ever-increasing accumulation of energy within the troposphere. Hence, to achieve radiative balance in POWER AND to observe a dip in net flux at CO2 wavelengths, the energy in the CO2 wavebands must be CONTINUOUSLY dissipated into other wavelengths. A simple return of photons downwards is fine for a while, but eventually they have to find their way back up again (and out of the system). If not, then I still cannot see an alternative to kinetic thermalisation.
    0 0
  4. thanks Tom! But let me not go off in a tangent now, I merely wanted to say that all original CO2 (from whence life and vegetation came) was produced during volcanic activity which does produce heat so there must be a causal link between the heat of a planet and CO2 content no matter how small or big that correlation coefficient (CO2 versus heat from volcanic activity) may be. So ice core analysis alone is not enough (for me). Global warming is not in doubt, but you must admit that there could be a number of causes other than CO2, not least the variation in light that we have from the sun. But like I said,I am keeping my mind open. I did go through all the papers mentioned by John in this article but I did not come across the answer to my question. The papers only talk about the warming effect of carbon dioxide, not the cooling effect. In fact, the absorptions of carbon dioxide in the near infra red and the cooling effect of carbon dioxide are completely ignored. As did the paper you advised me to read. Now what would you do if anyone came to you and said: listen ozone is causing serious warming of the planet i.e. upgoing thermal radiation from earth at 10 um being blocked. We have to get rid of it! I am sure the answer you would give him: yes, it is true that ozone causes some warming but it also blocks a lot of sunlight from the sun, especially in the UV range! You must be an idiot to think we have to get rid of it. Likewise I am answering you now: yes it is true that carbon dioxide causes some warming but it also blocks a lot of sunlight especially due to its absorptions bands in the 1 - 5 um range. If I look at it carefully it looks to me that it is pretty much evens, i.e. the cooling could be as much as the warming effect. Now it is up to you (the scientists working on this problem) and the people responsible for putting the CO2 in the air (the oil companies) to do the research that will prove that I am right or wrong in my assessment. We do not need stories or reflections. We need actual figures from actual measurements taken during actual experiments. And if the oil comapanies will not give us the results, then we must sue them, blaming them for global warming, like we did with the cigarette companies. I am sure that if we take this route quickly we will have the answers that I am looking for.
    0 0
  5. Henry Pool wrote:
    There is strong absorption at 14-15. It leads to some of earth's radiation not being emitted. Note that oxygen also has a very weak band here and water also absorbs here. These 2 gases have much higher concentrations than carbon dioxide so it is difficult to see or know exactly what the influence of the carbon dioxide on its own.
    Henry, the apparent overlap of absorption wavelengths by CO2 and water vapor is just that--only apparent due to the low resolution of that graph. Early investigators were misled by the same thing, because their crude equipment and methods could not reveal the gaps and spikes that really exist inside those apparently solid bands, especially at low temperature and pressure. But then starting in the 1940s:
    Scientists were especially struck to find that at low pressure and temperature, each band resolved into a cluster of sharply defined lines, like a picket fence, with gaps between the lines where radiation would get through.(24) The most important CO2 absorption lines did not lie exactly on top of water vapor lines. Instead of two overlapping bands, there were two sets of narrow lines with spaces for radiation to slip through. So even if water vapor in the lower layers of the atmosphere did entirely block any radiation that could have been absorbed by CO2, that would not keep the gas from making a difference in the rarified and frigid upper layers. Those layers held very little water vapor anyway. (Quoted from Spencer Weart's The Discovery of Global Warming, the chapter The Carbon Dioxide Greenhouse Effect.)
    An example of magnified graphs was created by "Phil. Felton" and linked from his comment on RealClimate. His example is a magnification of the 15 um wavelength where CO2's absorption has an apparently solid bump on the lower resolution picture from GlobalWarmingArt.com. I think his top graph is CO2 and his bottom graph is water vapor. (The axes of those graphs are transmittance--the reverse of the lower resolution graph's axes being absorption.) But in fact, there is no single graph that is correct for all temperatures and pressures. The ones we've been looking at in our conversation on this Skeptical Science site not only are too low resolution to show the gaps, but they are too integrated across all temperatures and pressures. In reality, you need a different graph for each combination of temperature and pressure. You can create your own plots with the SpectralCalc.com online calculator. Instructions and examples are on Rabett Run. A clearer graphic example is in his post on Pressure Broadening. You should continue following the story of how scientists became able to deal with all those dependencies on temperature and pressure, by reading Weart's A Saturated Gassy Argument. Find the paragraph that starts "Still more persuasive," and read from there down. Then read Part II.
    0 0
  6. Tom, did you miss the my latest question that I posted? Forget about temp. and pressures, it is irrelevant for my argument. CO2 is 100% diffused into the air so the way for radiation up is the same as the way it comes down from the sun. The only difference is the wavelengths. Weart only has nice stories but no figures. Here is my question to you and John again: Now what would you do if anyone came to you and said: listen ozone is causing serious warming of the planet i.e. upgoing thermal radiation from earth at 10 um is being blocked. We have to get rid of it! I am sure the answer you would give him: yes, it is true that ozone causes some warming but it also blocks a lot of sunlight from the sun, especially in the UV range! You must be an idiot to think we have to get rid of it. Likewise I am answering you now: yes it is true that carbon dioxide causes some warming but it also blocks a lot of sunlight especially due to its absorptions bands in the 1 - 5 um range. If I look at it carefully it looks to me that it is pretty much evens, i.e. the cooling could be as much as the warming effect. Now it is up to you (the scientists working on this problem) and the people responsible for putting the CO2 in the air (the oil companies) to do the research that will prove that I am right or wrong in my assessment. We do not need stories or reflections. We need actual figures from actual measurements taken during actual experiments. And if the oil comapanies will not give us the results, then we must sue them, blaming them for global warming, like we did with the cigarette companies. I am sure that if we take this route we will quickly have the answers that I am looking for.
    0 0
  7. PaulK, maybe i missed your point in the statement "if the imaginary Earth does indeed act like a black body emitter". Do you mean a body with infinite absorption and emissivity equal to 1? Only in this case you would have a constant temperature because there is no way to change the output flux. "we cannot accept a solution which leads to ever-increasing accumulation of energy". Where is the infinite accumulation of energy in my secondo statement? The energy sent back toward the surface which is what acctually causes temperature increase?
    0 0
  8. Have patience, Henry. You have asked several questions and made several incorrect statements, so several of us have been responding to those. If you want the answer to only one question, ask just that one question. My comment 105 actually is part of the answer to your latest question. Philippe Chantreau and Riccardo (multiple replies) already answered you well, but I'll try rephrasing for you. Part of our difficulty in answering you clearly is that you used the terms "reflected" and "mirror," which imply scattering, which is a completely different phenomenon than the absorption and re-emission that is the basis of CO2's greenhouse effect. Don't use those terms "reflected" and "mirror." You wrote:
    Yes it is true that carbon dioxide causes some warming but it also blocks a lot of sunlight especially due to its absorptions bands in the 1 - 5 um range. If I look at it carefully it looks to me that it is pretty much evens, i.e. the cooling could be as much as the warming effect.
    Your impression of the graph is incorrect; the absorption of the downgoing and upgoing radiation do not even out. The absorption above 4 um unequivocally outweighs the absorption below, so the absorption of upgoing radiation unequivocally outweighs the absorption of downgoing radiation. Print that graph and use a ruler to draw a vertical line connecting the two x-axis tick marks for 3 um, and do the same connecting at 4 um. Notice that the sum of the areas of the CO2 absorption gray bumps clearly is greater above 4 um than below, and is nearly zero in the downgoing/upgoing overlap between 3 and 4 um. You also wrote "We need actual figures from actual measurements taken during actual experiments." Yes, and you have been looking at them all along. That graph was created from those experimental data. Philippe Chantreau pointed you to just one of many scientific papers that describe how those data are gotten. If you search the internet for "iacono and clough 1995" you will find the abstract of that paper. At the bottom of that paper you will find the pointer "Many of the results from the spectral calculations reported here are archived at the Carbon Dioxide Information and Analysis Center for use by the community." If you search the internet for "Carbon Dioxide Information and Analysis Center," you easily will find it, though I already pointed you to its World Data Center for Atmospheric Trace Gases. Those huge volumes of experimental data also are used by the SpectralCalc.com online calculator/grapher that I pointed you to. The "stories" by Spencer Weart that I pointed you to and that you dismissed out of hand, are important because they describe the gathering of that experimental data that you are asking about. A bibliography of scientific peer-reviewed papers describing the gathering of the experimental data is pointed to by John Cook at the top of this article, in the green box labeled "Acknowledgements." (It's the AGW Observer site.) It's important for you to realize that the summary graph is not what scientists actually use to calculate the net of absorption and re-emission of downgoing versus upgoing radiation. Instead they use the actual, very detailed, data that were used to create that high-level graph. So eyeballing the graph can yield only an approximate conclusion. More important is that the calculation of the net cannot be done even from a single set of those numbers. Instead, there is a set of those data for each of the many, many layers of the atmosphere--layers that differ in temperature, pressure, mixture of gases, and other factors. The "layers" I'm talking about are not just troposphere versus stratosphere, but instead the many layers within each of those. Those detailed calculations are described in the "stories" about saturation that I pointed you to in my previous comment.
    0 0
  9. Henry Pool wrote: "Global warming is not in doubt, but you must admit that there could be a number of causes other than CO2, not least the variation in light that we have from the sun." No, Henry, variation in light from the Sun cannot be the cause of the recent global warming. See the Skeptical Science post It’s the sun.
    0 0
  10. Regarding CO2's increased reflection of the Sun's incoming light back to space as a possible offset of CO2's increased trapping of heat: Henry Pool wrote in 76: "Yes, I am talking about the the radiation from the sun hitting on the carbon dioxide. A large portion of that radiation must be scattered away to outer space." Riccardo correctly responded in 77: "The intensity of the scattered light depends on the size of the partiicle and CO2 is quite small; on the contrary, water vapour tends to form liquid droplets (or ice crystals) which are several order of magnitude bigger than a single molecule. Hence droplets suspended in air scatter incoming sunlight much more efficiently than CO2 molecules, the latter being negligible." Riccardo followed up with even more clarity in 79: "You have to consider the different wavelength range in the two cases. In the visible range (sunlight coming in) the CO2 effect is definitely negligible, there's no significant absorption nor scattering. No cooling, as you call it. As for the radiation coming from the earth surface (infrared going out), there's no significant scattering as well but there's absorption (at certain characteristic frequencies). Again, no cooling." But Henry Pool persisted, and in 87 asked: "How were the tests done to determine that the warming effect of carbon dioxide is greater than its cooling effect? Where are those figures?" So I asked an atmospheric scientist and got this response: "CO2 is indeed a good Rayleigh scatterer--2.5 times better than air--but this matters only when CO2 becomes a major atmospheric constituent, comparable to N2 and O2 today.... It does not in any way affect modern global warming." CO2's current concentration in the atmosphere is only about 0.04%, compared to N2's 78% and O2's 21%. You can see quantitatively just how much CO2's scattering is irrelevant to the Earth's albedo with today's atmosphere, by looking in Kasting & Ackerman (1986)*, that article's middle graph in Figure 1. Earth's albedo (the solid line in the graph) does not rise above its current level despite increasing CO2, until CO2 gets up to 1 bar of pressure! (That could be either 100% of the atmosphere at the current total atmospheric pressure of about 1 bar, or a smaller percentage of a hugely larger total atmospheric pressure.) * James F. Kasting & Thomas P. Ackerman. (1986). Climatic Consequences of Very High Carbon Dioxide Levels in the Earth's Early Atmosphere. Science, 234(4782), pp. 1383-1385.
    0 0
  11. @ Tom on 105: In the 14-15 region where both CO2 and water absorb, CO2 appears insignificant because of its lower concentration. But maybe there is a cumulative effect. Especially when the radiation leaves the range where there is still water. Difficult for me to say anything about that. Like I said before, I think we can keep pressure and temperatures and even water out of our equations because we know the CO2 is 100% diffused in the air. So the way for radiation down is the same as up. Surely my question is simple: How much of the radiation from earth in W/m2 is being blocked by the carbon dioxide and how much of the sun's radiation in W/m2 is being blocked by the carbon dioxide. We have to compare those two results. We have to know the nett effect in W/m2. Bear in mind that we have 12 hours per day sunlight and we have 24/24 radiation going up. Are there no satellites up in the air somewhere where we can measure this on a clear day? @ Tom on 108 I am not going to try and measure this. I don't know how the spectral intensity was scaled. I posted my question. I think we must not underestimate the amount of energy coming from the sun that is being blocked by the carbon dioxide in the various absorption bands between 1.4 and 5 um. This is the warmer type of radiation. I sent quite a few e-mails to Weart trying to get same answer - about the nett effect of cooling and warming - and he could not supply it. When it comes to carbon dioxide, nobody has any figures. If you think it is right in front of us, why don't you just give me the measured results? I will check its authenticity and be happily on my way. But the truth is: there are no figures. I feel like I am the only one who is standing up and ask for it. Just because I want to know. @ Tom on 109 OK, so it not the sun. That was interesting. But maybe it is the moon. Maybe it is the our whole solar system that exerts extra gravitational force on earth during the past 100 years causing warming. WHO KNOWS. If it is us (which is indeed most likely) then there are still at least three options other then carbon dioxide that could cause global warming. So let us keep our minds open. If it is carbon dioxide then it must be possible to give me the relevant figures. If not now, then sometime in the future. @ Tom on 110 quote: Riccardo correctly responded in 77: "The intensity of the scattered light depends on the size of the partiicle and CO2 is quite small; on the contrary, water vapour tends to form liquid droplets (or ice crystals) which are several order of magnitude bigger than a single molecule. Hence droplets suspended in air scatter incoming sunlight much more efficiently than CO2 molecules, the latter being negligible." SO WHAT ABOUT THE RADIATION COMING FROM EARTH? SAME APPLIES Riccardo followed up with even more clarity in 79: "You have to consider the different wavelength range in the two cases. In the visible range (sunlight coming in) the CO2 effect is definitely negligible, there's no significant absorption nor scattering. No cooling, as you call it. As for the radiation coming from the earth surface (infrared going out), there's no significant scattering as well but there's absorption (at certain characteristic frequencies). Again, no cooling." how much can be "absorbed"? read the definition of the greehouse effect. You and Riccardo are ignoring again the whole argument that we had before about that page two of your famous document: "the global warming debate" where you were all misled and where you can clearly see on the solar radiation spectrum that there is cooling (I have a better graph that shows the cooling of carbon dioxide even better.) Sorry Tom, but the same also applies to what your friend said. If they say the cooling effect is next to nothing then I can also say the radiation being blocked from earth must be next to nothing. The concentration is the same everywhere. Forget about pressures etc. that is all just not relevant for our simple question. Let us not go down that route again. We do not want stories that nobody can verify. We want actual figures. From actual measurements. Taken during actual experiments. The oil companies must pay for this research. Let us stick to our simple question: How much of the radiation from earth in W/m2 is being blocked by the carbon dioxide and how much of the sun's radiation in W/m2 is being blocked by the carbon dioxide (at current concentration or per 0.01 %). We have to compare those two results. We have to know the nett effect in W/m2. Bear in mind that we have 12 hours per day sunlight and we have 24/24 radiation going up.
    0 0
  12. Henry Pool, "Sorry Tom, but the same also applies to what your friend said. If they say the cooling effect is next to nothing then I can also say the radiation being blocked from earth must be next to nothing." Being called into question as a friend of Tom (my honour :)), I will try again in a different way to clarify the different behaviour of sunlight and infrared with respect to CO2. I'll use some aproximate numbers (let me keep just a couple of decimal digits) that appears to be what you are looking for. We have sunlight coming in, similar to blackbody radiation at temperature T=5250 K: 1) no scattering; we have the opinion of a physicist of the atmosphere (i'm not). You could also google for Rayleigh scattering if you like. 2) no absorption in the visible 3) absorption in the IR. Even assuming that it's totally absorbed by CO2 in the main band at 600 cm^-1, it is roughly 10^-5 of the total incoming energy. We can safely call it zero. Infrared emitted toward space: 4) no scattering again 5) absorption by CO2, about 1.7 W/m2 more than a century and something ago. Hence, the net forcing is 1.7 W/m2. That's schematically it. You will not agree with one (or more) of these points. Tell us which, maybe it will be easier to understand what is your point. "We do not want stories that nobody can verify. We want actual figures. From actual measurements. Taken during actual experiments." You can verify all of the five points above. But do not look in climate papers, you will not find anything usefull there. It's pretty old and well established 19th century physics and for sure oil companies will not pay a penny for this research ;)
    0 0
  13. Dear Riccardo, on my graph of the solar radiation spectrum I have clear gaps caused by CO2, especially at 1,4; at 1.8, and 2.4 (um); we know from the tables that the solar radiation carries on, so that means it also neatralizes some of the sun's radiation at between 4 and 5 um. In addition, I also heard that they use the UV absorption of carbon dioxide to determine the presence of carbon dioxide on other planets. So for you to say there is no cooling caused by carbon dioxide clearly flies in the face of all the evidence in front of me. Therefore we need specific testing that will determine how much cooling and how much warming is caused by the carbon dioxide. What we need to establish: what is the nett effect? Now if you can tell me exactly how the 1.7 was arrived at?
    0 0
  14. Henry Pool, put numbers on those absorption you claim has not been considered, but do not forget the presence of other absorbing species. This is the evidence that you do not see. And as repeatedly said no more tests are nedded, they are all well know (if you mind to look for them around on the internet or in a database of optical properties). Then, based on the known numbers, the net effect of 1.7 W/m2 is calculated exactly the way you ask, taking into account the absorption properties of all the constituents of the atmosphere.
    0 0
  15. yes, the problem is that water also absorbs where CO2 absorbs. I think it needs to be untangled. Anyway, that calculation of the net forcing =1.7, that is the one based on the global warming observed to which every greenhouse gas is then assigned a value depending on the increase in that greenhouse gas since 1750? If so, then that is not the right type of science, because that is assuming you know exactly what the solution to the problem is. You must first prove to me, scientifically, that the nett effect of the cooling and warming caused by CO2 is causing global warming.
    0 0
  16. Henry Pool, "yes, the problem is that water also absorbs where CO2 absorbs. I think it needs to be untangled." Just at some frequencies, not all. And it's not a problem, it is just a known effect that can be easily taken into account. "If so, then that is not the right type of science, because that is assuming you know exactly what the solution to the problem is." It is calculated from basic principles, not yet the solution of the problem. "You must first prove to me, scientifically, that the nett effect of the cooling and warming caused by CO2 is causing global warming." At this stage, we are not yet proving that it causes all of the observed global warming. We are just calculating forcing and than that it is at least part of it. After that other factors come into play, weighted by their relative forcing and by climate sensitivy.
    0 0
  17. It seems we are going around in circles. I went to the subject: "CO2 not the only driver of climate change" on this site that was recommended by you and I could not figure out where this 1.66 (1.7) came from. It just falls out of the air somewhere. It looks to me this is a weighted figure - you would only do such a weighthing if you are 100% sure of what the cause is of your problem. So this looks very familiar to the famous theory: "Let us have planet, let us add some CO2, let us see if the temperature increases, it did, so that must be it." Clearly this does not answer the simple question I am asking in 113 (although I forgot an important absorption): On my graph of the solar radiation spectrum I have clear gaps caused by CO2, especially at 1,4; at 1.8, and 2.4 (um); we know from the tables that the solar radiation carries on, so that means it also blocks some of the sun's radiation at between 3 and 4 and 5 um. In addition, I also heard that they use the UV absorption of carbon dioxide to determine the presence of carbon dioxide on other planets. So to say there is no cooling caused by carbon dioxide clearly flies in the face of all the evidence in front of me. Therefore we need specific testing that will determine how much cooling and how much warming is caused by the carbon dioxide. What we need to establish is the nett effect.
    0 0
  18. Henry Pool, take the sun radiation at sea level, take the sun radiation outside the atmosphere; the difference will be what is absorbed by the atmosphere; then you need to consider who is abosorbing at the various wavelength. Straightforward. Then do the same thing starting with the radiation emitted by the earth and you are done. Look for the data and the calculations yourself if you mind, it won't take more than a few minutes. Though, it is just for your curiosity, becase you can be sure that this is exactly what scientists have done for a long while.
    0 0
  19. In that case I have to bear in mind the absorption of water at 14. The % of water in the air can be easily 1% on average compared to the CO2 of only 0.035%. If I look at it that way then there is only a tiny little corner of earth's radiation at 14 that is not being emitted. The gaps in the sun's emittance caused by the CO2 are the same size , in total, if not more. I am sure that the cooling effect is therefore as much as the warming effect. The problem is: there are no real figures when it comes to carbon dioxide. No proper research has been done. It is all just stories. Some infatuation with a viking who lived many years ago and whose results have been proven wrong. I have been going around asking the same questions and not getting any measured results. In fact, many "scientists" would not believe me when I told them that CO2 causes cooling (during daylight) You did not answer the question on my post at 117: It seems we are going around in circles. I went to the subject: "CO2 not the only driver of climate change" on this site that was recommended by you and I could not figure out where this 1.66 (1.7) came from. That 1.7 is a weighted figuire, is it not?>
    0 0
  20. Henry Pool, go back to my comment #112. Points #2 and 3 are what you call the cooling effect of CO2. They are both roughly negligible if you mind to put numbers on them as scientists working in the field do in details. The number 1.7 W/m2 forcing from pre-industrial era come from a procedure like the one you describe but pluging in real numbers. I can't see why you should not accept it given that your are simply "sure that the cooling effect is therefore as much as the warming effect." for no reason.
    0 0
  21. I think the 1.7 comes from the total average global warming measured (since 1750?) and the greenhouse gases (and anti greenhouse gases) are assigned a value based on their increases or decreases since 1750. I think it is not based on any specific testing on carbon dioxide that would show us exactly how much of the sun's- and how much of earth's radiation is being blocked by CO2. As far as the science goes, I think it is presumed (by the IPCC)that Svante Arrhenius "science" was right or partly right. IF THAT IS THE CASE, THEN THAT IS WRONG SCIENCE. We need to re-visit this. Svante's equipment must have been so poor, that he could have made big mistakes and he could have been completely wrong. I think he worked with 100% CO2. We need to test at certain concentrations, in the range from 0.01 to 0.06 % CO2....We need to know where we are with this and where we are going, even if the nett effect of carbon dioxide is warming (which I doubt).....None of you have convinced me yet with any numbers on the table that show that CO2 is to blame for global warming. I need to see actual figures from actual measurements taken during actual experiments. To think I started out 3 months ago, believing that CO2 is the problem! Now I am a total skeptic. It is because there are no figures when it comes to CO2. How is this possible? I suspect nobody could think of a way to test it properly. So there are only stories. Nothing but stories. And if you do not "believe" those stories you will be told by the "believers" to go and do some studying...... Is there anyone out there who can show me exactly how the 1.7 was arrived at? It just cannot fall out of the air somewhere (right into this site).
    0 0
  22. Henry Pool, you really think that the IPCC is stuck on a 19th century experiment? Do you really think that no one has measured CO2 absorption since then? Do you really think that more than a century of science has passed in vain? Many people here showed you how things work, but you didn't notice, as you didn't notice a century of science indeed. You didn't put any effort to find yourself the numbers (there are plenty around) you're asking for. You "suspect", "think" or "presume" a lot of things, based on nothing, and are surprised that people tells you "go and do some studying". Knowledge does not come doing nothing and if you want to do nothing forget knowledge. It is then your attitude that makes your questions un-answerable, you will keep thinking forever that "nobody could think of a way to test it properly" (sic) untill you find the will to learn.
    0 0
  23. Henry Pool, the top of the original post on this page you are reading now has a green box immediately before the Comments section. In that box, our host John Cook already provided a link to a collection of a large number of the scientific papers reporting the empirical measurements that you keep claiming don't exist. Since you don't seem to like to exert the labor to look where people point you, I'll repeat the link here: http://agwobserver.wordpress.com/2009/09/25/papers-on-laboratory-measurements-of-co2-absorption-properties/
    0 0
  24. Henry Pool, I anticipate that you will object that those papers I just pointed you to are too narrowly focused. You need to also look at the Index on that AGW Observer site. Again, I will save you the labor. This time I'll even save you the labor of copying and pasting the URL by providing a link.
    0 0
  25. Henry Pool, now I anticipate you won't bother looking in that AGW Observer site's index, either. So here is a link to that site's collection of papers on CO2's absorption properties in the atmosphere, to complement the link I already gave you on laboratory measurements.
    0 0
  26. Henry Pool @ Riccardo on 122 You are doing the same thing! You did not provide me with any figures!!! There is no science in any thing you say and you do not provide any logical scientific answers.
    0 0
  27. I note that no one wanted to answer me on where the 1.7 came from. Instead you want to lead me into a labyrinth where I will never get out. I am just an ordinary factory chemist. But if I get lost, what about officials who have to make decisions on this science? Anyway, I think the info I am looking for does not exist because it seems I am the only person to think that cooling by CO2 is possible during daylight..... A few scientists demonstrated that cooling by CO2 does happen higher up in the atmosphere. I think it does not only happen higher up, it happens everywhere in the atmosphere. (CO2 is diffused in the air) Let us do a simple experiment. If it is a sunny day here in Africa, the heat from the sun is scorching. It will take no more than 10 minutes before you will start looking for a shade or cover. Now if the humidity rises during the day from let us say 20-30% to 70-80% and it remains sunny, then you can feel that the heat from the sun became less, as the humidity increases.. You can feel that the infra red radiation (which are the warm rays) is being blocked! The light is still coming through! It is more dangerous now in the sun because you do not feel the heat but you can still get burned. Now what happened? (Now remember that words water vapor and carbon dioxide are interchangeable) Now, I have been around a bit, so I can tell you that so far there are at least three theories: 1) The IR rays from the sun hit on the water vapor, it absorbed photons. It became agitated (at that wavelength) not letting light through anymore,so it becomes opague so that any further radiation at those wavelengths where absorption occurs are blocked. But light doing what light does best: it has to keep moving. So it is bend away. The position of the molecule is random, so one can assume that 50% (at those wavelengths where absorption occurs is bend away from earth, back to out of space. There is cooling! 2) What happened is the same is what happens when you sit in a room with a furnace in a corner. To stop the hot heat from getting to your face you put a shield in front of you. (the water vapor). Some heat is absorbed (by the shield) but the other heat is bend off. But you are sitting in a closed room. So the temperature goes up. (IN THE ATMOSPHERE).There is no cooling. 3)The sun's (radiation) photons that are absorbed somehow changes into kinetic energy and this is passed on to the atmosphere, i.e. mostly O2 and N2. So absorption goes on all the time and the radiation that is absorbed is changed to heat. So the radiation that did not reach the earth is all changed to heat. There is no cooling. So, now before we carry on, which do we say now is the correct theory and why?
    0 0
  28. http://www.livescience.com/environment/060124_earth_albedo.html It seems that measurements have shown beyond doubt that earth's albedo has been increasing since 2000.
    0 0
  29. Gheewhizz -- it got awully quiet now? Check this graph here: http://wattsupwiththat.com/2007/10/17/earths-albedo-tells-a-interesting-story/ The most interesting thing about this graph is that the forcing due to the brightening of earth in 2005 is more than 6 W/m2 larger compared to 2000. This alone is like double the forcings attributed to the greenhouse gases. (but the forcing of the greenhouse gases is in the opposite direction). If this trend continued past 2005 then this more than cancels each other out. Taking the earth's albedo of 2000 as zero, then in 2005 we were back at where it was in 1985 So the effect of the global warming is now being undone! If this carries on long enough we will go back to a situation where we were will go into global cooling. Why is this happening? Apparently in one report I read that this brightening is due to an increase in the absorptive wavelengths of a) carbon dioxide b) oxygen (ozone) c) water (I hope I can still find that report again) This does make sense to me: a) I have been saying this along: there must be a cooling effect of CO2! So as CO2 increases, so will some of earth's albedo increase! The correct answer in 127= 1)!!!! b) back in 1985 I was still working in the electronincs industry desperately trying to get rid of CFC's. Working in a team at a big multi national we eventually succeeded by 1990 at replacing all the processes where we used CFC's. It was not long afterwards that the rest of the electronics industry followed us.(Our slogan was: we are ozone friendly) The refrigeration industry also found alternatives.So it seems all CFC's were banned. Some human activities produce ozone. So obviously what is happening now is that ozone must be increasing - hence more UV light is being blocked and is emitted by earth. c) Going by plane you notice that one of the activities most easily observed from above is the gathering of water by man. You see many dams, mostly for irrigation but also consumption. This is usually very shallow water, which easily warmps up. As a result, there must be an increase in the formation of water vapor. We know that water vapor reflects a lot of radiation! So, if this trend of an increasing albedo of earth continues, there is of course no more global warming. I donot know what the trend after 2005. I will try to find out, unless someone has these figures?
    0 0
  30. Nobody knows what the trend is of earth's albedo after 2005?
    0 0
    Response: The latest trend of earth's albedo is no trend. Satellite measurements (eg - CERES, MODIS measurements of cloud fraction, ISCCP) all show little to no trend (Loeb 2007).

    Incidentally, Palle has updated his data - it turns out that earlier graph with spiking albedo in 2003 was an artifact, a product of poor data. Palle's updated Earthshine data also shows no trend since 2003 (Palle 2008).
  31. Quote from the Palle 2008 report: Earthshine and FD analyses show contemporaneous and climatologically significant increases in the Earth's reflectance from the out-set of our earthshine measurements beginning in late 1998 roughly until mid-2000. After that and to-date, all three show a roughly constant terrestrial albedo, except for the FD data in the most recent years. Also look up: http://www.bbso.njit.edu/Research/EarthShine/ Dr.Spencer had a guest post about CERES satellites showing the same looks like earth's albedo is still growing - it is consistent with my theory that CO2 must also cause cooling as it behaves similar to water vapor. I leave it to the clever scientists to actually devise the testing method to determine the nett effect of the cooling and warming of CO2.
    0 0
    Response:

    Your own quote says refers to "roughly constant terrestrial albedo" in recent years. Here is a full review of satellite and earthshine determinations of recent albedo trends.

  32. Two areas on earth at the same latitude, both have the same maximum daytime temperature of 32C. At night, in one area the temperature drops out 17 degrees, to a minimum of 15C, the other area the temperature only drops out 5 degrees to a minimum of 28C. Both areas are at the same altitude, there is also no measurable wind through the 24 hour period. The reason for the different drop-out rates... water vapour. The area with the largest drop-out is a desert. The other area is a very humid climate. In Meteorology, the area with the large drop-out is described as "heat energy is rapidly lost to outer space". I don't buy the influence of the small 0.028% to 0.038% (280 ppm to 380 ppm) of CO2 in the atmosphere, as having a major effect, as stated ad-infinitum everywhere.
    0 0
    Response: The enhanced greenhouse effect from CO2 has been confirmed by empirical observations as shown above. You're correct that water vapor is the most dominant greenhouse gas. Water vapour is also the dominant positive feedback in our climate system and amplifies any CO2 warming. Positive feedback is why climate is so sensitive to CO2 warming.
  33. Ok, I have had some time now to study the most recent Palle et al report, I agree with the conclusion: "In the common period, earthshine, CERES along with ISCCP-FD data show a trendless albedo. However, preceding CERES, earthshine and ISCCP-FD reflectances show a significant increase before flattening and holding the increase. This implies a reduction in the net sunlight reaching earth...it is important to point out that the physical causes behind these decadal variations in albedo are still unknown, and that we just don't know yet whether we should expect the albedo changes observed during the modern period to persist into the future.." end quote. Well, if you go a few steps back (above) you will have noticed that I am pretty sure that the increase will hold because it is most probably due to a) an increase in CO2 b) an increase in ozone (due to elimination of CFC's) and c)greater shallow water reservoir surface areas due to human activities. Obviously as the weather was getting warmer more clouds are formed, which also helps to reflect more sunlight to space. The reflected sunlihgt is what makes earth cooler. So remember: water and carbon dioxide are like my mother and father. Make sure about the facts before you say anything bad about them/ I am not sure what you people are going to do or say in Copenhagen. I have done my job.
    0 0
  34. I find it sad that those who point to the attached papers as further or any "proof" of anthropogenic warming apparently failed to critically read the papers. In the various pro-AGW arguments presented I see the idea that coincidence is claimed to be proof of causation, admission that AGW is a matter of consensus (political, not science), and the usual "we should eliminate any speech of those who don't automatically agree with everything we say". It's sad, really. The simple fact is that the primary "proof" of AGW theories is still based on computer programs which were designed to prove just that and which, if you've been paying attention for the past ten years, deliberaetly flawed presentations of temperature data aside, have been proven wrong once again. Over the past decade human production of CO2 went up and temperatures did not. You can deny it all you want, you can delete this post all you want, it's still true.
    0 0
    Response: I must confess, my finger was hovering over the delete button when I first read this comment. But instead, I will follow Riccardo's example in the following comment and use this as a teachable moment:
    • Firstly, you describe several claims of pro-AGW arguments. Eg - "coincidence proves causation", "it's based on computer programs", "AGW is a matter of consensus". They are not the claims made by climate scientists. These are characterisations of pro-AGW arguments made by skeptics. The evidence for man-made global warming is based on direct observations and direct causation.
    • In fact, that is the main point of this post - empirical measurements prove that more CO2 leads to an enhanced greenhouse effect. This means CO2 is "trapping" more heat. Therefore the planet is accumulating heat. And more heat means higher temperatures. That's not coincidence but direct causation.
    • Over the past decade, the enhanced greenhouse effect continues to trap heat. Observations show that the Earth's total heat content continued to rise past 1998, the year when skeptics claim global warming stopped. More than 90% of global warming goes into the oceans. Direct measurements of ocean heat content find that the ocean is still accumulating heat. The empirical data is clear. Global warming is still happening.
    It's quite easy to set up straw arguments like "coincidence is not causation" or "AGW theories are based on computer programs". But the evidence for man-made global warming is empirical, based on direct measurements of an enhanced greenhouse effect. I'm not sure if you read the article above but I would strongly recommend rereading it then reading a broader overview of the empirical evidence for man-made global warming.
  35. Good that it has not been deleted. The endless repeating of the same faulty arguments is enlightening of the deep will to not to look at the science. "coincidence is claimed to be proof of causation" true that coincidence (correlation?) is not a proof, but it's not used for sure on the AGW part. I've seen many more correlations used against AGW, even that the sun (or GRC, or clouds, or magnetic field or even length of the day!) correlates better than CO2 with the temperature record. "admission that AGW is a matter of consensus (political, not science)" Yes? I've heard this somewhere ... on skeptic blogs ... they admit that someone else admit that ... oh Lord ... "we should eliminate any speech of those who don't automatically agree with everything we say" well, and how comes that there is so much discussion around? How comes that scientific papers against AGW continue to appear (though from the same few guys)? Because of their super power that can not be defeated? "the primary "proof" of AGW theories is still based on computer programs" I bet this is just lack of knowledge of the discovery of global warming. No need for computers, simple calculations can be done by hand. On the contrary, including in the picture as many details as possible and having future projections as accurate as possible require intensive calculations.
    0 0
  36. The figure 1C "Change in spectrum from 1970 to 1997 due to trace gases" from the Harries 2001 paper gives the impression that the measured outgoing long wave spectrum has shown an overall drop over the measured range. The figure 1B from Harries 2001 shows the measured difference between the 1970 IRIS and 1997 IMG spectra and it shows a notable increase in the OLR over the range ~800-1000 cm^-1. This increase is also seen in the spectra shown in Griggs 2004 and Chen 2007. Is the decrease in OLR in ~650-750 cm^-1 band greater than the increase in the band 750-1000 cm^-1? It seems to me that for the radiative imbalance to result in overall cooling that the total OLR integrated over the whole band should be decreasing with increasing CO2.
    0 0
  37. guinganbresil, in Harris 2001 there's a discussion on the 800-1000 cm-1 range. A short excerpt: "The observed 1 K or so enhancement of the 800-1,000 cm-1 difference signal would be consistent with this, and could also arise from a change in the mean cirrus microphysical properties. We cannot separate these two effects, but we do conclude that the observed window difference spectra strongly indicate an effect involving residual small ice crystal effects, incompletely cleared from the data."
    0 0
  38. Riccardo - Thanks for the prompt response! As I understood Harries, the issue of incomplete removal of the ice crystal effects was due to the large difference in FOV of the IMG (8x8Km) and IRIS (95x95Km) detectors. However, I see in Griggs (figure 2 B & C, watch out for incorrect axis labels) that the AIRS detector has a field of view much closer to IMG and it still shows this effect. The increase of the ice crystals (or whatever it is) appears to track with time (1970, 1997, 2002) vice FOV (IRIS-95, IMG-8, AIRS-13.5). I know this is a subtle point, but if this ice crystal effect is not just a messy data issue it seems it would have a significant impact on the overall OLR trend and radiative balance due to the higher brightness temperature over the 800-1000 cm^-1 range.
    0 0
  39. guinganbresil, you can not draw conclusions on the overall energy budget looking just at a small wavelegth range. Ice crystals and aerosol in general, for example, influece the energy budget also in the visible. On the contrary, absorption by CO2 and CH4 is at discrete frequencies and can be assessed by looking at a single frequency band.
    0 0
  40. Riccardo, I wholeheartedly agree - My concern is that the decreases detected due to trace gases (CO2, CH4...) by Harries and others may or may not result in an overall decrease in OLR. A cursory look at the change in spectrum would imply an overall increase. Do you have a good reference for the overall OLR trend? I found: http://www.atmos-chem-phys-discuss.net/4/2727/2004/acpd-4-2727-2004-print.pdf Which indicates an upward trend for OLR.
    0 0
  41. I also found: http://www.isprs.org/publications/related/ISRSE/html/papers/332.pdf Which also shows an upward trend in overall OLR.
    0 0
  42. guinganbresil, OLR is indeed increasing which means postive energy imbalance; this is one of the (many) evidences of the warming planet. A good collection of papers on OLR can be found here. For the energy balance i'd suggest this Trenberth et al. in BAMS.
    0 0
  43. Riccardo, I agree and disagree. An overall TAO energy balance would mean that incoming solar would be equal to outgoing long wave plus outgoing short wave. An increase in OLR should be a combination of an increase due to a high temperature (obviously) modified by any changes in cloud or other OLR factors. If Golovko is correct (this is only one paper!), the increase in long wave anomaly is greater than the decrease in short wave anomaly (see figure 3): http://www.isprs.org/publications/related/ISRSE/html/papers/332.pdf Assuming that the incoming solar is constant, this would imply that the Earth is losing more heat over time. I agree that the Earth has been warming over the period Golovko analyzed, but this does not preclude it from moving back toward a TOA radiative balance. Based on the article above "How do we know CO2 is causing warming?" I would have expected increasing CO2 concentration to cause an overall (integrated over the whole spectrum) decrease in OLR, which results in radiative inbalance at TOA the thus warming. Am I misinterpreting the mechanism of how CO2 affects the radiative balance?
    0 0
  44. guinganbresil, referring to fig 1 of Murphy et al. 2009, if you have a step increase in greenhouse gas you'll initially have a step decrease of OLR. Then temperature will start rise and OLR will progressively increase toward the original value to restore balance. Remember that thermal emission typically has a much stronger temperature dependence than the other factors and tends to dominate the OLR.
    0 0
  45. Riccardo, I think I am beginning to understand. The step response graphic in Murphy gives the impression that OLR should be going up - I don't think that is true in reality. The step response of a system is very useful in understanding how the system responds to changes but it does not represent the reaction to a real signal (unless of course it is a step function!) If you imagine the vertical increase in CO2 as actually having an upward slope (which it does in reality), then the vertical drop in OLR will also have a slope - going down. We are really in a condition where CO2 is still rising so the the OLR should be dropping - not rising. This is VERY important. I will see if I can find a reference, but I have seen plenty of step response problems (charging capacitors etc.) when I studed EE to know that a system with this step response will have a decreasing OLR if CO2 is still increasing. The return to equilibrium (an increasing OLR) occurs when the CO2 stops increasing. --- I am of course ignoring saturation and other non-linear effects. I am just trying to sort out whether it is supposed to be going up or down!
    0 0
  46. Riccardo, I think I am beginning to understand. The step response graphic in Murphy gives the impression that OLR should be going up - I don't think that is true in reality. The step response of a system is very useful in understanding how the system responds to changes but it does not represent the reaction to a real signal (unless of course it is a step function!) If you imagine the vertical increase in CO2 as actually having an upward slope (which it does in reality), then the vertical drop in OLR will also have a slope - going down. We are really in a condition where CO2 is still rising so the the OLR should be dropping - not rising. This is VERY important. I will see if I can find a reference, but I have seen plenty of step response problems (charging capacitors etc.) when I studed EE to know that a system with this step response will have a decreasing OLR if CO2 is still increasing. The return to equilibrium (an increasing OLR) occurs when the CO2 stops increasing. --- I am of course ignoring saturation and other non-linear effects. I am just trying to sort out whether it is supposed to be going up or down!
    0 0
  47. guinganbresil, not true that that if CO2 increases OLR must be dropping, as the step change example shows. It's a matter of when and how it all occurs. Working out realistic details is not at all easy. Crudely speking, CO2 concentration is quadratic with time, the associated forcing is logarithmic with CO2 concentration, temperature variation is linear with forcing and has it's own time response, thermal emission goes with the fourth power of temperature. But physics helps us if you immagine a quasi-equilibrium situation (small deviation from equilibrium), which is not far from the reality of the earth system. The increasing CO2 concentration produces warming. Thermal emission must be increasing, more rapidly so the more the system is out of equilibrium; consider also that it is generally stronger than the forcing due to it's 4th power dependence on T. In the assumption of small deviation from equilibrium, you will reach a balance between the two opposite tendencies so that OLR would be roughly constant in time a little below equilibrium. It is then this departure from equilibrium that goes with the rate of CO2 increase. Here you can also appreciate why it's so hard to observe it experimentally, it's intrinsically small. Now, if you observe the OLR increasing with time it means the CO2 has increased (some times in the past) so rapidly that the earth system is still keeping up trying to reach the new equilibrium. You will see a decrease only if CO2 increases very rapidly; after a while the system will reach again a quasi-equilibrium or it will all end up in what climatologists call a runaway warming. Venus is always quoted as an example of the latter.
    0 0
  48. I don't believe any of these studies are meanigful any sense to come to any conclusions on AGW. Otherwise serious scientists would have made those conclusions already based on these theoretical results. Its more or less a theoretical excercise in exploring current limitations in regards to piecing together how the climate system works. The data discussed is over the region with the highest OLR anamolies, not to mention during opposing seasons for the regions with ~4% humidty and 10F differences. Change in CO2 bands in clear sky mostly indicates change in the stratospheric temperatures. This says nothing about the earths energy balance and its system, and certainly not anything about the final number of that energy balance in regards to CO2. Cheers.
    0 0
  49. Riccardo, I think the confusion is in the definition of the system - if you consider the boundary at TOA, the OLR must go down to cause the radiative imbalance as described by the greenhouse effect. To say that the CO2 absorbs long wave from the surface and re-emits it back down causing a temperature increase and subsequent temperature rise that causes total OLR to increase does not conserve energy. Look at a block of CO2 at TOA - that reasoning would have it emitting more IR downward AND more IR upward! Unless it is creating energy (which it is not) or converting short wave (which it is not) or is being warmed by some other source (of which I am unaware...) this scenerio is non-physical. I fully agree with your point on increasing OLR due to a drastic imbalance in the past that we are still moving back toward equilibrium. As I understand historical CO2 concentrations, they have been much lower than present for 100K's of years, so this rapid CO2 event you mentioned did not happen in the recent past. Please take a much closer look at the behavior of a system with the step function response (as described by Murphy) driven by a ramp instead of a step. You can get a feel for it by looking at a series of small steps (like a staircase) and add up the step responses. The OLR should go down while the CO2 is going up. The OLR will go up only after the CO2 increase has stopped (or the rate has gone down significantly.) All of the complications and nonlinearities you mentioned should be buried in the step response and as long as you are in a quasi-equilibrium condition, the general behavior should hold. This is pretty basic stuff in electrical engineering (charging capacitors etc.) Concerning Venus - I found a great paper describing the atmosphere - very interesting! I thought it resembled a baked potato wrapped in aluminum foil. In fact, Venus looks cooler at TOA than Earth! This is completely consistant with the decrease in OLR with increasing CO2 I mentioned earlier. Also, a large portion of the high surface temperatures on Venus are due to the high atmospheric pressure via adiabatic lapse rate. http://yly-mac.gps.caltech.edu/Z444/Flash4/Venus_greenhouse/RT_in_Venus_Atmosphere_AGU_GM01301CH08.pdf
    0 0
  50. the link cited in this article requires a membership but i found a pdf copy of the article here: ams.confex.com/ams/pdfpapers/24874.pdf i must say i'm at a loss how skepticalscience arrived at the graph here - it doesn't appear in the actual paper. and in fact (in fig. 1 of the paper) the delta brightness temperature increases for the 700 waves/centimeter point (where CO2 absorbs IR). i agree that CH4 has less in 1997 than 1970 but the majority of the spectrum analyzed showed an INCREASE in emission in 1997 as compared to 1970. in that figure 1 of the paper, they show lines of average measurements and then upper and lower error lines. it is true that the lower error line dips to 0 and slightly below for the 700/cm so maybe you just reported the lower error graph. and i will agree that this wavenumber was lower than the rest but they were still above zero which shows an increase in emission in 1997 vs 1970. the authors even state in the conclusion that we shouldn't infer atmospheric temperature changes from this snapshot. here is their quote: Although these strongly affect the OLR the atmospheric temperature and humidity response cannot be unequivocally determined owing to the snapshot nature of the observations.
    0 0
    Response: The graph above comes from Figure 1c in Increases in greenhouse forcing inferred from the outgoing longwave radiation spectra of the Earth in 1970 and 1997 (Harries 2001) (unfortunately the full paper cannot be found online - dang pay walls). This is a different paper to the one you link to (thanks for the link to the full paper, btw). The conclusion from Harries 2001 is 'Our results provide direct experimental evidence for a signi®cant increase in the Earth's greenhouse effect that is consistent with concerns over radiative forcing of climate.'

Prev  1  2  3  

You need to be logged in to post a comment. Login via the left margin or if you're new, register here.


The Consensus Project Website

THE ESCALATOR

(free to republish)


© Copyright 2024 John Cook
Home | Translations | About Us | Privacy | Contact Us