Sea Level Hockey Stick
Posted on 23 June 2011 by dana1981
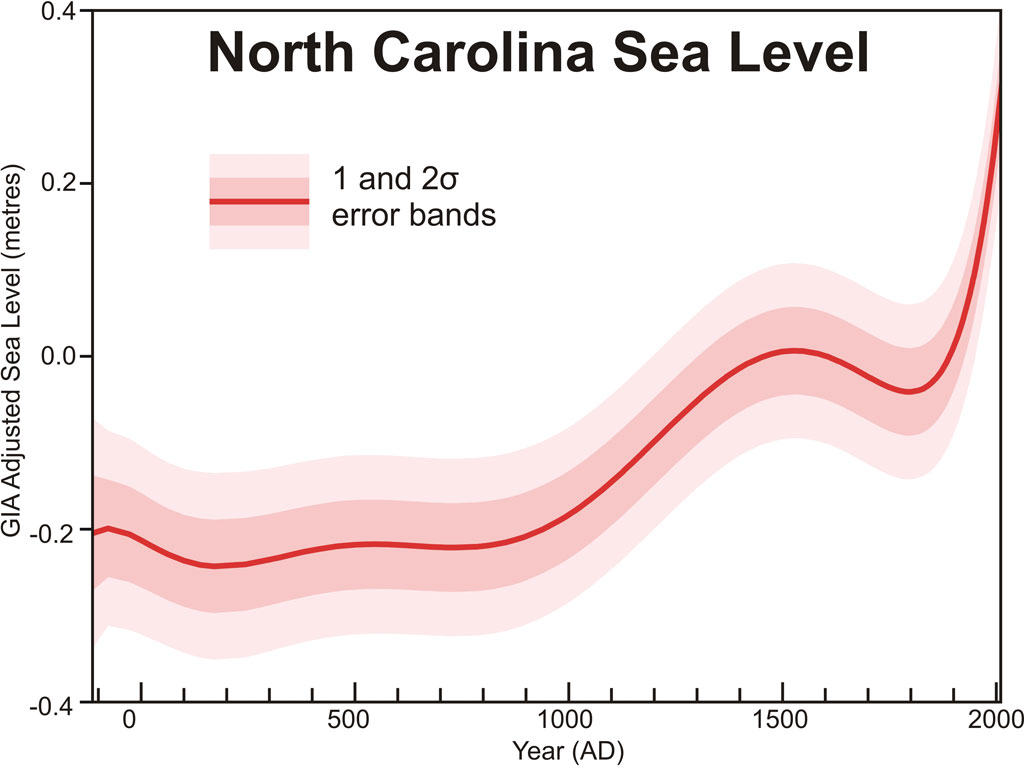
A paper recently published in the Proceedings of the National Academy of Sciences by Kemp et al. (2011) has assembled new sea level reconstructions for the past 2,100 years based on sediment from the US Atlantic coast. They found that recent sea level rise is the fastest over the last 2100 years:
Figure 1: Sea level reconstruction by Kemp et al. (2011) using sediment from salt marshes in North Carolina. This figure has also been added to the high resolution graphics page.
Among the co-authors of this paper are some heavy hitters in climate research: Michael Mann, Martin Vermeer, and Stefan Rahmstorf. The reconstruction is based on microfossils of foraminifera found in sediment from the US Atlantic coast." Rahmstorf explains the study methodology at RealClimate. The authors summarize their findings:
"Sea level was stable from at least BC 100 until AD 950. Sea level then increased for 400 y at a rate of 0.6 mm/y, followed by a further period of stable, or slightly falling, sea level that persisted until the late 19th century. Since then, sea level has risen at an average rate of 2.1 mm/y, representing the steepest century-scale increase of the past two millennia. This rate was initiated between AD 1865 and 1892. Using an extended semiempirical modeling approach, we show that these sea-level changes are consistent with global temperature for at least the past millennium."
In short, there was little change in their sea level reconstruction from 100 BC to 950 AD. During the Medieval Warm Period and a bit beyond, sea level rose, as one would expect. Into the Little Ice Age, sea level fell slightly, until just over a century ago, when sea level rise began to accelerate rapidly. Rahmstorf, Vermeer, and Mann used a semi-empirical model to analyze the connection of the sea level data with climate, essentially assuming that the hotter it gets, the faster sea level rises. Rahmstorf describes their conclusions:
"According to this model, the rise after about 1000 AD is due to the warm medieval temperatures and the stable sea level after 1400 AD is a consequence of the cooler “Little Ice Age” period. Then follows a steep rise associated with modern global warming. Modern tide gauge and satellite measurements indicate that sea level rise has accelerated further within the 20th Century."
"...the model fit to the new proxy data is highly consistent with the fit we obtained in 2009 to the tide gauge data. Hence it implies almost the same future projections as in our 2009 paper (75-190 cm by 2100)."
The authors note that their reconstruction is consistent with local tide gauge measurements, and also compared the North Carolina results to data gathered from nearby Massachusetts:
"The Massachusetts data agree with the North Carolina reconstruction, except for higher sea level between AD 700 and 1000 (although the uncertainty ranges overlap)."
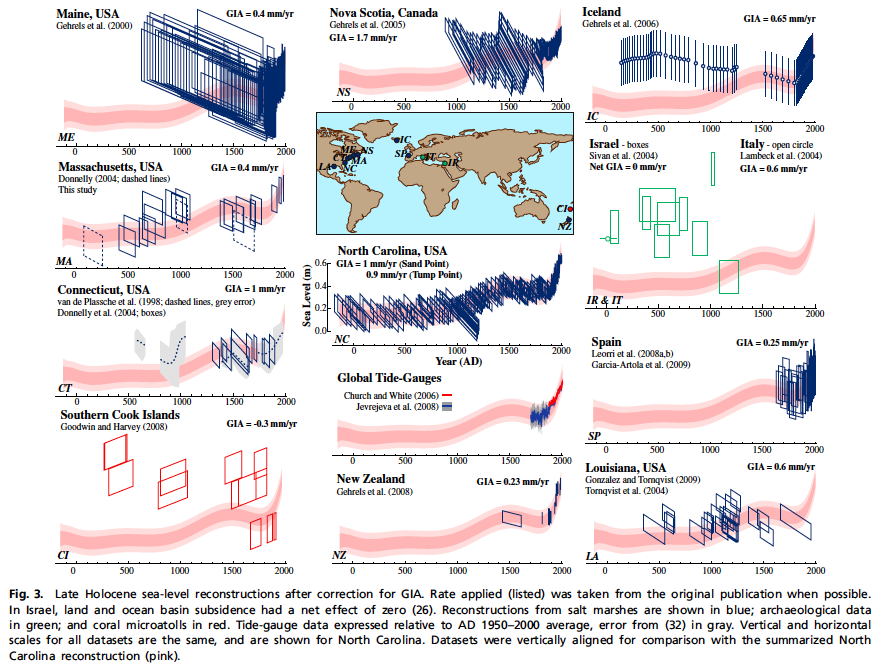
And they compared their results to a number of other sea level reconstructions (Figure 2).
"For North Carolina, we estimate that the deviation in sea-level rise from the global mean due to ocean circulation changes is between 0 and +5 cm. This estimate was based on the IPCC AR4 model ensemble for a 21st century global warming of ∼3°C, in which sea level rises globally by 22–48 cm."
"IPCC AR4 showed that local sea-level trends differed by up to 2 mm/y from the global mean over AD 1955–2003, which implies deviations of up to ±10 cm at some locations (but ±5 cm along most coastlines) as the sum of forced and unforced effects. This analysis suggests that our data can be expected to track global mean sea level within about ±10 cm over the past two millennia, within the uncertainty band shown for our analysis."
Figure 2: Comparison of various sea level reconstructions to Kemp et al. (2011). The study's North Carolina reconstruction is shown in pink in every panel, and the other reconstructions for comparison are shown in blue, green, or red.
This sea level reconstruction is yet another member of the ever-growing hockey team (see other members here, here, and here) supporting the conclusion that the current rate of warming is greater than at any other time in the past two millenia.


 Arguments


[DB] Argus, is this a Poe?
[DB] Perhaps in your quote-mining efforts you could read Latif's whole quote:
Emphasis added.
[DB] You continue to twist Latif's comments out of context to fulfill your goal of fostering doubt by conflating dissent over minutia into broad overall disagreement. Latif in the article clearly agrees with Rahmstorf for the overall period of the study (calling it a strength) and that the blade of the SLR hockey stick is not accidental. Latif and Rahmstorf differ in interpretation of details: that's science.
Schröter, OTOH, is arguing for a presence of continental drift being a player over the 2000 period of the study without presenting supportive evidence.
At least you are consistent with your narrative.
[DB] Having been Poe'd before, I was genuinely curious.
Dunno about that answers.com number you quote. Greenland ice mass loss increased from some 200+ billion tons in 2009 to about 600 billion tons in 2010. See here. And that is only part of the glacial melt picture every year.
[DB] "Proxy switch at 1,000 AD."
What proxy was switched for what, specifically?
"The reason for the proxy switch is the data didn't match."
In what way? Are you implying fraud on the part of the authors?
"And there are large differences in sea level world wide."
No, not really.
"Even differences in sea level rise rate."
Yes, for very-well-documented, non-handwaving reasons. One can even try and liken it to the tail wagging the dog all one likes, but that just demonstrates you have no argument supported by the science.
[DB] "that means that sea level could stay flat somewhere for approx 90 years and be within the error bars."
And by what physical processes would that be happening under? Given the SLR already documented to be in the pipeline?
You grasp at leprechaun straws.
[DB] Links to graphics you had previously linked to in your comment at 48 earlier snipped. Please just refer back to the earlier post with a link to it. Repeating yourself doesn't gain you extra credit.
[DB] "There may be explanations for that, but perhaps not of the kind you'd like to hear."
If, as I suspect, those "explanations" run afoul of the Comments Policy, then you would be correct.
[Dikran Marsupial] Judging by the abstract it looks off-topic for this thread. If you want to discuss it, pick a more appropriate thread.
[DB] For those interested, follow the links kindly provided by Pauls below. The RC discussion of the irredeemable issues with the von Storch paper are especially interesting. It is interesting (but tiresome) that some still trot out debunked and even rebunked papers in a transparent effort to dissemble and sow doubt.
[DB] I'm extremely certain that every single regular poster here would like nothing more than for a "silver bullet" to be found that makes the entire problem of the radiative physics of our fossil fuel emissions "go away". But being human, there is a natural tendency towards elation when we have solid scientific data showing the dissembling of the denialist movement to be exactly what it is: a house of cards built on shadows and myths.
[Dikran Marsupial] Proof that every cloud has a silver lining, even if it is only one atom thick! ;o)[DB] Off-topic unsupported conclusions snipped.