Lessons from Past Climate Predictions: Don Easterbrook
Posted on 29 June 2011 by dana1981
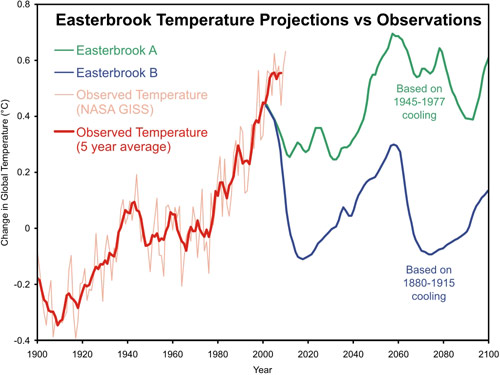
 This is the first in what we plan to be a long series of posts evaluating climate predictions by both so-called "warmists" and so-called "skeptics" re-posted on "skeptic" blog WattsUpWithThat (WUWT) in which he predicted imminent global cooling. His prediction is illustrated in Figure 1 below. Easterbrook has been making similar predictions of imminent global cooling since 1998, according to his own account on WUWT.
In 2008, "skeptic" geologist Don Easterbook gave a presentation at the American Geophysical Union annual meeting,
Figure 1: Easterbrook's global temperature projections (Source)
The obvious question now, given that the IPCC and virtually all climate scientists are predicting rapidly accelarating global warming: how did he arrive at these predictions of little warming or significant cooling?
Unfortunately that's not an easy question to answer, because Easterbrook is not very explicit about his methodology.
"Comparisons of historic global climate warming and cooling, glacial fluctuations, changes in warm/cool mode of the Pacific Decadal Oscillation (PDO) and the Atlantic Multidecadal Oscillation (AMO), and sun spot activity over the past century show strong correlations and provide a solid data base for future climate change projections."
"I used a very conservative estimate for the depth of cooling, i.e., the 30-years of global cooling that we experienced from ~1945 to 1977. However, also likely are several other possibilities (1) the much deeper cooling that occurred during the 1880 to ~1915 cool period, (2) the still deeper cooling that took place from about 1790 to 1820 during the Dalton sunspot minimum, and (3) the drastic cooling that occurred from 1650 to 1700 during the Maunder sunspot minimum."
In short, Easterbrook's predictions are based on assuming that correlation equals causation, and a few of the myths in our database including the top 2 most used "skeptic" arguments - "Climate's changed before", "It's the sun", and "It's Pacific Decadal Oscillation". Easterbrook assumes that the cooling periods in the past might be repeated again in the future, presuming they were mainly caused by solar activity and PDO.
Easterbrook also apparently does not believe that human greenhouse gas emissions will have any significant effect on global temperatures; therefore, this is not a physics-based prediction. Even the most ardent climate scientist "skeptics" like John Christy and Richard Lindzen admit that human CO2 emissions will cause some amount of warming, based on fundamental atmospheric physics.
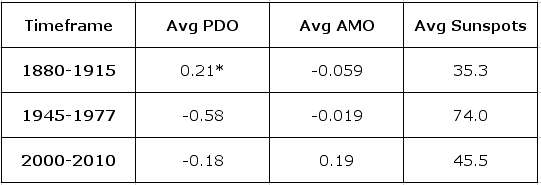
However, despite their fundamental flaws, we can still proceed and evaluate the accuracy of Easterbrook's temperature projections. The next question that comes to mind: are the variables Easterbrook takes into consideration closer to their states during 1945-1977 or 1880-1915? In other words, which of his projections should we be looking at? In order to try to answer this question, we looked at the average value for PDO, AMO, and sunspot number over the two prior cooling periods Easterbrook references, as well as the past decade (Table 1).
Table 1: Average values for PDO, AMO, and sunspot number during Easterbrook's chosen timeframes. 
* - PDO data is only available since 1900.
As you can see, just looking at Easterbrook's three indicators, it's difficult to even determine why there was slightly more cooling in 1880-1915 (~0.3°C) than 1945-1977 (~0.15°C). This is the difficulty when physics isn't taken into account, because for example volcanic activity is disregarded, as is the warming from human greenhouse gas emissions from 1945 to 1977, and the cooling from human aerosol emissions over that period, and sunspot activity is not a perfect indicator of solar irradiance, and so on.
Nevertheless, we can say that sunspot activity has been almost as low over the past decade than it was during 1880-1915, and lower than 1945-1977. PDO over the past decade has been between the two prior periods, but AMO has been higher. But based solely on these three criteria, it's difficult to determine which of Easterbrook's scenarios is more applicable, so we'll just proceed by evaluating both.
Now for the million dollar question - how close have Easterbrook's projections been to observed temperature changes since 2000?
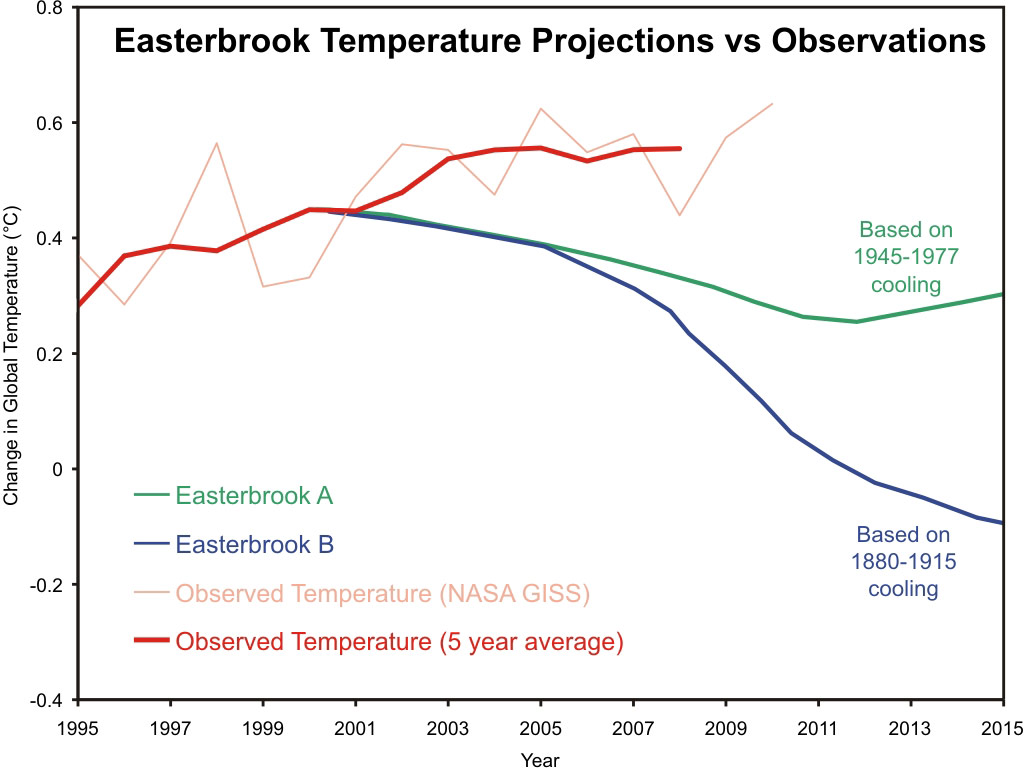
In order to answer this question, we digitized Easterbrook's projections, and compared them to observed global temperature changes. Between 2000 and 2010, Easterbrook's 1945-1977 scenario (which we call "Easterbrook A") projected a cooling of approximately 0.19°C, versus a cooling of 0.38°C over this period in his 1880-1915 scenario (Easterbrook B). The observed temperature change from 2000 to 2010, on the other hand, is approximately 0.12°C warming, according to the Wood for Trees Temperature Index, which is the average of the four main temperature data sets (HadCRUT3, GISTemp, RSS, and UAH).
Figures 2 and 3 below compare Easterbrook's temperature projections to the observational global temperature data from NASA GISS. Note: we shifted Easterbrook's projections downwards to match the GISTemp 5-year running average in 2000. We inquired as to which temperature data set Easterbrook used in his graphic, and he responded that he took it from one of the IPCC report figures. However, since we're looking at temperature changes, and using temperature anomalies (change from a certain baseline) rather than absolute temperatures, the starting point is unimportant. What matters is that his projections begin where the observed temperature leaves off in 2000 (as in Figure 1), and how much global temperature change is projected vs. observed from that point on.
Figure 2: Easterbrook's temperature projections vs. GISTemp land-ocean data
Figure 3: Easterbrook's temperature projections vs. GISTemp land-ocean data, zoomed in to focus on 2000-2010
In short, over the first decade of his global cooling projections, Easterbrook has already been wrong by between 0.3 and 0.5°C. This awe-uninspiring result is due to the fact that Easterbrook's is not a physics-based model. He simply assumes that correlation equals causation and future climate change will be similar to past patterns. However, given that human greenhouse gas emissions are dominating current and future climate changes, ignoring this elephant in the room is the primary cause for Easterbrook's projection inaccuracy.


 Arguments


 0
0  0
0
 I think that time scale is also wrong.


Comments