


 Arguments


The 97% v the 3% – just how much global warming are humans causing?
Posted on 15 September 2014 by dana1981
A pair of climate scientists recently had a dispute regarding how much global warming humans are responsible for. Gavin Schmidt from Nasa represented the consensus of 96–97% of climate experts in arguing that humans have been the dominant cause of global warming since 1950, while Judith Curry from Georgia Tech represented the opinions of 2–4% of climate experts that we could be responsible for less than half of that warming.
Curry is to be the featured speaker on this subject at a National Press Club event tomorrow hosted by the Marshall Institute; a right-wing thinktank that has spread misinformation about the dangers of smoking, ozone depletion, acid rain, DDT, and now climate change. She may also discuss the subject at an event next week hosted by the fossil fuel-funded right-wing think tank Texas Public Policy Foundation (TPPF).
The exchange between Schmidt and Curry can be read on RealClimate – a blog run by climate scientists. The discrepancy in both the quantity and quality of the supporting evidence used by each scientist was one of the most telling aspects of their debate.
For his part, Schmidt referenced the most recent IPCC report. The IPCC summarises the latest and greatest climate science research, so there is no better single source. The figure below from the IPCC report illustrates why 96–97% of climate science experts and peer-reviewed research agree that humans are the main cause of global warming.
The black bar indicates the amount of global surface warming observed from 1951 to 2010. The green bar shows the amount of warming caused by human greenhouse gas emissions during that time. The yellow is the influence from other human effects (mainly cooling from human sulfate aerosol emissions, which scatter sunlight), and the orange is the combined human effect. Below those are the contributions from external natural factors (mainly the sun and volcanoes) and from natural internal variability (mainly ocean cycles), while the whiskers show the uncertainty range for each.
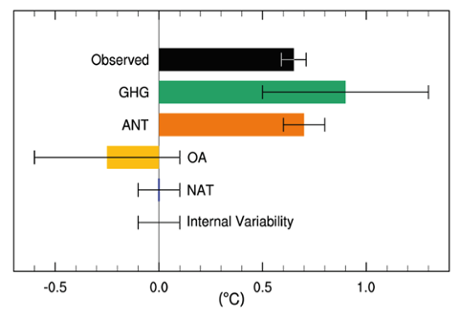 IPCC AR5 figure 10.5: Likely ranges (whiskers) and their mid-points (bars) for attributable warming trends over the 1951–2010 period due to greenhouse gases, other anthropogenic forcings (OA), natural forcings (NAT), combined anthropogenic forcings (ANT) and internal variability. The HadCRUT4 observations are shown in black.
Notice that the green and orange bars are both bigger than the black bar. This shows that greenhouse gases have caused more warming than has been observed over the past six decades, but some of that was offset by cooling from human aerosol pollution. And the best estimate from the body of peer-reviewed climate science research is that humans are responsible for more than 100% of the global surface warming since 1950, with natural factors probably offsetting a little bit of that with a slight cooling influence.
Schmidt illustrated this key point in the figure below, which is called a probability distribution of the warming caused by humans since 1950. The curve is centered at about 110% – the most likely value for the human contribution to global warming, while the probability of the human contribution being less than 50% is almost nil.
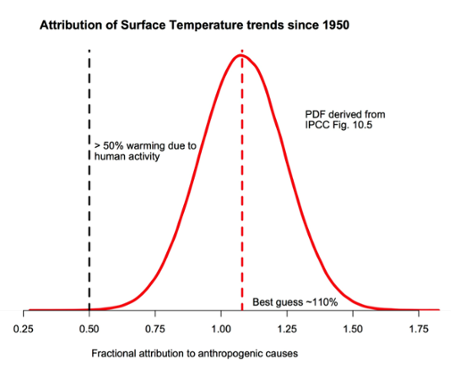 The probability density function for the fraction of warming attributable to human activity (derived from figure 10.5 in IPCC AR5). The bulk of the probability is far to the right of the ‘50%’ line, and the peak is around 110%. Source: RealClimate
Again it’s important to remember that the IPCC report is just a summary of the latest and greatest climate science research. The figures above are supported by the papers that have specifically investigated the attribution of recent global warming. This isn’t just one study; it’s based on many studies that are all in strong agreement. As the IPCC report concluded,
It is extremely likely that human activities caused more than half of the observed increase in GMST [global mean surface temperature] from 1951 to 2010.This assessment is supported by robust evidence from multiple studies using different methods.
It’s not just “more than half,” it’s also most likely close to 100%. In fact it’s just as likely that humans are responsible for about 160% of the global surface warming since 1950 as it is that we’re only responsible for 50%.
Curry disagrees with the expert consensus on this issue, but her arguments are rather muddled and “confused,” as Schmidt puts it. Her main argument is that there is uncertainty regarding the contribution of internal variability. The problem with that argument is that over long periods of time (like the six decades since 1950), positive and negative phases of ocean cycles tend to cancel each other out, and thus internal variability doesn’t have a large influence on long-term temperatures. As the first figure above shows, the IPCC estimates the temperature influence of internal variability since 1950 at ±0.1°C, during which time we’ve seen about 0.65°C global surface warming.
Curry also references a report written by Nic Lewis for the anti-climate policy think tank Global Warming Policy Foundation (GWPF), which I wrote about here. The GWPF report argues that the climate sensitivity is toward the lower end of the IPCC estimated range. However, the report is biased towards Lewis’ preferred approach, finding poor excuses to reject the many other methods that arrive at higher climate sensitivity estimates. Moreover, recent research has identified flaws in Lewis’ approach that explain why it incorrectly yields the lowest climate sensitivity estimates. In any case, even if the GWPF were correct, it wouldn’t disprove that most of the warming since 1950 is human-caused.
Curry’s other reference is to a single paper written by Zhou & Tung at the University of Washington in 2013, which concluded that roughly half of the global surface warming over the past 32 or 50 years could be explained by ocean cycles (specifically, the Atlantic Multi-decadal Oscillation). Matt Ridley also recently referenced this paper in an error-riddled Wall Street Journal editorial (debunked here and here and here and here). However, as Schmidt points out,
Tung and Zhou assumed that all multi-decadal variability was associated with the Atlantic Multi-decadal Oscillation (AMO) and did not assess whether anthropogenic forcings could project onto this variability. It is circular reasoning to then use this paper to conclude that all multi-decadal variability is associated with the AMO.


The probability density function shown relies on an estimate that warming due to anthropogenic forcings was 0.7±0.2ºC (5-95%), while observed warming was 0.65ºC, (citing IPCC AR5 Figure 10.5).
However, the actual chart in Figure 10.5 displays something rather different.
By the IPCC's definitions, combined anthropogenic forcings (ANT) equals greenhouse gas warming (GHG) plus other anthropogenic forcings (OA), or ANT = GHG + OA
And (reading off the scale) they show GHG =+0.9±0.4°C and OA = -0.25±0.35°C.
So, by simple math, ANT = 0.65±0.75°C.
So, the PDF would would be centered around 100% (not 110%) of the observed warming with (5-95%) uncertainty of ± 115%.
How would that change the shape of the PDF, and what would be the likelihood of ANT/Observed being less than 50%?
Russ R @1, here are the relative contributions as determined from Fig 10.5 by pixel count:
(Press on figure for larger version).
I note first that the Anthropogenic contribution (Anthro) has a far more tightly constrained uncertainty than does either the Greenhouse gass contribution (Greenhouse) or the Other Anthropogenic contribution (OA). Further, the Anthro contribution has a mean (and median) contribution of 107.7% of the total increase in temperature. Therefore you are using the less certain data in preference to the more certain data to make your case, which is the wrong way to go about it.
Second, the uncertainty of Anthro is substantially less than the uncertainty of the other four (including Natural forcings (Nat), and Internal Variability (Intern Var), which have an uncertainty about that of Anthro, but centered on, or very near zero) because their uncertainties are not independent. If we estimate Greenhouse to be higher, it follows that OA, Nat, or Intern Var, or some combination of them are lower, and vice versa. Further, estimates of the relative contribution of Intern Var are inversely depedent on the estimated strength of all forced responses together.
Because of this interdependence, you cannot simply add mean or median values for Greenhouse and OA to determine the mean or median value for Anthro.
That is particularly the case because, third, the uncertainty of Greenhouse (almost definitely) and of OA (probably) are slightly right biased. This shows up in the pixel counts of Fig 10.5, but is so small a bias (1 or 2 pixels at 150% magnification of the large version of the image on the IPCC site) that I (and probabily Real Climate) ignored it for mathematical simplicity. The bias in both cases, however, is a right skew meaning that the simple addition of their means will underestimate the total anthro contribution.
Further, that the Anthro, Greenhouse and OA contributions are normally distributed is just a simplifying assumption made by me and Real Climate. Often in these cases the PDF is log normal with a right skew, rather than normal. If that is indeed the intent of the IPCC, then that would further bias the results of simple addition. Of course, a log normal distribution would also greatly reduce the probability of a low (50-75%) Anthro contribution and represents a conservative assumption for the AGW case.
Fourth, and most simply, you neglect the probability of rounding errors. If the IPCC has rounded figures to the nearest half degree (likely given that all values amount to half degree figures in the table), then the difference may be due to rounding error alone. In that case the mean (or median) Anthro contribution may be as little as 100%, but may be as much as 116%, with the additional uncertainty due to rounding error. That is an additional level of uncertainty not accounted for in my graph (nor, I suspect, in Real Climate's graph), but it will only negligibly increase the probability of low (50-75%) attributions, while equally increasing the probability of high (140-165%) attributions.
For the record, ignoring any rounding errors, and assuming a normal distribution, the lower bound of the 99% confidence interval of Anthro is approximately 78%, and of the 99.9% confidence interval it is 62%. Therefore merely shifting the confidence interval 8% lower will leave a lower bound of the 99.9% confidence interval 57%. That would be an absurd response to the additional error from rounding, but even it does not result in substantial probabilities of less than 50% anthro contribution.
Further, to Russ R @1, I did not note Russ R's absurd treatment of error where he merely added the error bounds of Greenhouse and OA. That would be mathematically in error even if the uncertainties are independent, which they are not as explained above.
Tom,
I don't think you mean "to the nearest half degree" (i.e. 0.5 degrees) - perhaps to the nearest half graph-interval, where the graph-intervals (gap between axis ticks) are 0.1 degrees.
Thankyou Leto. I did indeed misplace a decimal point, and that should be to the nearest 0.05 degrees.
Hello Tom Curtis,
If you agree that:
Could you please explain how the uncertainty of ANT can be lower than that of either of its components?
Russ R @6, I have already explained that in my second point @2. That you choose to ignore it is no reason for me to repeat myself (or to waste time on an elaboration that will be equally ignored by you if it does not serve your rhetorical interests).
Russ R. - Because the sum forcings are more tightly constrained than the individual components. If natural forcings are in reality higher than estimated, then anthro forcings are lower, and vice versa.
This is similar to the case with estimates of top of atmosphere (TOA) imbalances, individual components of evaporative, convective, etc. in the Earth energy budget. Uncertainties on each component may be+/-10 W/m2, while the total Earth imbalance over the last 50 years from ocean heat content (OHC) is +/- a fraction of a Watt. Because the values for the total are established from different evidence than the values for any one of the components.
RussR:
Your addition of ±0.4°C and ±0.35°C to get ±0.75°C is only correct if the two variables are 100% correlated in their fluctuations. This is highly unlikely.
If the two errors are independent (0% correlation), then the correct way to add the errors is the root-sum-square approach:
(0.4)2 + (0.35)2 = 0.532
...so the error in the sum (or difference) is ±0.53°C
For correlations between 0 and 100%, you use the covariance to adjust between 0.53 and 0.75.
Basic propagation of uncertainty in mathematics. I'm surprised you're not familiar with it.
An addendum: when referring to 100% correlation above, I mean 100% positive. If the correlation is negative (i.e., one error being positive means the other error is negative, i.e., covariance is negative), then the error in A+B will be less than the error in either A or B alone.
Just out of general interest, if Russ R's supposition of independent errors for Greenhouse and OA were correct (and allow me to underline again, it is not), then the combined error would be +/-0.53 C for the "likely" range. That would allow a 17.3% chance of 50% or less anthropogenic contribution, but also a 17.3% chance of a 150% or more contribution. If that were the case, then there is a better than 1 in six chance that when natural factors equalize out in the long term (which is more or less inevitable, and certainly so for internal variations), we will be facing 50% greater than IPCC expected warming. That is, there will be a one in six chance that strategies to keep warming under 2 C would result in a rise in GMST of 3 C. As harm increases approximately exponentially with increased temperature, that makes the task of tackling global warming more urgent, not less.
Fortunately we are not facing that bad new situation. Also unfortunately, Russ R will not recognize that as a bad news situation because for him only the low side of the uncertainty equation is meaningfull (=usefull rhetorically).
Dana, small typo in the Gaurdian version (not included in the excerpt above):
I am uncertain why there is the focus on Figure 10.5 from IPCC AR5. Not even the IPCC, years ago, considered that representative of all areas of climate science. 10.5 is derived from 10.4 which is derived from.... Well may as well let the IPCC explain.
"The results of multiple regression analyses of observed temperature
changes onto the simulated responses to GHG, other anthropogenic and natural forcings are shown in Figure 10.4 (Gillett et al., 2013;
Jones et al., 2013; Ribes and Terray, 2013)."
The papers referenced (3 in total) are based on climate models, and observations from them. The extent to which anyone (including the IPCC) considers that a true picture of attribution, relies on the extent of belief in the accuracy of the model ensembles. And everyone knows there are problems there. Even the author of one of those papers authored another, "Overestimated global warming over the past 20 years" acknowledging observed model discrepencies. Numerous theories abound about why the models were inaccurate, but there is almost universal agreement that they were inaccurate. I have no idea why. Not my field. In fact, I think it's safe to say that nobody knows yet. Models, as expected, are going to continually be refined and get better and better.
jwalsh - I think you are making a number of incorrect assumptions here. Firstly, as to why attribution is done with a model, then please see here. Whether ensemble model mean over or underpredicted surface temperatures is a different question from attribution. For instance, see Gavin Schmidt's response here.
jwalsh @13, it would be nice if you in fact let the IPCC explain, rather than cutting them of in mid explanation.
To start with, as shown in Fig 10.4 below, the models are used to determine relative contribution but are scaled to match actual temperature increases. Thus if a model shows an anthropogenic temperature increase of 0.8 C, and a total increase of 0.7 C, then the anthropogenic increase is scaled by 0.65/0.7 to determine the anthropogenic contribution. Thus any tendency to over estimate the temperature trend is eliminated as a factor in determining attribution. All that remains is the relative responsiveness to particular forcings. With respect to that, it is well known that the combined natural forcings from 1951-2010 are slightly negative, or neutral at best.
Further, as the IPCC says:
That is, they multiplied uncertainty by a factor of 1.36, thus substantially expanding the uncertainty range to account for any additional uncertainty relating to the methods used. The models, note, only over estimate recent temperature trends by 18%, half the expansion of the uncertainty range - and that overestimation has been eliminated from the attribution by scaling in any event.
Finaly, they go on to say:
Thus while assessment of the relative contributions of Greenhouse and OA are restricted to the studies shown in Fig 10.4, the assessement of Anthro is not. Indeed, they go on for an additional two paragraphs citing other factors which influenced the determination of the Anthro contribution as portrayed in fig 10.5, and still further discussion calling on a host of further studies relating to the role of Internal variability (which unlike forcings, which will scale alike, thus preserving relative contribution, may have been an issue). They conclude that discussion by saying,
Consequently, your attempt to paint the attributions shown in Fig 10.5 as exclusively model bases seriously misrepresents the IPCC - a misrespresentation sustained by quotation out of context. Further, the attempt to portray an disagreement between model and observed trends ignores directly relevant factors by which the IPCC took that discrepancy into account.
" it would be nice if you in fact let the IPCC explain, rather than cutting them of in mid explanation. "
Of course I didn't post the whole passage. I assumed you all knew where to find it! :)
Yes, it goes on into further detail. But I fundamentally stand by my orginal assessment. The 10.5 graph was primarily derivative of a very small group of papers discussing model outputs. Therefore, I think a statement like "The green bar shows the amount of warming caused by human greenhouse gas emissions during that time." is potentially misleading. The green bar is derived from climate model outputs. And that may indeed be dead accurate, but if you think so, then you think they underlying models are. And that's a subject of debate. The best way to gauge a model is by predictive ability, either forwards or backwards. And even with strong correlation it's not possible to eliminate coincidence as a possibility, except over increasingly long terms.
My take was that the 10.5 graph was [b]never intended[/b] to display the full picture of attribution, or theories behind it. And the considerable text in the section supports that view, rather than disproves it.
And I don't think "while Judith Curry from Georgia Tech represented the opinions of 2–4% of climate experts that we could be responsible for less than half of that warming." is well supported by evidence, or the IPCC here. In the same section, they go on to say that..
"We conclude, consistent with Hegerl et al. (2007b), that more than half of the observed increase in GMST from 1951 to 2010 is very likely due to the observed anthropogenic increase in GHG concentrations"
Very Likely, in IPCC parlance, is 90-100%. And that's if you agree with their conclusions there. And not every climate scientist does. But I certainly wouldn't want anyone to take my word for it. Verheggen et al. 2014 asked a number of climate scientists to provide a figure for attribution and roughly 2/3 rds reported above 50% anthropogenic. The remainder either less or uncertain. Setting aside method criticisms for the paper itself (close enough for this purpose), how does one reconcile this to the 2-4% estimate? For that matter, where does 2-4% come from? Not from any study I have read. Were too many climate scientists unaware of the CMIP5 and other model(s) results?
[JH] Please keep it civil.
Bob,
from 10; It is my understanding that the correlation is negative. The Anthro contribution is well measured. When it is split into the Greeenhouse and other contributions, there is a large uncertainty about aerosols. This shows up in both distributions. They must add to the Anthro contribution so if aerosols have a large negative contribution the greenhouse must be bigger. If aerosols have a small contribution the greenhouse must be smaller. The aerosol cannot be large negative and the greenhouse small positive at the same time or they would not add together properly. This makes the error smaller for net anthro.
Thank you Bob Loblaw and Tom Curtis,
This is exactly what I was getting at, and it's a whole lot different from the PDF shown above which states that "the probability of the human contribution being less than 50% is almost nil" or in Gavin Schmidt's words "p < 0.0001".
The point I'm making (and I don't actually care if you don't like the roundabout way I'm making it), is that the PDF shown above uses an uncertainty estimate (±0.2ºC) that is far too low for anthropogenic warming because it's not acutally derived from any calculation of the components anthropogenic warming (i.e. ANT = GHG + OA).
Instead, the uncertainties show that the derivation is actually OA = ANT-GHG, (meaning OA is a plug figure). And ANT is simply assumed to be the difference between OBS and (NAT + INT), where NAT and INT themselves are only estimated "to the best of our knowledge". (As an aside, I find it interesting that the amount of variability being assigned to NAT and INT appears to be rising in an apparent attempt to explain away the recent lack of warming).
To summarize, my argument here is that the uncertainty figure to use for anthro warming must be derived from what we can actually attribute to the components of anthro warming (GHG + OA), not what we assume must be anthro because we don't know how else to explain it. I think that's called "begging the question".
[JH] Please keep it civil.
Russ:
var(x+y) = var(x) + var(y) + 2 cov(x,y)
var(x-y) = var(x) + var(y) - 2 cov(x,y)
Covariance can be positive or negative. So the variance of either the sum or the difference between two variables can be smaller than the variance of either.
Take the trivial case y=-x. Then x+y=0 by identify. Since cov(x,y) = cov(x,-x)=-var(x), var(x+y)=0, which is necessarily true.
Russ @18, why does your quoted section begin halfway through a sentence?
Kevin C.
Thank you, I get it... the variance of whole is less than the variance of the parts when the covariance is negative.
To accept an uncertainty of ANT of only ±0.2ºC, when the uncertainties of GHG and OA are ±0.4°C and ±0.35°C respectively, you must necessarily believe that the covariance is negative.
Got any actual evidence to make any type of valid estimate of the covariance of the error terms for GHG and OA? Or shall we just assume that it's negative?
Russ - See my comment here [which you have not responded to]. The sum of forcings is strongly constrained by other data such as OHC, hence component forcings with larger uncertainties are by necessity negatively correlated. If one is underestimated, other(s) (under the constraints on totals) must be overestimated.
Anyone got more information about the 3%?
I know a lot of careful work has gone into nailing down the 97% number and those who have been working on this are deserving of praise.
But that statistic on its own isn't enough.
3% doesn't seem that low to those who imagine that good science is only done by a minority of scientists - a few Gallileos!
Many will see this 3% as a crack in the edifice of Climate science: a chink of light in the darkness that is the future as foretold by those gloomy lefty boffin-heads!
3% isn't so tiny. Sure doesn't 1% of population of USA own 35% of all the wealth. Maybe in the same way 3% of climate scientists have 50% of the knowledge.
What is needed, I think, is an analysis showing that this minority is diminishing, becoming obsolete, that their work has been shown to be flawed, that their findings have been refuted and that many of them have been discredited by their continued use of already refuted arguments...etc.
What is needed is the extinction of that kind of stupid optimism that allows people to continue in vast numbers to entertain the notion that there is a chance - an outside chance - that maybe - just maybe - this climate change stuff is nonsense. Because that is what people do. For the reckless, the miserable and the desperate, 3% isn't such a bad gamble! It's a light in the darkness!
Extinguish it!
Anyone working on this?
KR,
Your comment relates to the concept that OBS - (NAT + INT) = ANT. (In other words, anything we can't explain must be anthropogenic.)
Yes, observed warming has very little uncertainty, and the warming ascribed to NAT and INT is claimed to be quite certain (±0.1°C), but is unfortunately limited to the extent of our knowledge of those processes (which is turning out to be more uncertain than previously thought). It's necessarily a case where we simply don't know how much we don't know.
But what we actually do know about ANT directly is far more uncertain. We only know GHG to a low level of certainty (±0.4°C), and know virtually nothing about OA except to say that it is equal to ANT - GHG.
But to say that we know ANT to a high level of certainty (±0.2ºC) is only possible if we assume that we know everything about NAT and INT with high certainty. Which is the same as assuming a high level of certainty of ANT.
And we can't simply assume that the uncertainty of the components (GHG & OA) is negatively correlated because the uncertainty of ANT is assumed to be low.
Circular reasoning works because circular work.
Russ R. said @24... "But what we actually do know about ANT directly is far more uncertain. We only know GHG to a low level of certainty..."
Hm. Actually, I believe that is wrong. We have a high to very high level of scientific understand about the radiative forcing of anthropogenic greenhouse gases:
Russ R... What I'd suggest here is that, in order to work, the argument you're putting forth here would require a yet unknown mechanism that un-explains the high level of certainty that we have about greenhouse gases, and adds a yet-so-far completely unknown forcing to take its place.
Rob Honeycutt @ 26:
You misquoted me by leaving out the quantity.
What I actually wrote:
Which is exactly the value in the IPCC's chart above, and is a low level of certainty relative to the ±0.2°C claimed for total ANT.
Still believe I'm wrong?
Russ... You state "We only know GHG to a low level of certainty" [my emphasis] and the far left column of the radiative forcing chart clearly states that we have a "H" (high) or "VH" (very high) level of certainty for well mixed greenhouse gases, which clearly make up the dominant forcing.
Russ R. - You did, I assume, also note the uncertainties on natural forcings and on internal climate variability? Which are each +/- 0.1°C? And the uncertainties on observations, +/- 0.05°C?
Again, the total forcing is well known, so are the natural and internal variation forcings - meaning that the higher uncertainties in GHGs and other anthropogenic forcings are indeed negatively correlated.
1+1+G+A=4, G+A=2. It's really that simple. As Rob points out, you appear to be invoking little green men - claiming that we must not know what we know.
No KR,
I'm saying we know what we know, and that we don't know how much we don't know.
But we don't know all there is to know. And only by presuming that we know all there is to know can we claim that the uncertainty of the remainder is low.
Rob,
You can keep arguing, or you can admit that I quantified (correctly) the amount of uncertainty as ±0.4°C.
You chose to omit that detail in your attempt to argue against me.
Was I wrong or not?
Awaiting your apology.
[JH] Please keep it civil.
Russ... I'm not questioning your figure of ±0.4°C (which is why I didn't quote it), I'm challenging your interpretation of it. Again, the IPCC clearly states that GHG forcing has a high and very high level of certainty on these.
Russ R. - Actually, what you are saying, what you are claiming, is that the IPCC stated uncertainties for natural forcings, for internal variation, and/or for observations are wrong.
I await your references refuting the IPCC AR5 summaries on these matters. In the meantime, well, you are just arguing by assertion. IMO such arguments do not stand in the face of the evidence.
Russ... Responding to your comments on what we know and don't know that we don't know (or whatever):
That is the whole point to constraining uncertainties. There is always some possibility that there is something out there on the fringes that's having an unknown influence, but given the large amount that is known on a wide range of factors, what's left that could have a significant influence becomes highly improbable.
Russ R @various:
1) The formula combining uncertainties on addition is:
σA2=σx2+σy2+2*ρ*σx*σy,
where σA is the uncertainty of the combined term, while σx and σy are the uncertainties of of the two terms summed to derive the combined term. In this particular case, that means we can treat σA as the uncertainty of Anthro, and σx and σy as the uncertainties of Greenhouse and OA respectively. This had already been explained to you in words by Bob Loblaw (@9 and 10), and the base formula from which (together with definitions) the above can be derived had been given to you by Kevin C (@19). It should be noted that the formula can be used for any level of uncertainty, not just one standard deviation (1 sigma), provided the same level of uncertainty is used for each term. It should also be noted that the formula assumes the distribution of uncertainty is normal (I believe).)
2) It has already been noted in discussion above by J Walsh (@13) that the relative uncertainties for Greenhouse and OA are derived from the model ensemble, scaled to the observed warming (as noted by me @15); and the graph representing the relevant values presented by me (also @15). From this, simple visual inspection will show the clear anticorrelation of Greenhouse and OA. Further, simple visual inspection of column C will show the very low variance of Anthro. What is more, the logical reason for this relationship has been mentioned to you several times by different respondents, including by me in my second pont @2. As I predicted @7, your entire discussion since has simply been a process of ignoring the information already presented you in the second comment on this thread.
3) Anthro is not only constrained by the relationship Anthro = Greenhouse + OA, but also by the relationship Anthro = Obs - (Nat + Internal Variability). Therefore its uncertainty is more tightly constrained than the constraints of just Greenhouse and OA. That allows its uncertainty to be tighter than it would be if calculated from just those two. It also allows other information in addition to scaled relative contributions in the model ensemble to enter determining the values of Anthro, as discussed above @15.
4) For the sake of argument, if we allow the (known to be false) assumption that the uncertainty of Anthro was constrained by Greenhouse and OA alone, we can then calculate a derived uncertainty using the relationships between Greenhouse and OA shown on Figure 10.4. They in fact show a correlation of -0.92. Consequently, the "very likely" uncertainty range for Anthro would be 0.16 C. However, the IPCC then relaxed that estimated uncertainty from a "very likely" to a "likely" range. Therefore the strict and pedestrian calculation on the basis that you suggest would have resulted in a tighter "likely" range than is shown in Fig 10.5, not a broader range, and indeed would have required a "likely" range less than +/-0.08 C.
5) Even if we allow the (known to be false) assumption that the uncertainty of Anthro was constrained by Greenhouse and OA alone, and still follow the IPCC in dropping "very likely" to "likely" ranges, that would still only result in an "likely" range of +/- 0.16 C, and a less than 1% chance of the Anthro contribution being less than 50%.
Your horse is dead, and already flogged into a bloody ruin. Will you cease floging it.
Rob Honeycutt @25, certainty about the strength of radiative forcing does not translate directly into certainty about the relative temperature response, both because of uncertainty about climate sensitivity and uncertainty about relative effectiveness of different radiative forcings. Further, Russ R's point is about the relative uncertainty of Anthro, Greenhouse and OA as shown on fig 10.5. His point is invalid, but I have to agree with him that the figure you show is irrelevant to the discussion.
Further, if it were relevant it would support his case as the uncertainty of all anthropogenic forcings is significantly larger than the uncertainty of any individual element, and likely larger (and at least comparable in size to) the uncertainty of Greenhouse radiative forcing or OA radiative forcing.
jwalsh @16, before proceeding, I would like to introduce Fig 10.6, which shows estimates of the contributions of various factors on a purely empirical basis:
Based of that chart, and using Folland (2013) as showing the lowest Anthro contribution, you can derive the following attribution estimates:
Volcanoes 0.00%
Solar -6.31%
ENSO 10.81%
AMO 0.00%
Anthro 95.50%
Nat -6.31%
Int Var 10.81%
I think those estimates overestimate the ENSO contribution by not using the SOI index, but that is neither here nor there. The important thing here is that the estimates shown are well within the 1 sigma range for table 10.5. Now, if you prefer to use a 95.5% anthro contribution rather than a 107.7%, that's fine by me. But there is no justification for claiming that the IPCC estimates are solely model based, nor that rellying on emperical estimates will result in low estimates of the Anthro contribution.
Turning now to your points:
You can stand by it all you like, but the further reading of the IPCC report clearly shows that additional factors went into determining the Anthro contribution, and especially the Internal Variability contribution. (Your claim is true in the restricted case of Greenhouse and OA).
Nobody is claiming that Fig 10.5 was intended to display the full picture. It was, however, intended to display the simplest graphic summary of the IPCC findings, as is shown by the repeated citations of it in the Executive Summary. Further, the Executive Summary states:
Note that quoteing the less emphatic findings on greenhouse gas contribution is misleading because there is a higher uncertainty about the greenhouse gas contributions than about the total anthropogenic contributions as shown in Fig 10.5 and discussed extensively above.
For what it is worth, based on Fig 10.5, the there is 90% confidence that greenhouse gases caused 54% or above warming, and 95% confidence that it caused 31% or above. Clearly the statement you quote as proving a lack of reliance on Fig 10.5 shows no such thing. There is more basis on the the section I quoted, with Fig 10.5 showing the 95% confidence ("extremely likely") at 79%, and 99% confidence ("virtually certain") at 67% contribution. That, however, can be attributed to the IPCC's well known caution.
Regardless, even the IPCC's "extremely unlikely" finding, together with both empirical and model based methods showing near 100% mean attribution shows that conclusions finding near 50% attribution are simply unwarranted. They are the result of bias, not analysis (and very plainly so in the case of Curry).
Verheggen et al increased their sample by including a group of AGW "skeptics" who would not otherwise have met the criteria. Further, many of the scientists surveyed are not expert in attribution, whether expertise is determined by relative number of papers, or by field of study. Therefore simplistic interpretations such as yours are not warranted. I am not going to go into it here, however, where it is off topic. If you want to discuss it in detail, there are several blog posts on this site in which Verheggen discusses the paper. They are most conveniently found by using the "author's posts" page under the "about" menu.
As good as the outputs of the CMIP5 series of models are in providing much of the data for the AR5 graph in question, nobody considers them completely definitive. If that were the case, the over-prediction of temperature wouldn't be a current issue for the modelers. And it is.
There will of course, be a CMIP6 series. In fact one of the stated goals of the CMIP6 project is " What are the origins and consequences of systematic model biases?"
CMIP6 outputs will no doubt be part of AR6. It will be interesting to see the differences. But whether they are much improved will require additional decades of data to see.
[quote]Verheggen et al increased their sample by including a group of AGW "skeptics" who would not otherwise have met the criteria. Further, many of the scientists surveyed are not expert in attribution, whether expertise is determined by relative number of papers, or by field of study. Therefore simplistic interpretations such as yours are not warranted. I am not going to go into it here, however, where it is off topic. If you want to discuss it in detail, there are several blog posts on this site in which Verheggen discusses the paper. They are most conveniently found by using the "author's posts" page under the "about" menu. [/quote]
I am new to the site, and didn't see Verheggen as the author in the drop-down.
I have read both Cook 2014 and Verheggen 2014 in entirety.
And yes, Verheggen's paper included what was said to be 5% of respondents culled from those taking a contrary position. Which frankly concerned me when I read it. Applying multiple pre-selection criteria is another sort of potential bias. And why wouldn't you include a spectrum of beliefs if you were trying to quantify that spectrum? Hmmm.... However, using back of napkin math, removing 5% of those thinking it's unknown or less than 50% brings it to roughly 70/30. Still a far cry from 2-4%. I noticed that the Cook 2014 study was the reference for 2-4%. Under that study, the 97% figure was for those papers that were subjectively deemed to hold a position that at least part of the warming was man-made. And under that definition Curry is very much NOT a part of the "2-4%". The majority of papers were deemed to not take a position in the abstract. Which leads one to speculate that the authors possibly did have an opinion, but you just couldn't tell from the abstract. Reading the full paper might be instructive in that case, or you could just ask them. Isn't that what Verheggen did?
jwalsh @39, the list of Bart Verheggen's articles is here, as found from the "Author's Posts" page. The top two relate to Verheggen et al. I note that there is every reason, when you are attempting to quantify the opinions of people in a certain group (scientists who have published in the peer reviewed literature on climate science) to not include an extraneious group who have not published in the peer reviewed literature on climate science solely because they hold a particular opinion on the topic. Beyond that, your statistical manipulations bring to mind the saying about lies, damned lies and statistics .... Your distortions of Cook et al sugest that is not too unkind an assessment. Not to put to fine a point on it, the claim that the Cook et al categories measured "that at least part of the warming was man-made" is a lie; and one concocted after the initial reaction to the paper showed the "skeptics" to have interpreted the paper correctly, ie, a test of endorsement of the claim that 50% plus of recent warming was anthropogenic. (I make no claim as to whether or not you are deliberately decieving, or merely hoodwinked.)
I repeat, if you want to discuss the paper in detail, dicuss it where it is on topic.
" Your distortions of Cook et al sugest that is not too unkind an assessment."
I wish you'd pointed out how I distorted it (email me?). But I'll try and stay on topic. The Topic of the article was "The 97% v. the 3%".
But to avoid any distortions on my part. From the Cook paper. "Among abstracts that expressed a position on AGW, 97.1% endorsed the scientific consensus." and "Among self-rated papers not expressing a position on AGW in the abstract, 53.8% were self-rated as endorsing the consensus."
Category 2 of Explicit Endorsement in the Cook paper was defined as "Explicitly states humans are causing global warming or refers to anthropogenic global warming/climate change as a known fact"
Curry is at least Category 2 by believing the anthropogenic component is roughly 50%. In fact, I'm uncertain what percent would qualify, but 50 should knock it out of the park! Heh.
So, if Schmidt and Curry debate, it's really between two people within the 97%. If you want to hear from the 3% (and I am uncertain why you would, as defined), someone else needs to step up. However, realistically Schmidt speaks for himself, and Curry speaks for herself.
jwalsh @41:
The title of the article is, "The 97% v the 3% – just how much global warming are humans causing?". Leaving out 62% of the title, with no indication that you have done so represents misquotation, and in this case, out of context quotation to boot. Both are forms of dishonesty, and in academic situations are regarded as a type of academic fraud. I presume in your case they represent sloppy practise, however sloppy practise that gives an appearance of greater strength to your argument than actually exists.
More importantly, the 97% and the 3% are mentioned in the title and paper, but not discussed. Specifically, there is no discussion of what specifically divides the two groups, nor of how we know it, or even of the significance of the division. Rather the terms "97%" and "3%" are merely used as labels, with the discussion in the article (and hence the topic of the article) restricted to the IPCC's attribution statements with particular regard to Fig 10.5. The article could have easilly used labels such as "accepters" and "challengers" of the IPCC consensus, and it would have made no difference to the substance of (and hence the topic of) the article.
As labels they are not ideal in this case, in that Curry does (barely) accept that 50% of recent warming has been anthropogenic with a very large error margin. As such, she nominally falls inside the consensus position as categorized by Cook et al (and more directly relevant, Doran et al, 2009). She is, however, clearly a challenger of the IPCC consensus position. If you wish to interpret the article as "The IPCC position vs a fringe consensus position" with the understanding that the arguments of those who don't make that fringe position are even worse than the poor arguments by Curry, I doubt Dana (or anybody else at SkS) will care. It is a non-issue.
(I don't think that would be an accurate presentation, in that I don't think Curry's arguments and overall position are consistent with a genuine 50/50 position. But whether it is accurate or not, it is irrelevant to the substance of the article.)
jwalsh @38:
I do not think anybody is claiming the models are "definitive". That is why the estimates have error margins. Leaving aside the fact that the models are not the only basis of the attribution, the fact that error margins were shown, and then expanded to allow for uncertainties in the method shows that you are arguing against a strawman. Further, you are arguing inconsistently in that you assume any increased uncertainty must reduce the percentage of the anthropogenic contribution, whereas it is equally likely to increase it.
Tom, I seem to have touched a nerve, but there was a method to my madness. And yes, I take more care in an academic context compared to a comment on a blog. However, I might truncate a title when discussing an actual academic paper within the confines of comments attached to that exact paper, assuming that if someone got that far, I'd think they would have read the title already. And I don't think I'd be accused of "fraud". Sloppy? Subjective. "Concise" would be my preference. I could have just as easily left any portion of the title out (or all of it), and I think people would have got the gist. Haha.
I disagree. The author defined 3% of climate experts as believing a sub 50% anthropogenic attribution in the first paragraph of the article and referenced (at least on the newspaper page) Cook 2014 as the source of that figure. If it were unimportant....
So, who cares? Why am I picking nits? I believe the IPCC consensus view and I believe strongly that we really need to be doing something about it. But care needs to be excercised in communicating about it. Why? Because there's a strong danger similar to the "crying wolf" parable. Over-stating a case, and exaggerating the degree of consensus is potentially damaging in the effort to convince those who don't believe that CO2 is causing warming. I think we need to be prepared for things like the "pause" continuing beyond this year. What if it winds up being 28 years? Or 40 years? I personally think that's unlikely. But it's going to be a tough sell made a lot harder by over-stating a case and then back-pedaling. Extreme caution needs to be exercised in delineating what is known and what is still in the theoretical realm. But that's just my opinion.
What I wish is pretty irrelevant, but if I were to be pinned down to characterize the Schmidt/Curry debate over attribution, I would say that Schmidt's position is Schmidt's position and Curry's is Curry's. I don't think Gavin Schmidt would consider himself as speaking for the IPCC any more than Curry would think she is speaking for a larger fringe group.
Only 64 out of 11,944 abstracts reviewed by Cook et al (2013) were rated as "Explicit endorsement with quantification", stating that "humans are the primary cause of global warming".
That amounts to a "0.5% Consensus" (64/11,944).
Excluding the 7,930 abstracts which were viewed to take no position, the ratio (64/4,014) rises to a "1.6% Consensus".
The reported "97.1% Consensus" excludes those abstracts which took no position, but includes 2,910 abstracts that do not explicitly state that humans are a cause of warming, and 922 that explicitly identify humans as a cause of warming, but not quantify the amount or state that humans as the primary cause.
Does anyone dispute the above?
[JH] When you pivot to a totally different topic, please find the appropriate OP and post your comments there. Pleae follow KR's recommendation.
Good grief, Russ: not THAT again. How many studies quantified attribution?
Russ R. - This thread is on the particular discussion of attribution, based on the discussion between Schmidt and Curry (who clearly misinterprets the IPCC report on this matter).
Misinterpretations (such as yours) of Cook et al methodology should be discussed on an appropriate thread, and I have replied there.
I don't know if anybody asked jwalsh why the skeptics don't do their own survey and present it for peer review? It seems like the Koch brothers or some other benefactor could come up with a little chump change to find out. They helped fund Richard Muller’s historical temperature reconstructions. Of course it didn't pan out for the skeptics since Mueller found out the Hockey Stick was the real McCoy. I wonder if that’s the reason they haven't made an attempt to shoot down Cook et el by doing their own research? Obfuscation may be the only arrow left in their quiver.
Stranger @48... I have asked the exact same question innumerable times on various forums over the past year or so. It doesn't even take funding to replicate, it just requires some dedication of time.
It really doesn't even require that much time. Cook et al was really overkill in terms of the number of papers. You could easily get a robust statitistical sampling with much smaller numbers, something like Oreskes did.
What I also know (and I think "skeptics" also know), is they'll end up with the exact same result. I read a large number of the abstracts for Cook et al and I can say, with no hesitation, the number of papers that reject AGW are vanishingly small.
This ends up being exactly like the hockey stick in that, those attacking the paper are merely trying to find reasons to reject the conclusions rather than actually test the results. They aren't looking for the truth, they're looking to bury the truth.
@jwalsh and TomC, your discussion is interesting, but is it goal oriented?
I think the more interesting observation comes from a link that was only in the Guardian version, in which Dan Kahan muses about what makes people like Curry tick. His analysis and the comments, some of which could easily act as an unsolicited sample of people like Curry, point to a fascinating pschycological phenomenon, the fact that you can "know" but still deny. The derogative term sometimes used for that is the "smart idiot effect".
I have little doubt that the "3%" and their followers have the capacity to understand the science. Most are very smart people and have/had distinguished careers. We scientists have a hard time comprehending why they deny (or partially deny) the obvious. The evidence is clearly not in their favor and their arguments are weak at best. Yet their existence, publicity, and popularity with the pervading neo-liberal politics of the times spells doom for everybody. Is it any wonder we dislike or despise them?
So, as good scientists, we try to analyze them. Kahan and others are contributing most to that. I think his analysis is useful at worst, and right-on at best. While Curry most likely suffers from "dualism" (see above link), the followers, may also include the other three categories Kahan lists. "Dualism" seems a more common pathology to me than expected. I think if any of us are self-critically examining ourselves, we may find some form of "dualism" we hold, where the evidence is crystal clear to us, but we still deny all or parts of it (like Curry) for unrelated reasons (knowing that, or finding it after reflection of yourself means you converted from "dualism" to "partitioning"). Religion (e.g. the "muslim doctor" story in Kahan's blog) is a prime example. For the 3%, it is somewhat obvious that a neo-liberal ideology is the reason for their "dualism". They are not that shy about that at all (Curry: "I am independent, with libertarian leanings."), and they do not understand that their positions show clear contradictions, i.e. they are unaware of their "dualism", considering it the normal position others should hold as well.
We already know that arguments from evidence are very unlikely to convince somebody in denial. And while normally ignoring or minimizing the person suffering from the dualism pathology is a way to deal with the issue (since the person's pathology is not neccesarily harmful to her/himself or society), it is not in the case of global warming, because 1. the person's societal influence is out-proportional relative to the occurrence of the pathology, and 2. the consequences for society are therefore potentially disastrous.
While calling out Curry and others on their "dualism" may not be nice, it may be a start to find a way out. Her logic has already been called flawed, but, like the "muslim doctor", we cannot expect her to realize that. Alas, we should read up on "dualism" in the pschycology literature to see if there is a way to address and ameliorate the pathology, and, like in the case of the broader issue of "denialism", begin developing a communication strategy.
For the by-standers, it will remain important to highlight the contradictions in the "dualist's" mind, since this is the only way to highlight why is makes little sense to follow these people if you want to prevent or address the consequences of warming.