Latest Posts
Archives
|
 |
Explaining climate change science & rebutting global warming misinformation
Global warming is real and human-caused. It is leading to large-scale climate change. Under the guise of climate "skepticism", the public is bombarded with misinformation that casts doubt on the reality of human-caused global warming. This website gets skeptical about global warming "skepticism".
Our mission is simple: debunk climate misinformation by presenting peer-reviewed science and explaining the techniques of science denial, discourses of climate delay, and climate solutions denial.
  
Posted on 10 June 2026 by BaerbelW
This updated blog post is a call for help to get our translations ready for the planned website relaunch. If you are a native speaker of any of the listed languages and if the tasks described below are up your alley, please let us know by filling out this Google form. Here is the list of languages we still need help with as of Jun 6, 2026: Chinese, Croatian, Czech, Danish, Dutch, Finnish, French, Hebrew, Icelandic, Indonesian, Italian, Japanese, Korean, Macedonian, Norwegian, Polish, Russian, Slovak, Slovenian, Spanish, Swedish and Thai.
Translations have made Skeptical Science rebuttals accessible to people all over the world. All told, we have published almost 1,100 rebuttal translations in 25 languages, created by generous volunteers since 2009. The number of translations for each language varies greatly from 1 to 213 depending on language but most languages feature between 10 and 60 translations at the moment. As we mentioned in our annual review article for 2025, we've been working on a complete relaunch of our website. While the actual launch is still a few months away, we recently realized that some preparatory work will be needed to update and add information to the existing translations.
Why we need your help
On the current website, the setup for translations was created when there was only one rebuttal version in English. Later we introduced advanced, intermediate and basic rebuttal treatments, but translations were never adapted to that. The new website will however offer the option to create all levels of translated rebuttals - as long as a counterpart already exists in English. Likewise, "one liners" - short summaries of what the science says - were introduced for translations later but were mostly left empty unless new translations were created. For translations, we also only have one title while the English version has both a myth and a science title, which will be used on different screens and for different purposes on the new website.
With all of this in mind we ask for your help, as we can only do this for a few languages with our own resources and a few currently active volunteer translators. Unfortunately, we have no translators working on translations for most languages at the moment and it's highly unlikely that volunteers who were creating many translations in several languages 15 years ago are still available today (we tried to contact them but a good number of email-addresses bounced). We're therefore counting on fresh recruits to bridge our gap.
The tasks at hand for existing rebuttal translations
For this exercise, we do not intend to update translations across the board in order to for example bring them up to date with the English originals. A comprehensive update will be a mountain of work, better done when the revamped translation admin system is available after re-launch. For the smaller and immediate task of making our current content ready for the new website, I have set up a Google sheet listing all the translations where some information is missing and needs to be filled in. I'll share an editable link once you've signed up for the task, but you can take a look at how all this shakes out in this preview of the spreadsheet.
Update June 6, 2026: As it's often easier to start with some information than "white space", columns have been added to provide Google translate suggestions for the current rebuttal title and the one liner. If these are fine, you can simply copy and paste the translation instead of manually translating it yourself.
Translations for which the currently missing information cannot be provided will most likely be migrated as unpublished, because the information displayed on the new website would otherwise be at least confusing if not misleading. That's certainly not what we want to start out with, but it's also a conundrum because shrinking our valuable content is also very undesirable!
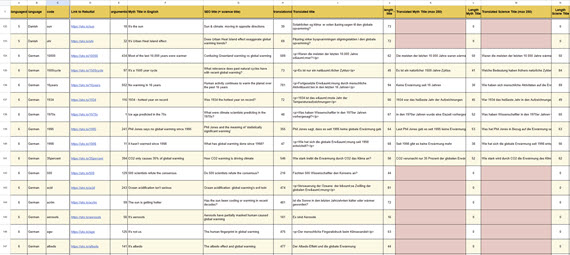
Screenshot showing a snippet of the spreadsheet - clicking on it opens a preview in a new tab.
Read more...
0 comments
Posted on 9 June 2026 by Guest Author
This is a re-post from The Climate Brink by Andrew Dessler
You have likely seen a headline like this: 62,000 people died from record-breaking heat in Europe:
It’s a striking number. It’s also not clear what it means. Is this the number of people killed by extreme heat? Or climate change’s contributions to the extreme heat? Or the number of deaths above what we would expect in a normal summer? Or something else.
This matters a lot. If we want to accurately communicate the impact of climate change on human mortality, we need to be precise about what we’re actually counting.
A graduate student and I just published a paper on this in GeoHealth (link), using heat-related mortality in Texas to demonstrate the issue. Here’s what we found.
The relationship between daily average temperature and daily mortality is a U-shaped curve. The temperature at which the minimum number of deaths occur, often called the optimal temperature (abbreviated OT), is around 20°C (70°F) in most places. Mortality goes up as the temperature departs from the OT towards either hotter or colder temperatures.
This temperature-related mortality curve is calculated statistically by looking at how total (non-accidental) deaths vary with temperature. This produces curves like the one above.
Read more...
1 comments
Posted on 8 June 2026 by Guest Author
This is a re-post from Yale Climate Connections by Bob Henson
It might have seemed exotic when it first appeared, but the forecast “cone of uncertainty” used by the NOAA/NWS National Hurricane Center (NHC) is now a familiar part of tropical cyclone readiness in U.S. states and territories. For 2026, NHC has made a couple of key tweaks to its standard cone product. It’s also testing an expanded version of the cone – one made feasible by a new way of understanding how and where forecast errors arise.
Since its debut in 2002, the cone has become what a University of Miami writer called “arguably [the center’s] most iconic graphic,” a mainstay of TV coverage and weather apps. Prior to the cone, hurricane maps simply showed a line depicting the official multi-day forecast for the storm center, as issued every six hours by NHC. Experts urged the public not to “focus on the skinny line,” keeping in mind that a hurricane’s path can easily deviate from the forecast track and that impacts will typically extend far beyond that center.
When you see a cone graphic, that ‘skinny line’ may or may not appear (NHC provides both versions), but the cone itself has gone a long way to fix the skinny-line problem.
However, just as a hurricane’s impacts do not just lie along a narrow line, a hurricane’s damage doesn’t stop when it comes ashore. Some of the worst U.S. hurricane disasters in recent years have occurred well inland, including billions of dollars in wind-driven destruction across Georgia in 2018’s Michael, and the catastrophic, deadly flooding from 2024’s Helene, which killed more than 100 people in and around western North Carolina.
Up through last year, NHC’s cone graphics only showed watches and warnings along the coastline. Starting this year, the full extent of inland watches and warnings will be portrayed. In the example shown in Fig. 1 below, the revised graphics make it crystal clear that the hurricane warning for 2024’s Milton extended almost completely across the entire Florida Peninsula, including the Orlando area.
Another improvement shown in Fig. 1 is the addition of a crosshatched area to denote locations that are under both a hurricane watch and a tropical storm warning. It’s an important way to show that being in a tropical storm warning doesn’t mean you are necessarily off the hook for potential hurricane-level impacts.
 Figure 1. A comparison of the original forecast cone for Hurricane Milton issued at 4 a.m. CDT October 8, 2024 (left) and how the same forecast would look in the revised cone graphic being used this year (right). The area crosshatched in blue and pink lines is under both a hurricane watch (pink) and a tropical storm warning (blue). The revised cone graphic will also use gray shading for the entire length of the cone, rather than for only the first three days of the five-day forecast period. (Image credit: NOAA/NWS/NHC) Figure 1. A comparison of the original forecast cone for Hurricane Milton issued at 4 a.m. CDT October 8, 2024 (left) and how the same forecast would look in the revised cone graphic being used this year (right). The area crosshatched in blue and pink lines is under both a hurricane watch (pink) and a tropical storm warning (blue). The revised cone graphic will also use gray shading for the entire length of the cone, rather than for only the first three days of the five-day forecast period. (Image credit: NOAA/NWS/NHC)
Read more...
0 comments
Posted on 7 June 2026 by BaerbelW, Doug Bostrom
A listing of 28 news and opinion articles we found interesting and shared on social media during the past week: Sun, May 31, 2026 thru Sat, June 6, 2026.
Stories we promoted this week, by category:
Climate Policy and Politics (8 articles)
- Scilencing The Trump Administration would just as soon we didn't know stuff, especially about our planet The Crucial Years, Bill McKibben, May 31, 2026.
- Companies No Longer Report Greenhouse Gas Emissions And Climate Risk Progressive lawmakers and environmental groups strongly condemned the decision, arguing that it leaves investors in the dark regarding trillions of dollars in hidden climate liabilities and systemic economic risks. Climate News Now, Climate News Now, May 31, 2026.
- DOE restarts home efficiency rebates, and electrification is the biggest loser New rules for the $8.8 billion in program funding no longer promote electric home heating. The Daily Climate, Dan Gearino, Jun 02, 2026.
- Dismay as Trump officials to dismantle key ocean monitoring system Ocean Observatories Initiative, $368m network that has provided crucial climate data, latest victim of Trump cuts The Guardian, Maya Yang, Jun 02, 2026.
- USDA revamp of `climate smart` program left farmers reeling With dubious DOGE savings, the agency has left farmers with fewer tools to address the climate crisis. Civil Eats, Lisa Held, Jun 04, 2026.
- The wasting disease threatening US science and ‘Patient Earth’ Bulletin of the Atomic Scienctists, Benjamin Santer, June 4, 2026.
- California and New York weaken climate rules as red states ramp up green energy Republican-led states growing renewable capabilities at faster rate as Texas emerges as clean-energy leader The Guardian, Dharna Noor and Oliver Milman, Jun 04, 2026.
- Scientists warn Trump plan to axe US ocean monitoring system will leave world `flying blind` Experts say dismantling the ocean observation system will ‘severely degrade’ the accuracy of weather predictions Environment The Guardian, Karen McVeigh, Jun 05, 2026.
Climate Science and Research (7 articles)
- Current and Future Changes in Earth's Outgoing Infrared Spectrum Study finds fingerprint of global warming on infrared energy spectrum emitted by Earth. Geophysical Research Letters, Shaw et al., May 30, 2026.
- Antarctic climate change is coming: this will help us prepare Dr Gilbz on Youtube, Ella Gilbert, May 30, 2026.
- Trump Administration to Dismantle Ocean Monitoring System The $368 million network of instruments collecting data in both the Atlantic and Pacific has been critical to climate and ocean research. New York Times, Eric Niiler, June 1, 2026.
- Climate-based tool predicts coral bleaching months in advance, offering critical lead time for reef protection Phys.org, Woods Hole Oceanographic Institution, Jun 02, 2026.
- Extreme weather is making Antarctic research harder, but new technology is providing some answers - new study The Conversation, Katharine Hendry, Jun 02, 2026.
- Skeptical Science New Research for Week #23 2026 Skeptical Science's weekly survey of newly published academic climate research and select government/NGO climate-related reports and analysis. Skeptical Science, Doug Bostrom & Marc Kodack, Jun 04, 2026.
- Satellite images reveals mangroves rebounding worldwide - but here's why they could still 'drown' A new study finds mangrove forests are no longer shrinking worldwide and offering hope for coastal protection and climate resilience, but sea level rise remains a threat. Live Science, Kenna Hughes-Castleberry, Jun 04, 2026.
Read more...
0 comments
Posted on 5 June 2026 by SkS-Team
From time to time, we announce housekeeping items that cover various changes in the Skeptical Science (SkS) web site. Today, it's an important one for all people who are posting comments on our articles: an update to the Comments Policy.
Reasons for the Updates
The Comments Policy is an important document at SkS: not only does it provide guidance for the behaviour of commenters, but it also provides guidance to the moderators on how to deal with comment threads that are starting to go off the rails. The moderation team strives to apply a reasonably uniform level of moderation, and the Comments Policy is the set of rules we follow.
We have been discussing some updates internally over the past few weeks, and now it is time to have the changes go live. The changes have been prompted by a few recent comments that started to use AI to generate text. (We'll stick with the formal definition of AI as "Artificial Intelligence", although I am sure that readers will have their own favorite interpretation.) Moderators have been asking commenters to limit their use of AI, but there is nothing in the previous Comments Policy related to AI. That is now changing.
Essentially all of the previous Comments Policy (archived here) is still in force. There are a few changes in wording, and the order has changed slightly, but if it was in the old Comments Policy, it is in the new one. The updated Comments Policy groups the various policies under six headings, as follows:
The new material falls under the "Speak for yourself and back up your argument" heading. The main text in that section talks about the importance of providing links to relevant information, explaining what the reader should find at those sources, etc. SkS is about the science of climate change, and scientific discussion expects references to relevant material and proper citation of sources. Two items from the old Comments Policy are located here: "No sloganeering", and "No link or picture only". But there are two new items of importance, related to copying large blocks of text or images from other sources. The first item covers copying from regular sources such as journals, reports, web pages, etc. The second specifically covers the use of AI-generated text.
Using AI in comments
In essence, when you use AI to generate text and want to add it to a comment, you are no longer speaking for yourself - you are quoting a different source. Proper scientific citation rules require that you indicate that you are quoting a different source, and provide a reference to what that source is. To quote from the updated policy: "Quoting or copying material from other sources without a proper citation constitutes plagiarism, which is not allowed."
Read more...
1 comments
Posted on 4 June 2026 by Doug Bostrom, Marc Kodack
Open access notables

Historical Volcanic Eruptions Mitigated the Expected Rapid Arctic Sea Ice Decline Prior to 2000, Wang et al., Geophysical Research Letters
Arctic sea ice has declined at sharply contrasting rates over the past four decades—modest before 2000 and rapid thereafter. Using observational and model evidence, we show that large tropical volcanic eruptions can trigger decade-long Arctic sea ice recoveries, and that without the 1982 El Chichón and 1991 Pinatubo eruptions, Arctic sea ice would have declined approximately 1.5 times faster before 2000. We further show a model's sensitivity to volcanic aerosol forcing scales with its sensitivity to GHG forcing across CMIP6 models, offering a new strategy to identify models with realistic climate response to radiative forcing. Following this, a selected subgroup of models that accurately simulate long-term warming trend and decade-long post-Pinatubo recovery project ice-free Arctic summer up to 20 years earlier than the full ensemble. These findings underscore the critical, yet underappreciated, importance of evaluating climate models against anthropogenic and volcanic forcing when projecting the future of Arctic sea ice.
Legacy wells supporting net zero by screening carbon storage and geothermal potential in the United States, Rajput et al., Communications Earth & Environment
Depleted oil and gas reservoirs provide an opportunity to repurpose underperforming wells and reuse existing subsurface infrastructure to support Net Zero transitions. Here we present a United States wide screening analysis of underperforming wells to estimate upper bound technical potential for carbon storage and geothermal heat. Using public well inventories, county level carbon removal cost datasets, national scale storage resource maps, and geothermal resource data, and accounting for well integrity attrition and field scale constraints, we estimate carbon storage potential of approximately 0.024–1.17 gigatonnes per year and geothermal heat potential of approximately 1–35 gigawatts thermal across high potential regions. Avoided drilling and deferred abandonment may indicate upper bound cost benefits, although repurposing costs remain site-specific. Key constraints include well integrity and cooling during injection; a retrofittable downhole choke is evaluated to mitigate this during startup. These results highlight conditional potential and the need for site-specific assessment.
Northern permafrost represents a limit on the northward shift of climatically feasible agricultural frontiers under future warming, Xu et al., Communications Earth & Environment
Global warming is expected to shift crop suitability northward, but the role of permafrost remains unclear. Here we integrate permafrost degradation impacts to project the suitability of seven major crops across the Northern Hemisphere (30°N–83°N). By the end of the century, the northern boundary of crop climatic suitability zones shifts northward by ~331 km and ~739 km under the SSP1–2.6 and SSP5–8.5 scenarios, respectively. Considering this shift and permafrost degradation, zones with persistent near-surface permafrost remain limited (~5%) but vary widely (3–19%) across different permafrost degradation assumptions. By the end of the century, newly emerging frontiers of climatically feasible agriculture reach 4.86 and 11.64 million km² under SSP1–2.6 and SSP5–8.5, respectively, of which 29% and 18% may remain unsuitable for cultivation due to persistent permafrost thaw disturbances. Our results indicate that permafrost is a non-negligible constraint on the northward shift of climatically feasible agricultural frontiers.
Caught in the Fray. How Climate Scientists Navigate the Public Sphere, Abramov et al., Environmental Communication
Climate scientists are increasingly drawn into a polarized public sphere, challenging relations between science and society. In this study, we interviewed thirty-five climate scientists – diverse in discipline and seniority – working in the Netherlands about their perceptions of, and experiences with public engagement. Based on our empirical material, we construct an analytical framework with a politization and participation axis on which we position their statements. Demarcating their public activities along these dimensions, climate scientists highlight concerns for scientific credibility, political efficacy, normative responsibility and individual capacity. While there is a clear opposition between those compelled to advocate for stringent climate policies or tackle misinformation and those who believe their main role is to provide solid knowledge and leave the normative choices to activists or politicians, only few scientists collaborate with stakeholders. Letting different stakeholders speak and participate in knowledge productions, we argue, may provide a solution to the science vs politics stranglehold.
Widespread intensification of global river hydrograph flashiness under climate change, Zhu et al., Communications Earth & Environmen
Flooding poses an increasing threat to lives and infrastructure worldwide, yet how river flow responds under climate change remains uncertain. Here we assess future changes in river hydrograph flashiness, defined as the rate of increase in streamflow normalized by time and drainage area, using a numerical hydrological model driven by multiple climate model projections. We analyze 520 major river basins globally. Results show that flashiness is projected to increase by about 14%, 30%, and 79% by the late twenty-first century under low-, intermediate-, and high-emission scenarios, respectively, relative to 2014. Increases are greater in low-latitude basins than in high-latitude regions. These changes are mainly associated with larger differences between peak and base flow and shorter times to reach peak discharge. Overall, our findings suggest that river floods are likely to become faster and more intense in a warming climate, posing growing challenges for flood risk management and infrastructure design.
From this week's government/NGO section:
UPDATE: Colorado River Basin Storage Continues Slide Toward System Crash, Castle et al., Getches-Wilkinson Center, University of Colorado Law School
If the Colorado River Basin (Basin) experiences another dry year, similar to Water Year 2025, it is likely that reasonably accessible storage in Lake Powell and Lake Mead would be mostly depleted, even if consumptive uses and losses are at or near historic lows. Run-of-the-river operations would shortly ensue. This would be an outcome with devastating consequences. In contrast, if next year is very wet, similar to Water Year 2023, the Basin’s largest federal reservoirs would recover somewhat, but would provide only about two years of cushion before we find ourselves again in the same position we are in today, unless consumptive use decreases further. This recovery would be welcome but would provide only a brief reprieve from crisis. Both scenarios demonstrate the need to adopt significant additional measures to permanently decrease consumptive uses across the entire Basin.
Americans Are Increasingly Pessimistic About Avoiding the Worst Effects of Climate Change, Brian Kennedy and Isabelle Pula, Pew Research Center
About six-in-ten Americans say countries around the world, including the U.S., will not do enough to avoid the worst effects of climate change. Among Democrats, this share has increased from 51% in 2022 to 69% in 2026. About half of U.S. adults say tech companies can do a lot to address climate change, but few expect technology to actually solve problems caused by climate change in the future. A majority of Americans, especially Democrats, say the federal government is doing too little on climate change. This overall share is slightly higher than it was during the Biden administration.
117 articles in 63 journals by 940 contributing authors
Physical science of climate change, effects
Read more...
0 comments
Posted on 3 June 2026 by Guest Author
This is a re-post from The Climate Brink by Andrew Dessler
I’ve long been struck by how hard it is to predict the evolution of our energy system, even a few years in advance, never mind 25 or 30 years. I still remember the “peak oil” craze in the mid 2000s, when people were telling me the end of oil was nigh. It sounded convincing right up until it turned out to be wrong.
In this post, let me show you how bad previous predictions have been for the electricity sector.
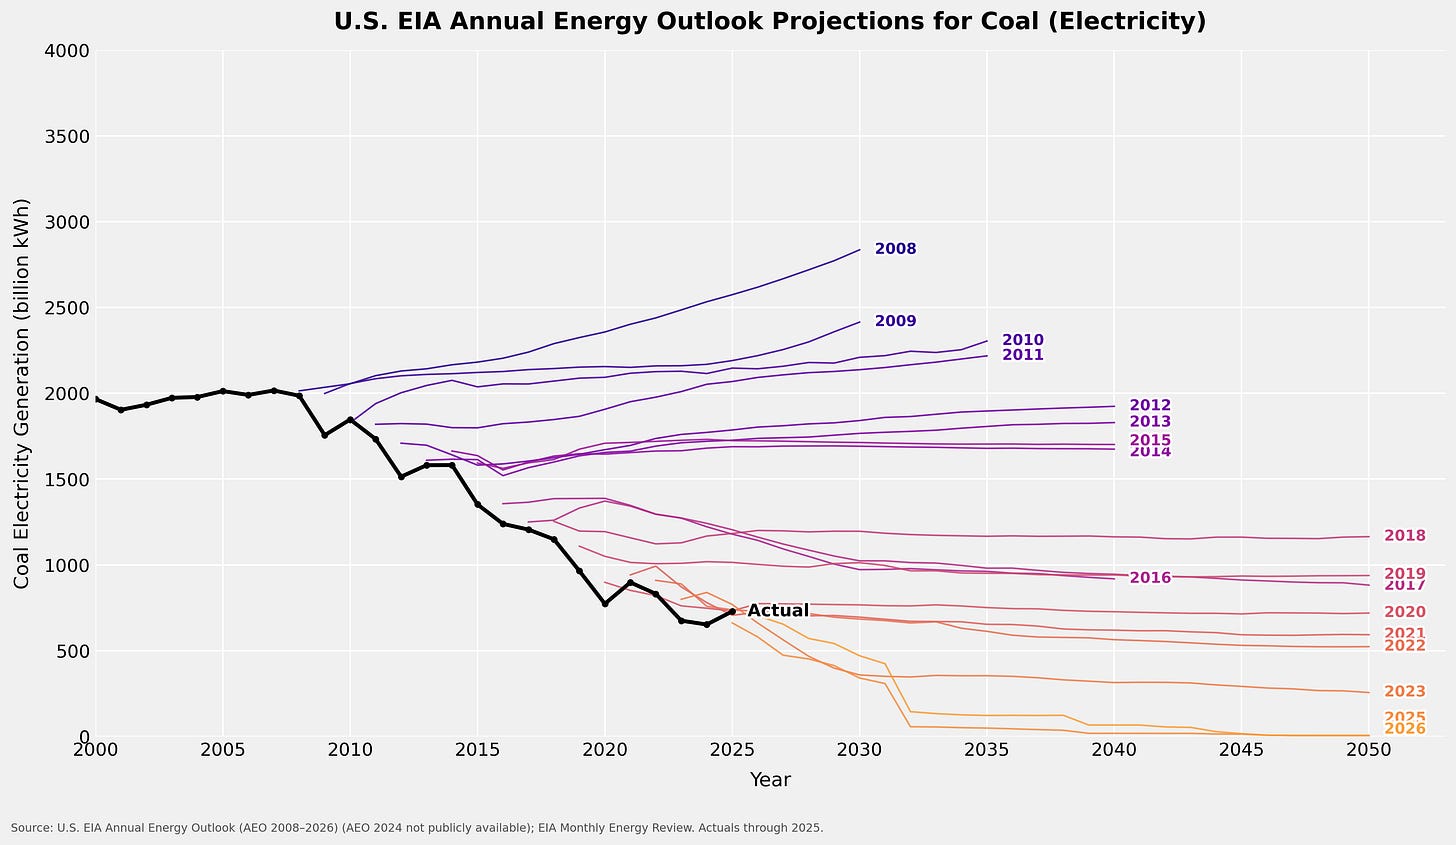
Each plot below shows annual predictions of how a particular source of electricity will evolve as well as what actually happened. The data come from the Energy Information Administration and cover the U.S. electricity sector.
We’ll start with coal. In the first plot, the black line shows actual U.S. coal-fired electricity generation. The colored lines are predictions made each year since 2008.
In 2008, coal was expected to produce increasing amounts of electricity into the future. Instead, it immediately started to decline and it took until 2023 before the EIA began to predict a long-term decline in coal, despite the fact that coal had been declining for 15 years.
Natural gas, by contrast, has generated an increasing share of U.S. electricity. This is largely due to the tidal wave of cheap natural gas from fracking. The predictions, on the other hand, did not anticipate this.
Read more...
0 comments
Posted on 2 June 2026 by Sue Bin Park
 Skeptical Science is partnering with Gigafact to produce fact briefs — bite-sized fact checks of trending claims. You can submit claims you think need checking via the tipline. Skeptical Science is partnering with Gigafact to produce fact briefs — bite-sized fact checks of trending claims. You can submit claims you think need checking via the tipline.
Do electric vehicles almost always have a lower carbon footprint than gasoline-powered cars?
 The EPA, IPCC, and many independent studies have found that electric vehicles have lower lifetime emissions than gas-powered vehicles in nearly all cases. The EPA, IPCC, and many independent studies have found that electric vehicles have lower lifetime emissions than gas-powered vehicles in nearly all cases.
“Lifetime” calculations include emissions released during EV manufacture, as well as the generation of electricity used to charge the car. An average 300-mile range EV produces less than half the lifetime emissions of a conventional 30 miles per gallon car.
This is mainly because EVs are significantly more energy efficient than gasoline cars: over 77% of electricity input is converted to power at the wheels, compared to a conversion of 12-30% of energy in gasoline to wheel power. Meanwhile, the lack of tailpipe emissions offsets an electric sedan or SUV’s initial manufacture emissions within just 1.5-2 years of regular use.
As the U.S. power grid becomes increasingly renewables-based, EVs’ emissions superiority vis-a-vis gas-powered vehicles will continue to grow.
Go to full rebuttal on Skeptical Science or to the fact brief on Gigafact
This fact brief is responsive to quotes such as this one.
Sources
U.S. Environmental Protection Agency Electric Vehicle Myths
U.S. Department of Energy Electric Vehicle Benefits and Considerations
IPCC Sixth Assessment Report Chapter 2: Emissions trends and drivers
U.S. Department of Energy All-Electric Vehicles
Environmental Research Letters The role of pickup truck electrification in the decarbonization of light-duty vehicles
U.S. Environmental Protection Agency Power Sector Evolution
Columbia Law School Sabin Center for Climate Change Law Rebutting 33 False Claims About Solar, Wind, and Electric Vehicles
Please use this form to provide feedback about this fact brief. This will help us to better gauge its impact and usability. Thank you!
Read more...
0 comments
Posted on 1 June 2026 by dana1981
This is a re-post from Yale Climate Connections
Thanks to the transition from fossil fuels to clean technologies, what used to be considered the worst-case climate change scenario now appears to be outside the realm of plausibility, climate scientists said in a recent study.
That study made headlines in May when President Donald Trump falsely claimed that climate scientists had admitted that their projections had been wrong, a claim akin to an anti-vaxxer gloating that the official end of the pandemic proved that COVID was never a problem.
And the study contained sobering news: The best-case climate scenario is close to slipping out of reach, and a business-as-usual scenario is still a very dangerous one, with high risks of widespread species extinctions, extreme heat-related illnesses and deaths, and expanding vector-borne diseases like malaria.
World makes progress on climate change
Scientists developed the worst-case climate change scenario known as RCP8.5 nearly 20 years ago.
A 2010 paper described RCP8.5 as representing the 90th percentile of plausible climate-warming emissions, cautioning that the RCPs “are neither forecasts nor policy recommendations, but were chosen to map a broad range of climate outcomes.” A 2011 paper summarizing RCP8.5 noted that this scenario envisioned a world with high population growth, slow improvements in energy efficiency, and a heavy reliance on fossil fuels, including a nearly tenfold increase in coal consumption.
Although the U.S. government under Trump favors high birth rates, has dismantled energy efficiency programs, and supports coal and other fossil fuels, policies implemented around the world over the past decade have shifted us away from the characteristics of RCP8.5, leading scientists to say it is now implausible.
Spurred by the 2015 Paris Climate Agreement and dramatically falling costs of clean energy technologies, many countries have increasingly transitioned away from climate-warming fossil fuels. All global growth in electricity demand last year was met by clean sources – predominantly solar panels – European energy think tank Ember and the International Energy Agency recently reported.
 Change in annual global electricity demand (blue line) and the amount met by fossil fuels (gray bars), solar power (dark green bars), and other clean sources (light green bars) between 2000 and 2025. (Graphic: Ember) Change in annual global electricity demand (blue line) and the amount met by fossil fuels (gray bars), solar power (dark green bars), and other clean sources (light green bars) between 2000 and 2025. (Graphic: Ember)
Read more...
1 comments
Posted on 31 May 2026 by BaerbelW, Doug Bostrom
A listing of 28 news and opinion articles we found interesting and shared on social media during the past week: Sun, May 24, 2026 thru Sat, May 30, 2026.
Stories we promoted this week, by category:
Climate Change Impacts (7 articles)
- Malnourished Gray Whales of the Eastern North Pacific Are in `Serious Trouble` The population has plummeted over the past seven years as climate change triggers mass starvation in warming Arctic waters. Inside Climate News, By Blaine Harden, May 24, 2026.
- An Unusually Early Heat Wave Breaks Temperature Records Across Western Europe 'This is an unprecedented event with a one in 1,000 chance of happening at this time of year based on the climate from 1979 to 2025 and virtually impossible in the preindustrial era,'' Christophe Cassou, a climate scientist, told Le Monde. Inside Climate News, Kiley Price, May 26, 2026.
- UK heatwave has `fingerprints of climate change all over it` It’s clearly exceptional when the May temperature record falls not once but twice in two days’ The Independent News, Nick Ferris, May 26, 2026.
- It's so friggin' hot Dr Gilbz on Youtube, Ella Gilbert, May 26, 2026.
- `Mind-bogglingly crazy`: climate experts alarmed by deadly spring heatwaves searing Europe Scientists warn of ‘new reality’ of heat extremes that claim three times more lives than car crashes and 16 times as many as murderers The Guardian, Ajit Niranjan, May 27, 2026.
- Western Europe is roasting in unprecedented spring heat - and it`s not alone Climate scientist Christophe Cassou said the heat in France would have been virtually impossible in the preindustrial era. Yale Climate Connections, Bob Henson, May 27, 2026.
- An Arctic community on the climate front lines | Science The harsh realities of global warming are becoming difficult to ignore in Norway’s Longyearbyen Science, Sarah Boon, May 28, 2026.
Climate Education and Communication (5 articles)
- How the jet-setting commissaries of the climate change quango use dodgy statistics to peddle hysteria - and justify their own existence: MATT RIDLEY Op-ed is a display of classic climate-denier tactics intended to change the subject and swerve public attention from what's important. Mail Online, Matt Ridley, May 22, 2026.
- Twenty Years After His Film, Al Gore Tweaks the Climate Script Mr. Gore is still giving the slide show that ''An Inconvenient Truth''” was built around, but with changes that reflect a shift in the discussion of climate change. NYT, Chico Harlan, May 25, 2026.
- Which of your climate actions make the biggest difference? Here`s how to find out The Conversation, Charlotte A. Kukowski and Kimberly Nicholas, May 27, 2026.
- Translating Climate Awareness Into Action at New York High Schools State of the Planet, Emma Kyzivat, Aynsley Kretschmar and Laurel Zaima-Sheehy, May 28, 2026.
- Ask a Climate Therapist: Is it still `catastrophizing` if the threat is real? Psychotherapist Leslie Davenport breaks down some of the tools that can help manage anxiety in the face of mounting climate catastrophe. Grist, Leslie Davenport, May 29, 2026.
Read more...
0 comments
Posted on 28 May 2026 by Doug Bostrom, Marc Kodack
Open access notables
Climate Change Communication in the Age of Artificial Intelligence, Schäfer et al., Wiley Interdisciplinary Reviews Climate Chang
Artificial intelligence (AI), and especially generative AI (GenAI), is rapidly reshaping climate change communication (CCC). Once dominated by news coverage and public campaigns, CCC now extends across scientists, NGOs, corporations, journalists, influencers, and citizens—all increasingly encountering and adopting AI tools. This article provides a comprehensive review of scholarship on the nexus of AI and CCC, synthesizing insights scattered across disciplines from social and computer science, and interdisciplinary fields like environmental and science studies. It identifies robust patterns alongside significant gaps, highlighting areas where future research is needed. Based on existing evidence, it shows that AI—as of now—functions less as a disruptive replacement of established communication and information-seeking practices rather than as an assistive layer in CCC: accelerating routine newsroom tasks, enabling personalized and multilingual outreach, and generating new textual, visual, and multimodal representations of climate change. Stakeholders use AI to monitor discourse, expose greenwashing, and broaden access to climate information, though systematic research on uptake and effects remains limited. Journalists experiment cautiously with AI, emphasizing human oversight, while influencers and content creators are understudied despite their growing role. The potential of AI-driven systems for fact-checking, policy analysis, and creative engagement has been explored, yet studies remain heavily English-centric and focused on text. Citizen studies reveal promises and risks: generative dialogues can reduce skepticism and foster engagement, but biases, misinformation, and equity concerns persist. Advancing the field requires comparative and interdisciplinary agendas that integrate computational and traditional methods, foreground transparency and inclusion, and address how AI can equitably support awareness, trust, and climate action.
Vacuuming the Sky? Metaphorical Framing in News Coverage of Carbon Dioxide Removal Methods, Bruggen et al., Environmental Communication
Discussions of proposed climate solutions, such as carbon dioxide removal (CDR), are multi-layered and contested. This study examines the role that metaphors play as frame devices in news coverage (2018–2024) about CDR. Using critical metaphor analysis, we examined 257 articles from major UK, US, and Canadian news outlets to identify and interpret contrasting metaphorical expressions from journalists and their sources, including industry, science, and civil society. We find that a wide range of source domains, including references to, e.g. historical events, household objects, crime, religion, and medical analogies, is used to metaphorically frame CDR. These metaphors reflect actors’ competing ideologies and interests, rooted in hopeful rational-optimist and socio-ecological visions. We also discuss how metaphor use could influence public engagement and policy and reflect on how language might oversimplify or obscure critical aspects of the technology.
Consensus Messaging Shifts Beliefs About Climate Change in a Field Experiment, Rode et al., Science Communication
Previous research on climate change consensus messaging has mostly taken place in controlled lab settings. In this field experiment, we engaged U.S. residents (N = 158) in brief doorstep conversations on climate change. Research assistants read a script about the scientific consensus (treatment) or basic facts about climate change (control) and then provided participants with a magnet containing the same information. The consensus message had a significant positive effect on consensus estimates (β = 0.45) and belief in climate change (β = 0.41), but not on other downstream attitudes or behavior. These results mostly align with theory and have implications for consensus messaging.
From this week's government/NGO section:
24/7 renewables. The economics of Firm Solar and Wind, Dardour et al., The International Renewable Energy Agency
The authors show that the cost of firm renewable electricity has declined rapidly across all major technologies and markets. In high-quality solar and wind resource regions, co-located hybrid systems can already deliver round-the-clock electricity at costs competitive with - and in many cases below - those of new fossil-fuel generation. China currently defines the global cost floor, while costs in Brazil, India, South Africa, Australia, and the Gulf region are declining rapidly towards fossil-fuel cost parity. The authors identify key drivers of firm renewable costs – technology performance, resource quality and system configuration – and examine the policy levers that are proving decisive in translating cost competitiveness into deployment at scale. They conclude that the technologies are maturing, the costs are falling and the commercial demand is growing. The pace at which firm renewable electricity is deployed will be among the most consequential determinants of the global energy transition in the decade ahead.
Climate Promises, Industry Handouts. Canada’s Fossil Fuel Funding in 2025, Environmental Defence Canada
The Government of Canada has provided at least $10.2 billion in fossil fuel subsidies and public financing in 2025. Since Environmental Defence began tracking fossil fuel subsidies in 2020, the federal government has provided at least $85.2 billion in subsidies to the fossil fuel industry. This figure includes government direct spending as well as public financing through Crown corporations, such as Export Development Canada. In addition to fossil fuel subsidies, the Government of Canada provided at least $405.53 million dollars in subsidies for carbon capture and fossil fuel hydrogen projects in 2025. These technologies have failed to deliver on their promises to reduce emissions and have instead locked in further fossil fuel production. Furthermore, this figure excludes the estimated cost of the carbon capture investment tax credit, which is estimated to cost Canadians up to $5.7 billion by 2028, and up to $12.4 billion by 2035. The changes introduced in the Budget 2025 could increase the cost to Canadians by an additional $3.75 billion. In 2025, the cost of pollution from oil and gas companies operating in Canada was an estimated $56.4 billion. This figure was calculated by taking the most recent oil and gas emissions figures and multiplying with the social cost of carbon. Climate pollution created by oil and gas companies has massive costs, including health costs, property damage from extreme weather events, and decreased agricultural productivity due to changing weather patterns. The social cost of carbon helps to estimate what those costs to society are.
76 articles in 46 journals by 755 contributing authors
Physical science of climate change, effects
Intensified Stratosphere–Troposphere Ozone Transport over Asia under a High-End Climate Trajectory, Luo et al., Journal of Climate 10.1175/jcli-d-25-0426.1
Read more...
0 comments
Posted on 27 May 2026 by Guest Author
This is a re-post from Yale Climate Connections by Jeff Masters
In brief:
- Scientists expect dramatic swings between active and inactive hurricane seasons in the future.
- The risk of back-to-back hurricanes is growing.
- Hurricanes are expected to get more damaging and deadly.
Wild year-to-year swings — from punishing hyperactive seasons to quiet years with little activity — could well become the norm for future Atlantic hurricane seasons, according to recent climate change research.
The latest science paints a complex but alarming future, as the unprecedented amount of heat that humans are supplying to the climate system disrupts the fundamental atmospheric circulation pattern in which we designed our civilization.
During the coming busy seasons, death and destruction from unprecedented hurricane catastrophes will probably grow much more commonplace, because even as risks grow, people have continued to build in risky flood-prone regions. But eventually, the coming hurricane catastrophes will pose an increasing threat to the viability of living in many coastal areas, particularly in the Caribbean.
Hurricane seasons will likely grow more erratic
The year-to-year variability of Atlantic basin hurricane activity already is the largest of any of the globe’s tropical cyclone basins. And climate change will make extreme swings between active and inactive hurricane seasons the norm, according to a 2024 paper, Projected increase in the frequency of extremely active Atlantic hurricane seasons.
The high-resolution climate models used in the study projected a 36% increase by 2050 in the variance of Atlantic tropical cyclone activity. The main causes: an increase in the variability of wind shear (strong upper-level winds that tend to tear a storm apart), and major swings in how stable the atmosphere is in the tropical Atlantic. One good thing is that the study found that the increased activity during hyperactive seasons would be focused farther from land over the eastern and central Atlantic, with less activity over the Caribbean.
A 2022 study, Extreme Atlantic hurricane seasons made twice as likely by ocean warming, found that ocean warming from 1982 to 2020 doubled the probability of extremely active hurricane seasons over that time period. However, the authors did not clearly separate out how much of that change resulted from increased heat-trapping greenhouse gases and how much was caused by a reduction in planet-cooling air pollution particles called aerosols. These particles are not likely to change much in the future, while greenhouse gases will be increasing, so it is important to know their relative impacts on ocean warming.
Read more...
0 comments
Posted on 26 May 2026 by Zeke Hausfather
This is a re-post from The Climate Brink by Zeke Hausfather, Glen Peters, and Piers Forster
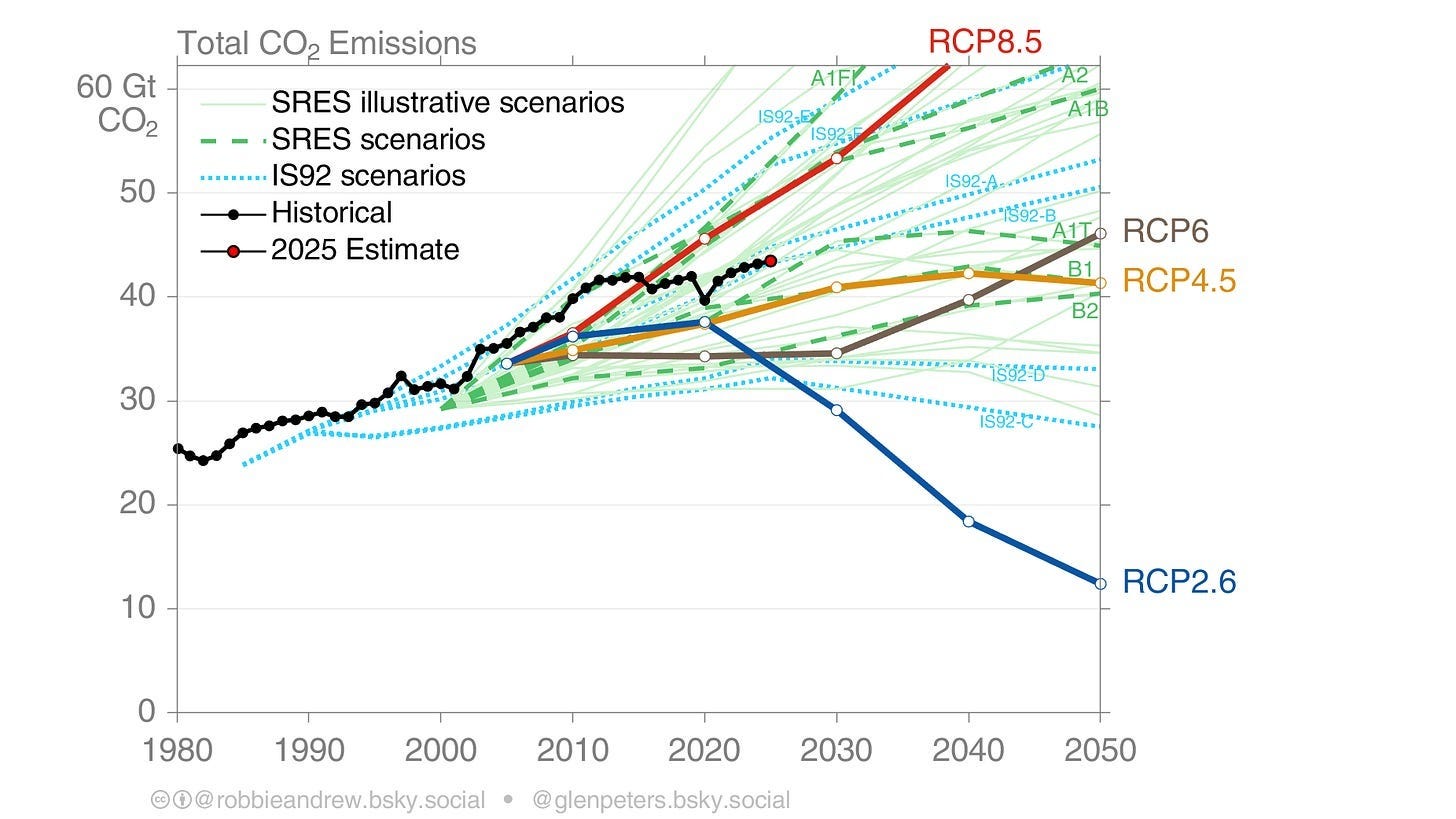
With the release of the new van Vuuren et al 2026 paper on the emissions scenarios that will be used in the upcoming IPCC 7th Assessment Report, the internet has been abuzz with debate over the implications of the formal retirement of the RCP8.5/SSP5-8.5 scenario. The president of the United States even weighed in over the weekend in his own unique style, posting that “the United Nations TOP Climate Committee just admitted that its own projections (RCP8.5) were WRONG! WRONG! WRONG!”.
van Vuuren et al justify this move by noting that “the CMIP6 high emission levels (quantified by SSP5-8.5) have become implausible, based on trends in the costs of renewables, the emergence of climate policy and recent emission trends,” citing the paper that we published in Nature back in 2020.
Actual global CO2 emissions (black) compared to different generations of emissions scenarios featured in IPCC reports. Updated by Glen Peters through 2025.
Others have pointed out that RCP8.5 was never particularly plausible, and have criticized claims that the move away from using these scenarios reflects actual progress on reducing emissions.
So what actually happened here? It turns out that two things can be true at the same time:
-
RCP8.5 (and its successor SSP5-8.5) were designed to be a worst case emissions scenario, not the most likely outcome even in a world that did nothing to address climate change. We were probably never headed to a tripling of global emissions by 2100 (to say nothing of a five-fold increase in coal use), even in the absence of climate policy.
-
Rapid declines in clean energy costs have bent the curve of future emissions downward, with new scenarios designed to reflect current policies notably lower than most baseline scenarios in the literature. The 21st century is now unlikely to see a continued expansion of fossil fuel use globally, with current policy scenarios reflecting relatively flat global emissions going forward.
Read more...
2 comments
Posted on 25 May 2026 by Ken Rice
This is a re-post from And Then There's Physics
If you’ve been paying attention to the climate debate on social media you might have noticed the RCP8.5 debate rearing it’s ugly head again. This is because a new set of emission/concentration projections have been developed for the climate modelling community (CMIP7). These new projections no longer include an RCP8.5-like projection and so all of those who have been critical of its use are now crowing about this proving them right.
I’ve written about RCP8.5 numerous times before. My views have probably evolve somewhat over time, but my previous posts are probably a reasonably good reflection of them. So, if you do want to know them, you could read some of these earlier post. I don’t want to delve too much into the re-invigorated “debate” but instead thought I’d post links to other posts/articles that I think explain the situation pretty well. If you want to read alternative takes, they’re not all that difficult to find. You can probably guess the authors.
I will, though, repeat the sub-heading of Gavin’s Realclimate post:
The fantasy version of the normal updating of scenarios for a new round of CMIP simulations doing the rounds is bad faith BS.
Links to other posts:
Scenarios, Schemarios – Gavin Schmidt at Realclimate.
On the death of RCP8.5 – Zeke Hausfather, Glen Peters and Piers Foster at Climate Brink.
Factcheck: Trump’s false claims about the IPCC and ‘RCP8.5’ climate scenario – multiple authors at Carbon Brief.
IPCC does not create scenarios – Reto Knutti at Linkedin
Sorry, climate change is still dangerous, no matter what nonsense Trump emits – Bulletin article by Genevieve Guenther
Read more...
0 comments
Posted on 24 May 2026 by BaerbelW, Doug Bostrom
A listing of 28 news and opinion articles we found interesting and shared on social media during the past week: Sun, May 17, 2026 thru Sat, May 23, 2026.
Stories we promoted this week, by category:
Climate Policy and Politics (6 articles)
- What the US Would Lose If It Eliminates the National Center for Atmospheric Research 'I think there's a great loss for the wrong reasons. There's no good reason for dismantling this or tearing it down,'' a former NASA chief scientist says. Inside Climate News, Interview by Steve Curwood, Living on Earth, May 16, 2026.
- `Green card for the planet`? Fifa`s World Cup is on pace to be a climate catastrophe The 2022 World Cup failed to deliver on its environmental promises. From air travel emissions to heat-related dangers, the 2026 edition will be even worse The Guardian, Jules Boykoff, May 17, 2026.
- EPA claims `overwhelming rejection` of EVs as it moves to loosen air pollution rules Administration creates conditions to slow EV adoption and then uses the results to promote fossil fuel consumption. Inside Climate News, Anika Jane Beamer, May 19, 2026.
- Trump Officials, Billionaires and the Quiet Reshaping of America`s Public Lands A controversial land swap orchestrated by the megarich could be “a harbinger of what’s to come” for public lands under Trump. Inside Climate News, Evan Simon and Ames Alexander, May 21, 2026.
- Colombia`s climate crossroads: Trumpism casts shadow over presidential battle Colombia is a global leader in climate activism. Could US influence drag country to a future of mining and fracking? The Guardian, Jonathan Watts, May 21, 2026.
- The network watching the world`s oceans is under pressure - just when it`s needed most The Conversation, Kevin Trenberth, May 22, 2026.
Climate Change Impacts (5 articles)
- Wild Blueberry Farms Across Maine Suffer as Climate Change Upends Growing Seasons Like lobster rolls, wild blueberries are iconic in Maine. But heat and drought have set the plants back to a point where many small farmers are struggling against reduced yields and increased costs for mulch and irrigation. Inside Climate News, Sydney Cromwell, May 11, 2026.
- Scientists warn that the world`s rivers are running out of oxygen Rivers around the world are quietly running out of oxygen — and climate change is emerging as the main culprit. ScienceDaily, CAS press release, May 17, 2026.
- `It`s no longer exceptional`: Karachi struggles under brutal new reality of extreme heat Experts say the unseasonably hot weather across south Asia shows the impact of the climate crisis. The Guardian, Asad Mumtaz Rid, May 17, 2026.
- Global warming is accelerating 5,000 times faster than rice can evolve Climate change is pushing rice-growing regions into temperatures beyond those at which rice has been cultivated in the past 9,000 years of human history. Live Science, Stephani Pappas, May 19, 2026.
- The outlook for a climate-regulating ocean current is…not good A key ocean current that warms Europe is weakening, spurring a controversial megadam proposal Science News, Carolyn Gramling, May 20, 2026.
Read more...
0 comments
Posted on 21 May 2026 by Doug Bostrom, Marc Kodack
Open access notables
Attribution of UK Temperature Changes to Anthropogenic and Natural Factors, Amos et al., Atmospheric Science Letters
Understanding the extent to which human activities have influenced regional climate is a key scientific and policy challenge. The UK is one of the world's best observed regions climatically, with a long and reliable temperature record that makes it an important test case for regional detection and attribution. Here, for the first time, we apply optimal fingerprinting to UK mean 2-m air temperature changes using the Estimating Equations method, HadUK-Grid observations, and CMIP6 simulations. We assess the extent to which observed UK temperature changes can be explained by natural internal variability, anthropogenic forcings, and natural external forcings. We detect a significant anthropogenic influence on warming in recent decades and identify greenhouse gases as the main driver. We also detect a cooling contribution from other anthropogenic influences in the mid-twentieth century, likely dominated by sulphate aerosols. These results update earlier UK-focused work and demonstrate that human influences, both warming and cooling, are detectable even at the national scale.
Sustained deoxygenation in global flowing waters under climate warming, Guan et al., Science Advances
Dissolved oxygen (DO), as a vital material sustaining aquatic ecosystems, has declined markedly in oceans, lakes, and coastal waters, yet unbiased understandings of changing DO concentrations in each individual river segment globally remain a challenge. Here, we estimate DO concentrations in 21,439 rivers globally between 1985 and 2023, based on Landsat observations and climatic data, and examine their patterns and trends. We find sustained deoxygenation in global rivers, at a rate of −0.045 mg liter−1 decade−1, with 78.8% experiencing fluvial deoxygenation, driven mainly by oxygen solubility and temperature. Moreover, short-term heatwaves and dam impoundment exert non-neglecting influence on these changes. Future projections demonstrate that global fluvial DO concentrations decline by 1.1% ± 1.6% under SSP1–2.6 and 4.7% ± 2.7% under SSP5–8.5 throughout the 21st century. Our study provides an unbiased baseline for escalating deoxygenation in global fluvial ecosystems that underscores targeted measures to mitigate deoxygenation threats and protect ecosystem health.
Emergent constraints on future methane emissions from global wetlands, Zhang et al., Nature Geoscience
Future methane (CH4) emissions from natural wetlands are predicted to increase due to global warming, leading to positive feedback on climate change. However, the magnitude of this increase remains highly uncertain. Here we present novel ensemble simulations of seven state-of-the-art terrestrial biosphere models to estimate wetland CH4 emissions (eCH4) during the twenty-first century. Our estimates suggest that for every 1 °C increase in global land surface temperature, there is a 24 ± 10 Tg CH4 yr−1 increase in eCH4. We also identify an emergent relationship between contemporary temperature dependence and projected eCH4. When constrained by 163 site-year eddy-covariance measurements of eCH4, we show that wetland emissions can increase by 50–60% by the 2090s relative to the 2010s under a high-warming scenario. The projected decadal increase in eCH4 from the 2010–2019 baseline to the 2030s would very likely (90% probability) offset an amount equivalent in scale to 8–10% of anthropogenic eCH4 at the 2020 level, comparable to the reductions committed under the Global Methane Pledge. However, the constraint is dominated by mid- and high-latitude observations, with limited tropical coverage, and uncertainties in projected wetland inundation contribute substantially to uncertainty in eCH4. Our findings reduce the uncertainty in projected wetland methane–climate feedback and highlight its potential impacts on methane mitigation efforts to slow global warming.
Challenges and opportunities of the full phase-out of fossil fuels under the 1.5 °C goal, Mori et al., Nature Communications
The COP28 decision called for transitioning away from fossil fuels, sparking a growing interest in their full phase-out. However, energy system transformation pathways towards a phase-out of fossil fuels, which may reduce the reliance on carbon dioxide removal to meet the 1.5 °C goal, remain unclear. Here, we employ two global energy system models to explore energy system transformations and the challenges and opportunities associated with attaining a full phase-out of fossil fuels. We found that phasing out fossil fuels by 2050 would require accelerating direct and indirect electrification, involving 1.6–1.8-fold increases in power generation compared to the conventional cost-effective 1.5 °C pathways. This transition from cost-effective to fossil fuel phase-out pathways would increase energy supply investments by up to 34% over this century and require accelerated deployment of solar and wind power, as well as electrolysers. Despite opportunities including lower reliance on carbon dioxide removal and increasing probability of returning to 1.5 °C after temperature overshoot, these additional requirements imply that international society must approach the transition towards zero-fossil energy systems with strong determination.
Scientific authority cues increase the spread of misinformation, Harrando et al., Proceedings of the National Academy of Sciences
Misinformation continues to circulate on social media, often because people unintentionally share posts without verifying their accuracy. We show that references to scientific entities, what we call Scientific Authority Cues, play an important role in this problem. Analyzing 8.7 million posts on Twitter (X), we find that these cues are associated with an increase in sharing, especially when sharing low veracity content, and when users lean politically to the right. A preregistered experiment with U.S. adults shows that attributing claims to scientific entities increases people’s willingness to share them by making claims seem more accurate. These findings reveal an important tension: Signals of scientific authority can also make misinformation more credible and thus easier to spread.
From this week's government/NGO section:
The AI Climate Hoax: Behind the Curtain of How Big Tech Greenwashes Impacts, Ketan Joshi, Beyond Fossil Fuels, Standearth, Climate Action Against Disinformation et al
The analysis collected the most prominent AI climate claims and determined a) what types of AI were referred to and b) what evidence was presented to back up those claims. The author found that 1. Most claims of climate benefit relate to ‘traditional’ AI, which has a much lower environmental impact than consumer generative AI tools. Even if these benefits are real, they are unrelated to - and dwarfed by - the massive expansion of energy use from the generative AI industry. 2. Where claims of traditional AI climate benefits are made, they tend to rely on weaker forms of evidence, such as corporate websites, rather than published academic research. Only 26% cited published academic research while 36% did not cite any evidence at all. This analysis shows that to bring the deployment of digital services in bounds with the physical limits of the planet, tech companies investing in AI should implement actual sustainability measures rather than masking ever-worsening damage to the climate and environment with vague terms and weak evidence.
Survey: U.S. and Canadian Business Confidence in Climate Action Remains Strong, Melissa Fifield, BMO Climate Institute
The fourth edition of the BMO Climate Institute Business Leaders Survey was conducted in January 2026 and included 741 respondents, including 370 in Canada and 371 in the U.S. Survey respondents include individuals in a senior role at their company (e.g. C-suite, President, Vice-President, Executive Director or General Manager) and who consider themselves to be senior decision makers. Companies range from those with at least five employees to more than 500 employees. Nearly three-quarters (73%) of respondents say they have or are developing plans to address climate-related risks, up from 69% in 2025. Extreme and unpredictable weather is a top concern for business leaders considering the impact of climate-related risks on their companies. Competitive pressure, customer expectations, and regulatory change are expected to drive further climate action. Three?fifths of respondents say AI is already used in daily operations or climate planning. Costs remain the most frequently cited obstacle to developing an effective climate plan.
101 articles in 48 journals by 751 contributing authors
Physical science of climate change, effects
Future changes of upscale ocean kinetic energy transfer under greenhouse warming, Wang et al., npj Climate and Atmospheric Science Open Access pdf 10.1038/s41612-026-01429-1
Mean State Change-Induced Differential Responses Between Strong Positive and Negative Events Reduce Indian Ocean Dipole Asymmetry Under Greenhouse Warming, Wang et al., Journal of Geophysical Research Atmospheres 10.1029/2025jd045190
Read more...
0 comments
Posted on 20 May 2026 by Guest Author
This is a re-post from Yale Climate Connections by Bob Henson
The odds are in El Niño’s favor right now.
This natural weather phenomenon, part of the El Niño-Southern Oscillation, or ENSO, occurs when warmer-than-average water extends throughout most of the equatorial Pacific Ocean just below the surface. That’s happening now. And powerful bursts of westerly wind have pushed immense amounts of warm water eastward, toward the Niño3.4 region where sea surface temperature, along with other atmospheric conditions, is used to assess the state of ENSO.
On May 14, in its monthly ENSO outlook, the NOAA/National Weather Service Climate Prediction Center gave an 82% chance that El Niño will be in place for the period May through July, which implies that it’ll be here within weeks.
How do experts know when El Niño has arrived?
El Niño conditions are declared when the atmosphere and ocean are in sync and the Niño3.4 sea surface temperature is at least 0.5 degrees Celsius (0.9°F) warmer than the seasonal average.
But just as hurricanes can and do stray from the “cone of uncertainty” at times, it’s vital to remember that El Niño can do much the same. Preparing for the prototypical outcomes is a smart move, as long as you keep in mind that forecasting the El Niño-Southern Oscillation is more a matter of probabilities than certainties.
NOAA now uses a Relative Oceanic Niño Index, or RONI, in which the Niño3.4 value is adjusted relative to the world’s tropical oceans as a whole; the goal is to keep global warming from smudging the signal of El Niño and La Niña events themselves.
Read: A new and better way to keep tabs on El Niño and La Niña
Nearly all seasonal forecast ensembles used to predict ENSO at agencies around the world now concur that the imminent event is likely to bring Niño3.4 warming of at least 1.5°C, which would push it into the “strong” category. And some of the ensemble averages are now going well above 2°C, even for the adjusted RONI index. That would put it in the ballpark of the biggest El Niño events in the NOAA database going back to 1950.
Individual ensemble members still cover a fairly broad range, with outcomes varying from a weak event to a record-stomping one, but as shown below, they’re about as close to being unanimous on a significant El Niño as you’re likely to see. (This output is mainly using the traditional pre-RONI index, which tends to run slightly hotter on recent El Niño events.)
What’s a ‘super El Niño’ – and will we get one?
Back in 2003, a group of researchers from Australia’s national science agency, CSIRO, invoked the term “super El Niño” in a Monthly Weather Review paper. They used it to describe events where the Niño3.4 departure from average was at least 3°C. The phrase has since been used more loosely around the world, especially in news articles and social media, but it’s not part of the toolbox of most professional ENSO forecasters.
“While ‘Super El Niño’ is sometimes used informally, it is not a scientific term,” said senior climatologist Felicity Gamble in a statement from Australia’s Bureau of Meteorology, which avoids the “super” moniker in its products.
The same is true of NOAA, which is going with “weak,” “moderate,” “strong,” and “very strong.” NOAA’s monthly ENSO outlooks now include month-by-month odds that a predicted El Niño event will fall into each of these four brackets. The odds of a “very strong” event peak at 37% in the November-to-January period.
Summing these categories, the odds that we will have El Niño at any strength are now greater than 90% from this summer through winter 2026-27, according to NOAA.
 Figure 1. Probabilities from NOAA’s May 14 outlook that the expected El Niño event of 2026-27 will fall into various strength categories during each overlapping three-month period through December-February. El Niño events typically build in northern summer and fall, peak in the winter, and fade by spring. Unlike La Niña, El Niño rarely persists or recurs for two or more years in a row, though that occasionally happens. (Image credit: NOAA/NWS/CPC) Figure 1. Probabilities from NOAA’s May 14 outlook that the expected El Niño event of 2026-27 will fall into various strength categories during each overlapping three-month period through December-February. El Niño events typically build in northern summer and fall, peak in the winter, and fade by spring. Unlike La Niña, El Niño rarely persists or recurs for two or more years in a row, though that occasionally happens. (Image credit: NOAA/NWS/CPC)
Jan Null of Golden Gate Weather Services, a California-based forensic meteorologist and former National Weather Service forecaster, began using “very strong” when the 2015-16 event arrived, so he’s happy to see NOAA doing the same. As Null puts it, “Everyone sees a forecast plume that looks like the liftoff of Artemis and goes crazy, and somehow early on attached the ‘super’ superlative to it.”
Read more...
0 comments
Posted on 19 May 2026 by Sue Bin Park
Skeptical Science is partnering with Gigafact to produce fact briefs — bite-sized fact checks of trending claims. You can submit claims you think need checking via the tipline.
Does electromagnetic radiation from wind turbines pose a threat to human health?
 Electromagnetic fields (EMFs) from wind turbines are well below international exposure safety limits. Electromagnetic fields (EMFs) from wind turbines are well below international exposure safety limits.
Wind turbines produce EMFs mainly from their electrical equipment. Multiple studies have found their strength to be lower than everyday exposure to many common household appliances, such as microwaves and vacuum cleaners.
In a field study at a Canadian wind farm, average magnetic fields at the base of operating turbines were around 0.1 microtesla (µT) and dropped to background levels within 2 meters. Turbines under high wind and low wind conditions emitted equivalent levels of radiation. Another 2020 study found wind turbines produced under 0.1 µT at 4 meters distance.
For comparison, an electric can opener measures about 60 µT at 6 inches but 0.2 µT at 4 feet. International guidelines set a safety reference level of 100 µT at 50 Hz, far above the turbine measurements reported in field studies.
Go to full rebuttal on Skeptical Science or to the fact brief on Gigafact
This fact brief is responsive to quotes such as this one.
Sources
Environmental Health Measuring electromagnetic fields (EMF) around wind turbines in Canada: is there a human health concern?
Radiation Protection Dosimetry EXTREMELY LOW FREQUENCY ELECTROMAGNETIC FIELD EXPOSURE MEASUREMENT IN THE VICINITY OF WIND TURBINES
World Health Organization Radiation: Electromagnetic fields
Frontiers in Human Health Wind Turbines and Human Health
Columbia Law School Sabin Center for Climate Change Law Rebutting 33 False Claims About Solar, Wind, and Electric Vehicles
Please use this form to provide feedback about this fact brief. This will help us to better gauge its impact and usability. Thank you!
Read more...
0 comments
Posted on 18 May 2026 by Guest Author
This is a re-post from Yale Climate Connections by Rafael Méndez Tejeda
El Niño is (probably) coming back later this year.
And this time, it’s unfolding against a backdrop of unusually warm oceans and an even warmer climate system than the last time we experienced this natural climate pattern.
Here is what you need to know about it.
What is El Niño?
The term El Niño is part of a broader phenomenon called El Niño-Southern Oscillation, or ENSO. It’s a recurring climate pattern involving changes in sea surface temperatures across the central and eastern tropical Pacific.
Copernicus, a European climate data service, reported that in March 2026, the average sea surface temperatures in the Pacific reached 20.97°C – the second-highest value ever recorded for March, which suggests a likely transition toward El Niño conditions.
The El Niño-Southern Oscillation is one of the planet’s most important natural mechanisms through which the ocean and atmosphere exchange energy and reorganize the global climate from year to year.
The phenomenon has three phases: the warm phase is El Niño, the cool phase is La Niña, and between the two lies a neutral or transitional phase, when neither dominates clearly. The changes occur in the tropical region of the Pacific Ocean, within 700 miles of the equator.
The consensus among climate models – including those from NOAA – indicates with high probability the onset and subsequent intensification of El Niño starting in fall 2026, with some models suggesting it could be an unusually intense event.
We can anticipate more heat waves with a strengthening El Niño, along with more extreme events ranging from heavy rainfall to drought. El Niño tends to intensify the subtropical jet stream, favoring wetter conditions and greater storm activity across the southern United States and northern Mexico, while the northern United States and Canada experience a relatively warmer and drier pattern, affecting snow cover and water availability. At the same time, the effects of El Niño usually reduce the frequency and intensity of hurricanes in the Atlantic Ocean.
The return of El Niño is not synonymous with climate change
El Niño is a natural phenomenon of the ocean-atmosphere system. But when it coincides with a planet already warmed by human activity, its effects can be amplified. The World Meteorological Organization warned that during the last El Niño period (2023–2024), the combination of El Niño and climate change hit Latin America and the Caribbean with greater force, worsening droughts, heat waves, wildfires, extreme rainfall, and other impacts with significant human and economic costs.
El Niño affects more than the Pacific region
Although El Niño originates in the equatorial Pacific Ocean, its effects extend to other regions of the planet through processes known as climate teleconnections – atmospheric links that allow massive cloud formations to develop as a result of the enormous evaporation generated by the warming of ocean waters.
El Niño disrupts what is known as the Walker Cell or Walker Circulation, a tropical atmospheric circulation system that transports heat, moisture, and energy on a large scale. These disturbances propagate through the atmosphere in the form of planetary waves, modifying global pressure and wind patterns. As a result, El Niño’s influence reaches the Atlantic Ocean and the Caribbean, where significant changes in regional climate occur.
Among these effects are a tendency toward drier conditions in certain periods due to descending air and a redistribution of heat that contributes to higher temperatures and more intense heat waves. In short, even though El Niño occurs far from where most Yale Climate Connections readers live, its impact is clearly felt because Earth’s climate system is interconnected, and atmospheric disturbances can travel vast distances.
During El Niño, increased variability in wind direction and speed – which inhibits hurricane formation – can act as a buffer against hurricane activity. However, hurricane formation in the Atlantic depends on multiple factors, including conditions in the Atlantic itself – such as sea surface temperatures, atmospheric moisture, and the Azores High, a large semipermanent center of high atmospheric pressure that sits over the North Atlantic near the Azores islands. And when it comes to hurricanes, we should never let our guard down completely.
 How El Niño affects hurricane formation in the Pacific and Atlantic Oceans. (Image credit: NOAA / Climate.gov) How El Niño affects hurricane formation in the Pacific and Atlantic Oceans. (Image credit: NOAA / Climate.gov)
Read more...
0 comments
Posted on 17 May 2026 by BaerbelW, Doug Bostrom
A listing of 28 news and opinion articles we found interesting and shared on social media during the past week: Sun, May 10, 2026 thru Sat, May 16, 2026.
Stories we promoted this week, by category:
Climate Change Impacts (10 articles)
- This critical climate system is tipping…. Or is it? DrGilbz on Youtube, Ella Gilbert, May 9, 2026.
- This summer, the American water crisis becomes real Concerns over water access are poised to consume summer in the U.S., as crises in Corpus Christi and across the Colorado River threaten to boil over. Grist, Molly Taft, May 10, 2026.
- Poll: Most Coloradans say climate change is harming human health More than 1 in 3 Coloradans say they or a loved one has experienced a climate-change related health impact, according to new survey data Colorado Sun, John Ingold, May 11, 2026.
- Why has this autumn been so hot and dry? Australia's autumn behaves as expected from climate models The Conversation, Kimberley Reid, May 11, 2026.
- 2026 Has Already Broken Climate Records. El Niño Could Break More. The increasingly likely emergence of an El Niño this summer will likely continue the year’s record-breaking weather trends and could lead to “an unprecedented year of global fire,” according to a statement from World Weather Attribution, a climate research collaboration. Eos, Grace van Deelen, May 12, 2026.
- Some climate shocks can increase the likelihood of war Researchers warn against oversimplifying climate change’s role in conflicts, but some conditions can increase the likelihood of violence. The Daily Climate, EHN Curators, May 12, 2026.
- Something startling is happening in the Gulf of Mexico Its waters are heating up twice as fast as the global oceans, with huge implications for hurricane risk. Yale Climate Connections, Jeff Masters, May 13, 2026.
- Melting of Greenland ice sheet could release large stores of methane Seismic surveys and sediment cores suggest that dozens of deep pockmarks on the sea floor were created when Arctic methane stores were disrupted by climate change after the last glacial maximum. New Scientist, Alec Luhn, May 14, 2026.
- Scientists find climate change is reducing oxygen in rivers worldwide Global warming is causing rivers to slowly lose oxygen, threatening fish and other lives. The Independent News, Seth Borenstein, May 15, 2026.
- Are we wrong about this..? Dr Gilbz on Youtube, Ella Gilbert, May 15, 2026.
Climate Science and Research (4 articles)
- Why Should You Care About Changes In Atlantic Ocean Currents? Mechanisms and impacts of a collapsing Atlantic Meridional Overturning Circulation (AMOC) explained— good to know because AMOC cessation is currently a favorite hobbyhorse of climate denialists due to it being convenently confusing. CleanTechnica, Carolyn Fortuna, May 09, 2026.
- Antarctica is melting from below and scientists say it`s worse than expected Hidden warm-water traps beneath Antarctica’s ice shelves may be speeding up sea level rise far faster than expected. ScienceDaily, iC3 Polar Research Hub, May 10, 2026.
- Drilling Into the Thwaites Glacier in Antarctica A deep read on the why, how and extraordinary challenges of obtaining deep samples of the sea level critical Thwaites glacier, with some spectacular photographs. NYT, Raymond Zhong and Chang W. Lee, May 11, 2026.
- A New Study Explains How Carbon Dioxide Cools the Upper Atmosphere-and Warms Earth Below In a new study, researchers from Columbia University describe the phenomenon’s mechanics, illuminating how it is largely determined by the way carbon dioxide (CO2) interacts with different wavelengths of light. State of the Planet, Columbia Climate School, May 12, 2026.
Read more...
0 comments
|
|


The Consensus Project Website
THE ESCALATOR

(free to republish)
|


 Arguments