


 Arguments


Arctic sea ice... take 2
Posted on 25 August 2010 by gpwayne
NOTE: Last Monday, I must have had a senior moment - I meant to post the new Basic version of the "Arctic sea ice has recovered" argument but somehow ended up copying and pasting the Intermediate version. I'll take this as a cautionary tale not to rush a blog post just before going to sleep. In the meantime, here is the actual Basic version written by Graham Wayne:
Discussions about the amount of sea ice in the Arctic often confuse two very different measures of how much ice there is. One measure is sea-ice extent which, as the name implies, is a measure of coverage of the ocean where ice covers 15% or more of the surface. It is a two-dimensional measurement; extent does not tell us how thick the ice is. The other measure of Arctic ice, using all three dimensions, is volume, the measure of how much ice there really is.
Sea-ice consists of first-year ice, which is thin, and older ice which has accumulated volume, called multi-year ice. Multi-year ice is very important because it comprises most of the volume of ice at the North Pole. Volume is also the important measure when it comes to climate change, because it is the volume of the ice – the sheer amount of the stuff – that science is concerned about, rather than how much of the sea is covered in a thin layer of ice*.
Over time, sea ice reflects the fast-changing circumstances of weather. It is driven principally by changes in surface temperature, forming and melting according to the seasons, the winds, cloud cover and ocean currents. In 2010, for example, sea ice extent recovered dramatically in March, only to melt again by May.
Sea-ice is subject to powerful short-term effects so while we can't conclude anything about the health of the ice from just a few years' data, an obvious trend emerges over the space of a decade or more, showing a decrease of about 5% of average sea-ice cover per decade.
")
Source: Rayner et.al, 2004, updated
Where has the thick ice gone?
When we consider the multi-year ice and look at the various measurements of it, we see a steep decline in this thick ice. As you might imagine, thick ice takes a lot more heat to melt, so the fact that it is disappearing so fast is of great concern.
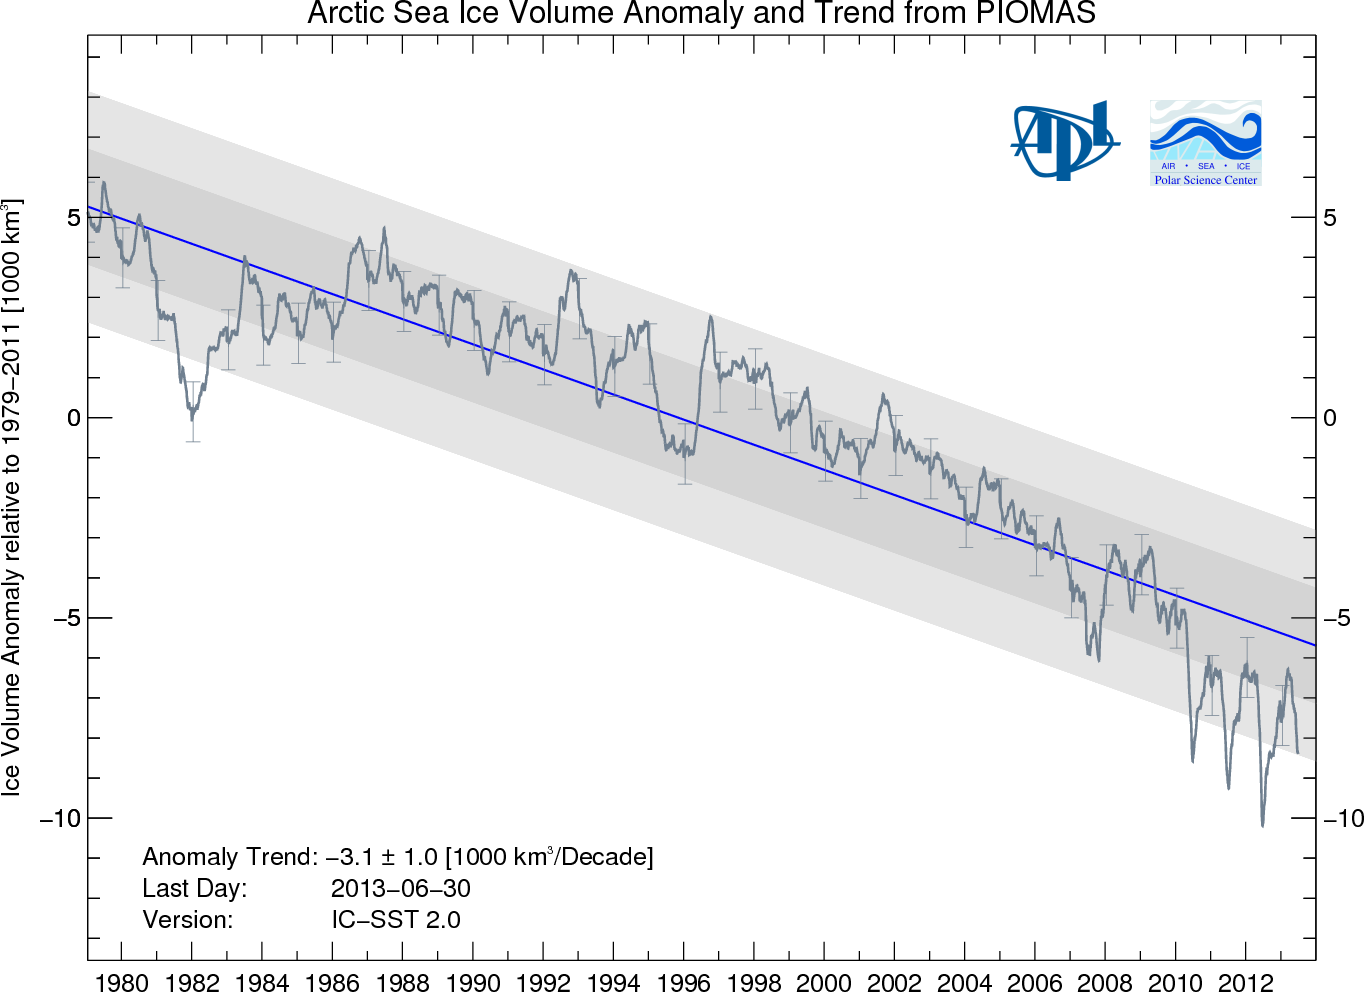
Source: Polar Science Centre, University of Washington
It is clear from the various data sets, terrestrial and satellite, that both the sea ice extent and multi-year ice volume are reducing. Sea ice extent recovered slightly during the Arctic winters of 2008-09, but the full extent of annual ice reduction or gain is seen in September of each year, at the end of the Arctic summer. The volume of multi-year ice has not recovered at all, and is showing a steeply negative trend.
* Footnote: Although a thin layer of ice doesn’t tell us much about the overall state of ice loss at the Arctic, it does tell us a great deal about Albedo, the property of ice to reflect heat back into space. When the sea ice diminishes, more heat passes into the oceans. That heat melts the thick ice and speeds up the melting of thinner sea ice, which in turns allows more heat to accumulate in the oceans. This is an example of a positive feedback.


 0
0  0
0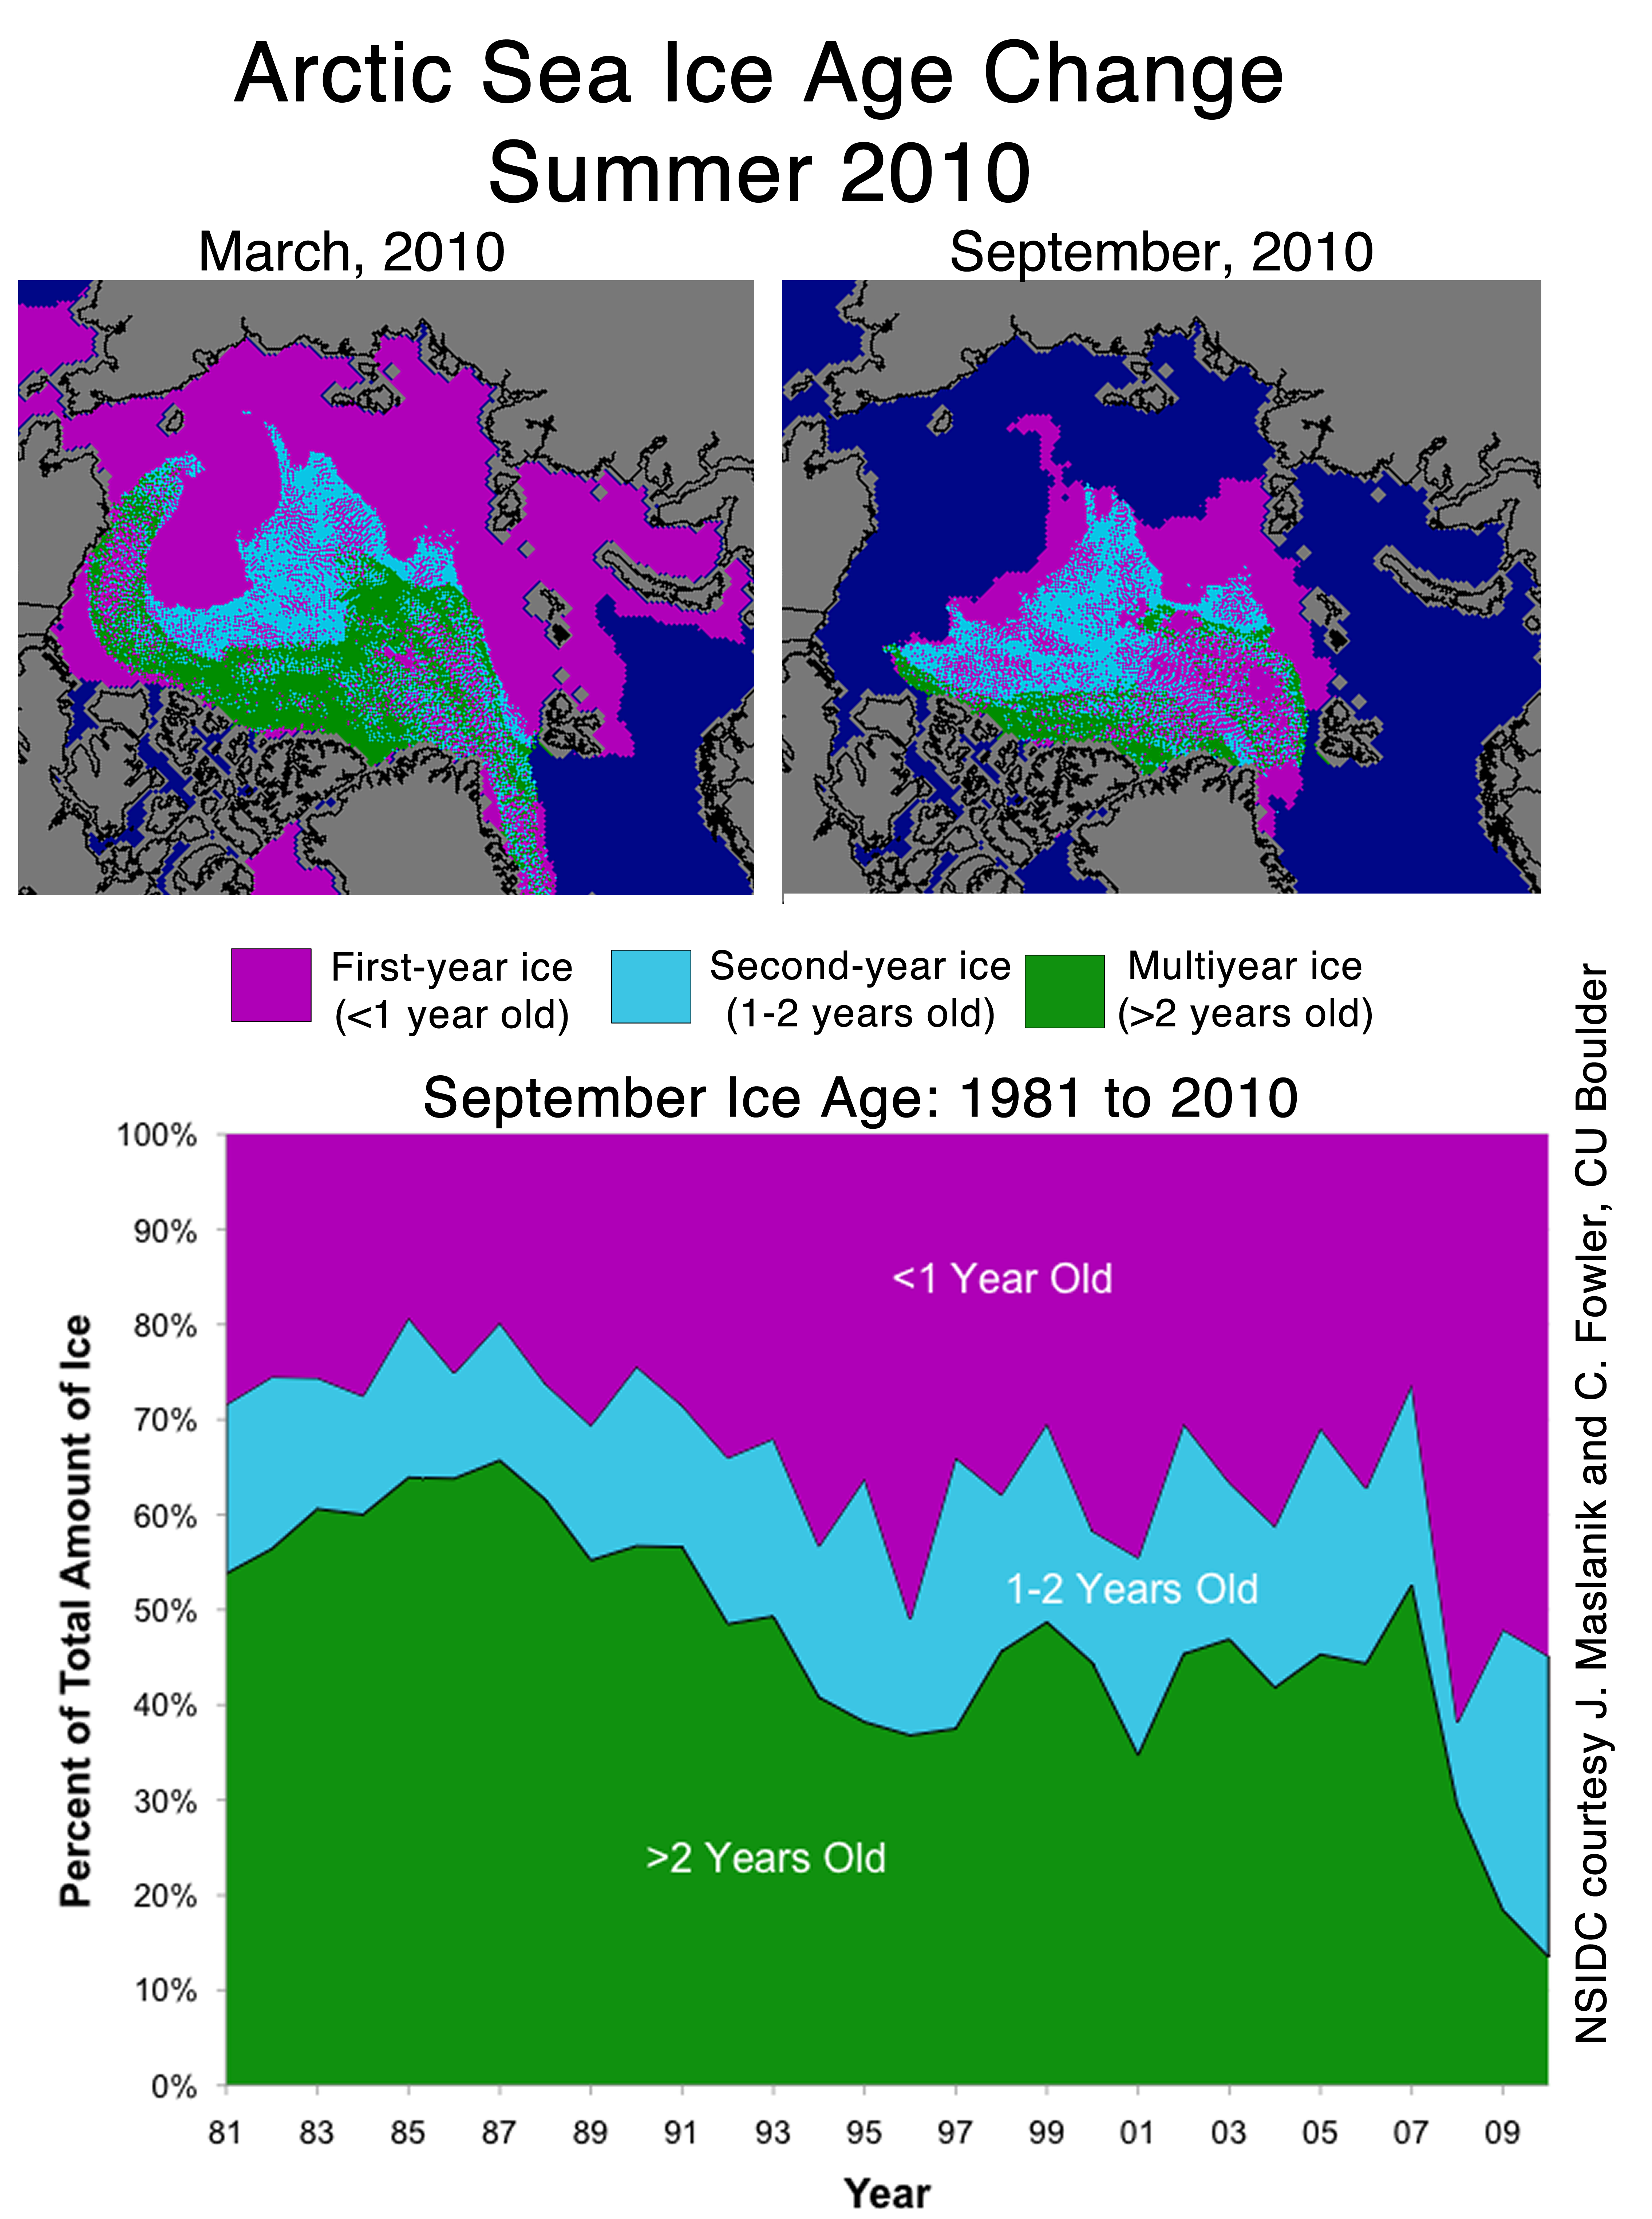


Comments