Climate Science Glossary

Term Lookup

Enter a term in the search box to find its definition.

Settings

Use the controls in the far right panel to increase or decrease the number of terms automatically displayed (or to completely turn that feature off).

Term Lookup

Settings


All IPCC definitions taken from Climate Change 2007: The Physical Science Basis. Working Group I Contribution to the Fourth Assessment Report of the Intergovernmental Panel on Climate Change, Annex I, Glossary, pp. 941-954. Cambridge University Press.

Home Arguments Software Resources Comments The Consensus Project Translations About Support

Bluesky Facebook LinkedIn Mastodon MeWe

Twitter YouTube RSS Posts RSS Comments Email Subscribe


Climate's changed before
It's the sun
It's not bad
There is no consensus
It's cooling
Models are unreliable
Temp record is unreliable
Animals and plants can adapt
It hasn't warmed since 1998
Antarctica is gaining ice
View All Arguments...


Username
Password
New? Register here
Forgot your password?

Latest Posts

Archives

Monckton Myth #12: Arctic Temperature Changes

Posted on 16 February 2011 by robert way

The Warming Arctic

Monckton Myths (200 x 70 pixels)A common misconception that is found to exist within the blogosphere is that the Arctic (hereby defined at 64 to 90 °N) was warmer than present during the early-to-mid 20th century. In particular this claim has been supported by anecdotal evidence of reduced sea ice cover and pronounced warming at *some* Arctic stations at that time. This argument is brought forth by Lord Monckton in April of 2009 whereby he claims that "Temperatures in the Arctic and in Greenland were warmer by up to 3 Fahrenheit degrees (~1.6°C) in the late 1930s and early 1940s than they are at present". Monckton provides no evidence that he conducted an Arctic-wide analysis of air temperatures but rather seems to suggest that he selected a few stations which supported his narrative rather than examining all of the evidence. As real scientists tend to be very skeptical beasts, it is important that we assess his claim for quality to ensure that it is not based solely on a cherry-pick. 

In order to do so I ran clear climate code’s Gistemp reimplementation using Python and also their scripts for adding in more data from Environment Canada that was otherwise not included in the Gistemp analysis. This implementation is likely the best representation of the trends in the Arctic as it assumes that stations in the high Arctic follow similar trends to stations in the low Arctic whereas other methods (HadCrut) exclude these regions thereby assuming they have similar trends to the global trend. The accuracy of the reconstruction can be validated through comparison with the various reanalysis datasets which are reassessments of temperature changes combining meteorological stations, satellite measurements, weather balloon data and meteorological models. I have included the National Centers for Environmental Prediction (NCEP) reanalysis dataset for comparison.

So what do the results show?


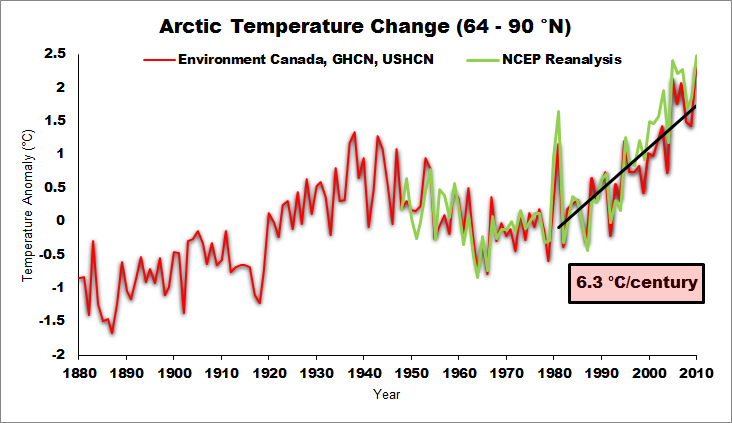
Figure 1: Temperature Anomalies (1951-1981 Baseline) for the Arctic region (64-90°N) over the past 130 years according to ccc-gistemp analysis and NCEP reanalysis.

It is evident based upon Figure 1 that the late 20th to early 21st century warming in the Arctic far exceeds the warming experienced during the 1930s and 1940s. This is supported by calculating a 10-year running means which shows that the 10-year period from 2001 to 2010 was 0.79°C warmer than the warmest 10-year period during the early-to-mid 20th century. Monckton's claim of that period being 1°C greater than the current warming is therefore proven to be incorrect. It should also be noted that the warming over the last 30 years (1981-2010) shows an extraordinarily fast rate of warming (6.3°C/century) using ccc-gistemp.

Another way of looking at the data

What about when we order the anomalies by year?


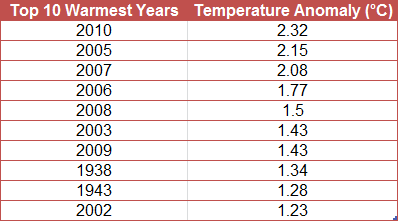
Table 1: Top 10 Warmest Years in the Arctic according to ccc-gistemp analysis.

As is readily apparent, the Arctic was NOT warmer than it is currently and in fact 2010 was the warmest year the Arctic has experienced since instrumental records began. Out of the top 10 warmest years only 2 years predate the 2000s. This post should provide a definitive answer as to whether the warming of the early century was greater in the Arctic than currently. The answer is a resounding no.

As a side note, temperature reconstructions for the Arctic are now for the most part widely accessible and I was able to run this one in 20 minutes. There is no practical reason why Monckton selects but a few stations for his analysis and ignores the overwhelming majority of evidence presented here and elsewhere. There are just no excuses.

0 0

Printable Version  |  Link to this page

Comments

Comments 1 to 17:

  1. I thought that the Arctic was defined either as the 10C isotherm or the tree-line (both of which are moving north) and was internationally recognized as all areas north of the Arctic Circle. Extending it as far south as 64N does seem a bit generous. Even so, Robert Way again shows that Monckton has yet to make a substantive statement on global warming, its causes and effects which is either accurate or excludes misrepresentation of peer reviewed science. I still don’t understand why global warming produces temperature change in the Arctic 3 times greater than in the tropics. Surely this can not be attributed solely to lower albedo due to sea-ice melt?
    0 0
  2. Agnostic - there is this article on why. (It's not simple - its what the GCMs predict).
    0 0
  3. And more recent (with references to earlier reviews) Serreze et al 2009
    0 0
  4. Agnostic, I chose 64 to 90 N because its the easiest way to partition it in the Gistemp algorithm. It naturally includes that region as its own zone so it makes it easier to extract from that region. The other key point is that what defines the Arctic is very difficult to conclusively define. Lets consider this, northern Labrador is considered to be part of the Canadian East Arctic but the furthest north in Labrador is 60 N. The arctic treeline there is near 57 N which is very low and the mountains there have the only biome consisting of Arctic Cordillera outside of the very high Arctic. Mean annual air temperatures (MAATs) in the region are as low as -7°C. That region is excluded from my analysis but I could make very strong arguments for its inclusion. Nonetheless it is very difficult to conclusively define what is Arctic and what is not and you make an interesting point.
    0 0
  5. Flanner et al. (2011) might address your previous point pertaining to the forcing at the poles. In particular note the following "On the basis of these observations, we conclude that the albedo feedback from the Northern Hemisphere cryosphere falls between 0.3 and 1.1 W m−2 K−1, substantially larger than comparable estimates obtained from 18 climate models."
    0 0
  6. Regarding polar amplification, don't forget Screen and Simmonds (2010).
    0 0
  7. Thanks to all for advice/references. Much appreciated - Screen & Simmonds (2010) is very clear. Implications for the Greenland IS do seem bleak.
    0 0
  8. Thanks for that S&S paper, Albatross. So much for the long-heralded "recovery". Albedo-flip, here we come. The Yooper
    0 0
  9. The rate of warming you obtain is consistent with graphs shown by Peter Hogarth in the post on northern hemisphere warming rates. Arctic amplification, we are here.
    0 0
  10. Just curious, though-how does the warming per *decade* for 1979-2010 compare to, say, 1900-1931 or 1930-1961?
    0 0
  11. It makes no sense to describe the present warming as 6.3 degrees per century, because this will not continue for a century. Figure 1 shows a warming of 1.3 degrees per century, with oscillations of plus or minus 1.5 degrees. The period 1980-2010 was not the period with the fastest warming, because 1920-1945 had a faster warming (8 degrees per century, I guess). The present warming can be expected to reverse, as the NAO goes into its negative phase and solar activity is extremely low. My prediction for 2030: 1.5 degree below the 2010 level, and all years from 2030 to 2040 will be cooler than the past ten years.
    0 0
  12. fydijkstra, "because 1920-1945 had a faster warming (8 degrees per century, I guess)." You "guess". Does that mean you haven't actually calculated the warming trend over that time period? I think you're posting in the wrong forum if you want an audience that considers trend estimation by eyeball a credible analytic technique.
    0 0
  13. fydijkstra, Eye-balling it is a flawed methodology. Lets consider this though, I used 1981-2010 because it was the 30 year trend period. If I were trying to inflate the trend I would have used 1982 instead because 1981 had a really high anomaly. In fact if I use 1982 I get a trend of 7.2 per century and if I used 1986 to 2010 I get a trend of 8.0 per century... If I use your "cherry picked" 1920-1945 graph I get 3.5 per century. I assume you were trying to pick the coldest time to the warmest over that period so here it is, from 1917 to 1938 it warmed at 7.6 per century. Still less than the present warm period. But what is interesting about picking that time period is you are selecting from the trough associated with a major volcanic eruption and including the recovery in the trend. Regarding your other commentary, the NAO is not the key oscillation for determining the warmth of the Arctic, try the AMO which is well established to contribute to Arctic warmth (Chylek et al. 2009 and Chylek et al 2010). The early century warming had a much stronger positive AMO, extremely low volcanism, high solar irradience and a predominantly positive NAO. All the ingredients one would need for a warm period. Our current warm period in the Arctic is driven by GHG forcing with some contribution from the AMO and the remainder being likely due to ice albedo feedbacks which Flanner et al (2011) have found to be greater than previously understood.
    0 0
  14. fydijkstra: "My prediction for 2030: 1.5 degree below the 2010 level, and all years from 2030 to 2040 will be cooler than the past ten years." What was that saying about those who do not know that they do not know? Charitably we might say that they have an over confidence in their abilities. Less charitably, we might say that they exhibit an arrogance of ignorance.
    0 0
  15. @fdijkstra: Could you also please give a prediction for 2011-2030 ?
    0 0
  16. @fydijkstra: Care to go to Vegas with that?
    0 0
  17. For any Monckton fans http://www.youtube.com/user/potholer54#p/a/u/1/fbW-aHvjOgM Potholer54 has a go.
    0 0

You need to be logged in to post a comment. Login via the left margin or if you're new, register here.


The Consensus Project Website

THE ESCALATOR

(free to republish)


© Copyright 2024 John Cook
Home | Translations | About Us | Privacy | Contact Us