Articgate: perpetuating the myth that Arctic sea ice has recovered
Posted on 7 February 2011 by John Cook
In 2009, former astronaut Harrison Schmitt submitted a white paper to NASA, Observations Necessary for Useful Global Climate Models. In this paper, Schmitt crams in an impressive number of skeptic arguments - including the argument that we're currently experiencing cooling:
"How long this cooling trend will persist remains to be seen; however, Greenland glaciers have been advancing since 2006, Artic [sic] sea ice has returned to 1989 levels of coverage, and snowy, cold winters and cool summers have dominated northern North America and Europe"
I'm having trouble getting past the brazenness of using Greenland as evidence of cooling, considering over the last few years, Greenland has been losing over 200 billion tonnes of ice per year. But for now, let's look at Schmitt's argument that Arctic (we'll spell it correctly) sea ice had recovered in 2009. Over 1989, the average sea ice extent was 12.14 million square kilometres. In 2009, the average sea ice extent had fallen to 11.18 million square kilometres. Sea ice coverage was nearly 1 million square kilometres greater in 1989 compared to 2009. How can Schmitt claim sea ice returned to 1989 levels? The Heartland Institute leapt to his defence:
"In fact, National Snow and Ice Data Center records show conclusively that in April 2009, Arctic sea ice extent had indeed returned to and surpassed 1989 levels."
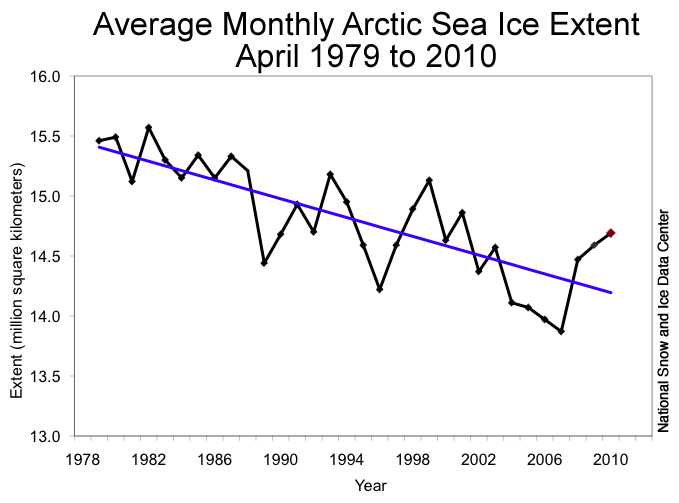
So they're comparing one month in 1989 to another month in 2009. Of all the measurements and data available, what they're looking at is this:

Figure 1: Arctic sea ice extent in April 1989 and April 2009 (NSIDC).
Is this giving you the full picture? There's a lot more to the story than two cherry-picked months. Over the last few decades, Arctic sea ice has shown a steady decline, particularly in summer months when sea ice extent is at a minimum.

Figure 2: Arctic sea ice extent (light blue is monthly and dark blue is the yearly average) from 1978 to 2010 (NSIDC).
Of course sea ice extent only tells you what's happening on the surface. More importantly, Arctic sea ice has been steadily thinning over the last few decades so the total amount of sea ice is declining. Satellites find that Arctic sea ice was thinning, even in 2008 and 2009 when sea ice extent showed a slight recovery from the 2007 minimum (Giles 2008, Kwok 2009). The total volume of Arctic Sea ice through 2008 and 2009 were the lowest on record (Maslowski 2010, Tschudi 2010).

Figure 3: Continuously updated Arctic Sea Ice Volume Anomaly (Polar Ice Center).
To claim Arctic sea ice has recovered in recent years is false. It fails to take into account the overall declining trend in Arctic sea ice extent and more importantly, the fact that the total amount of Arctic sea ice in recent years have been the lowest on record.
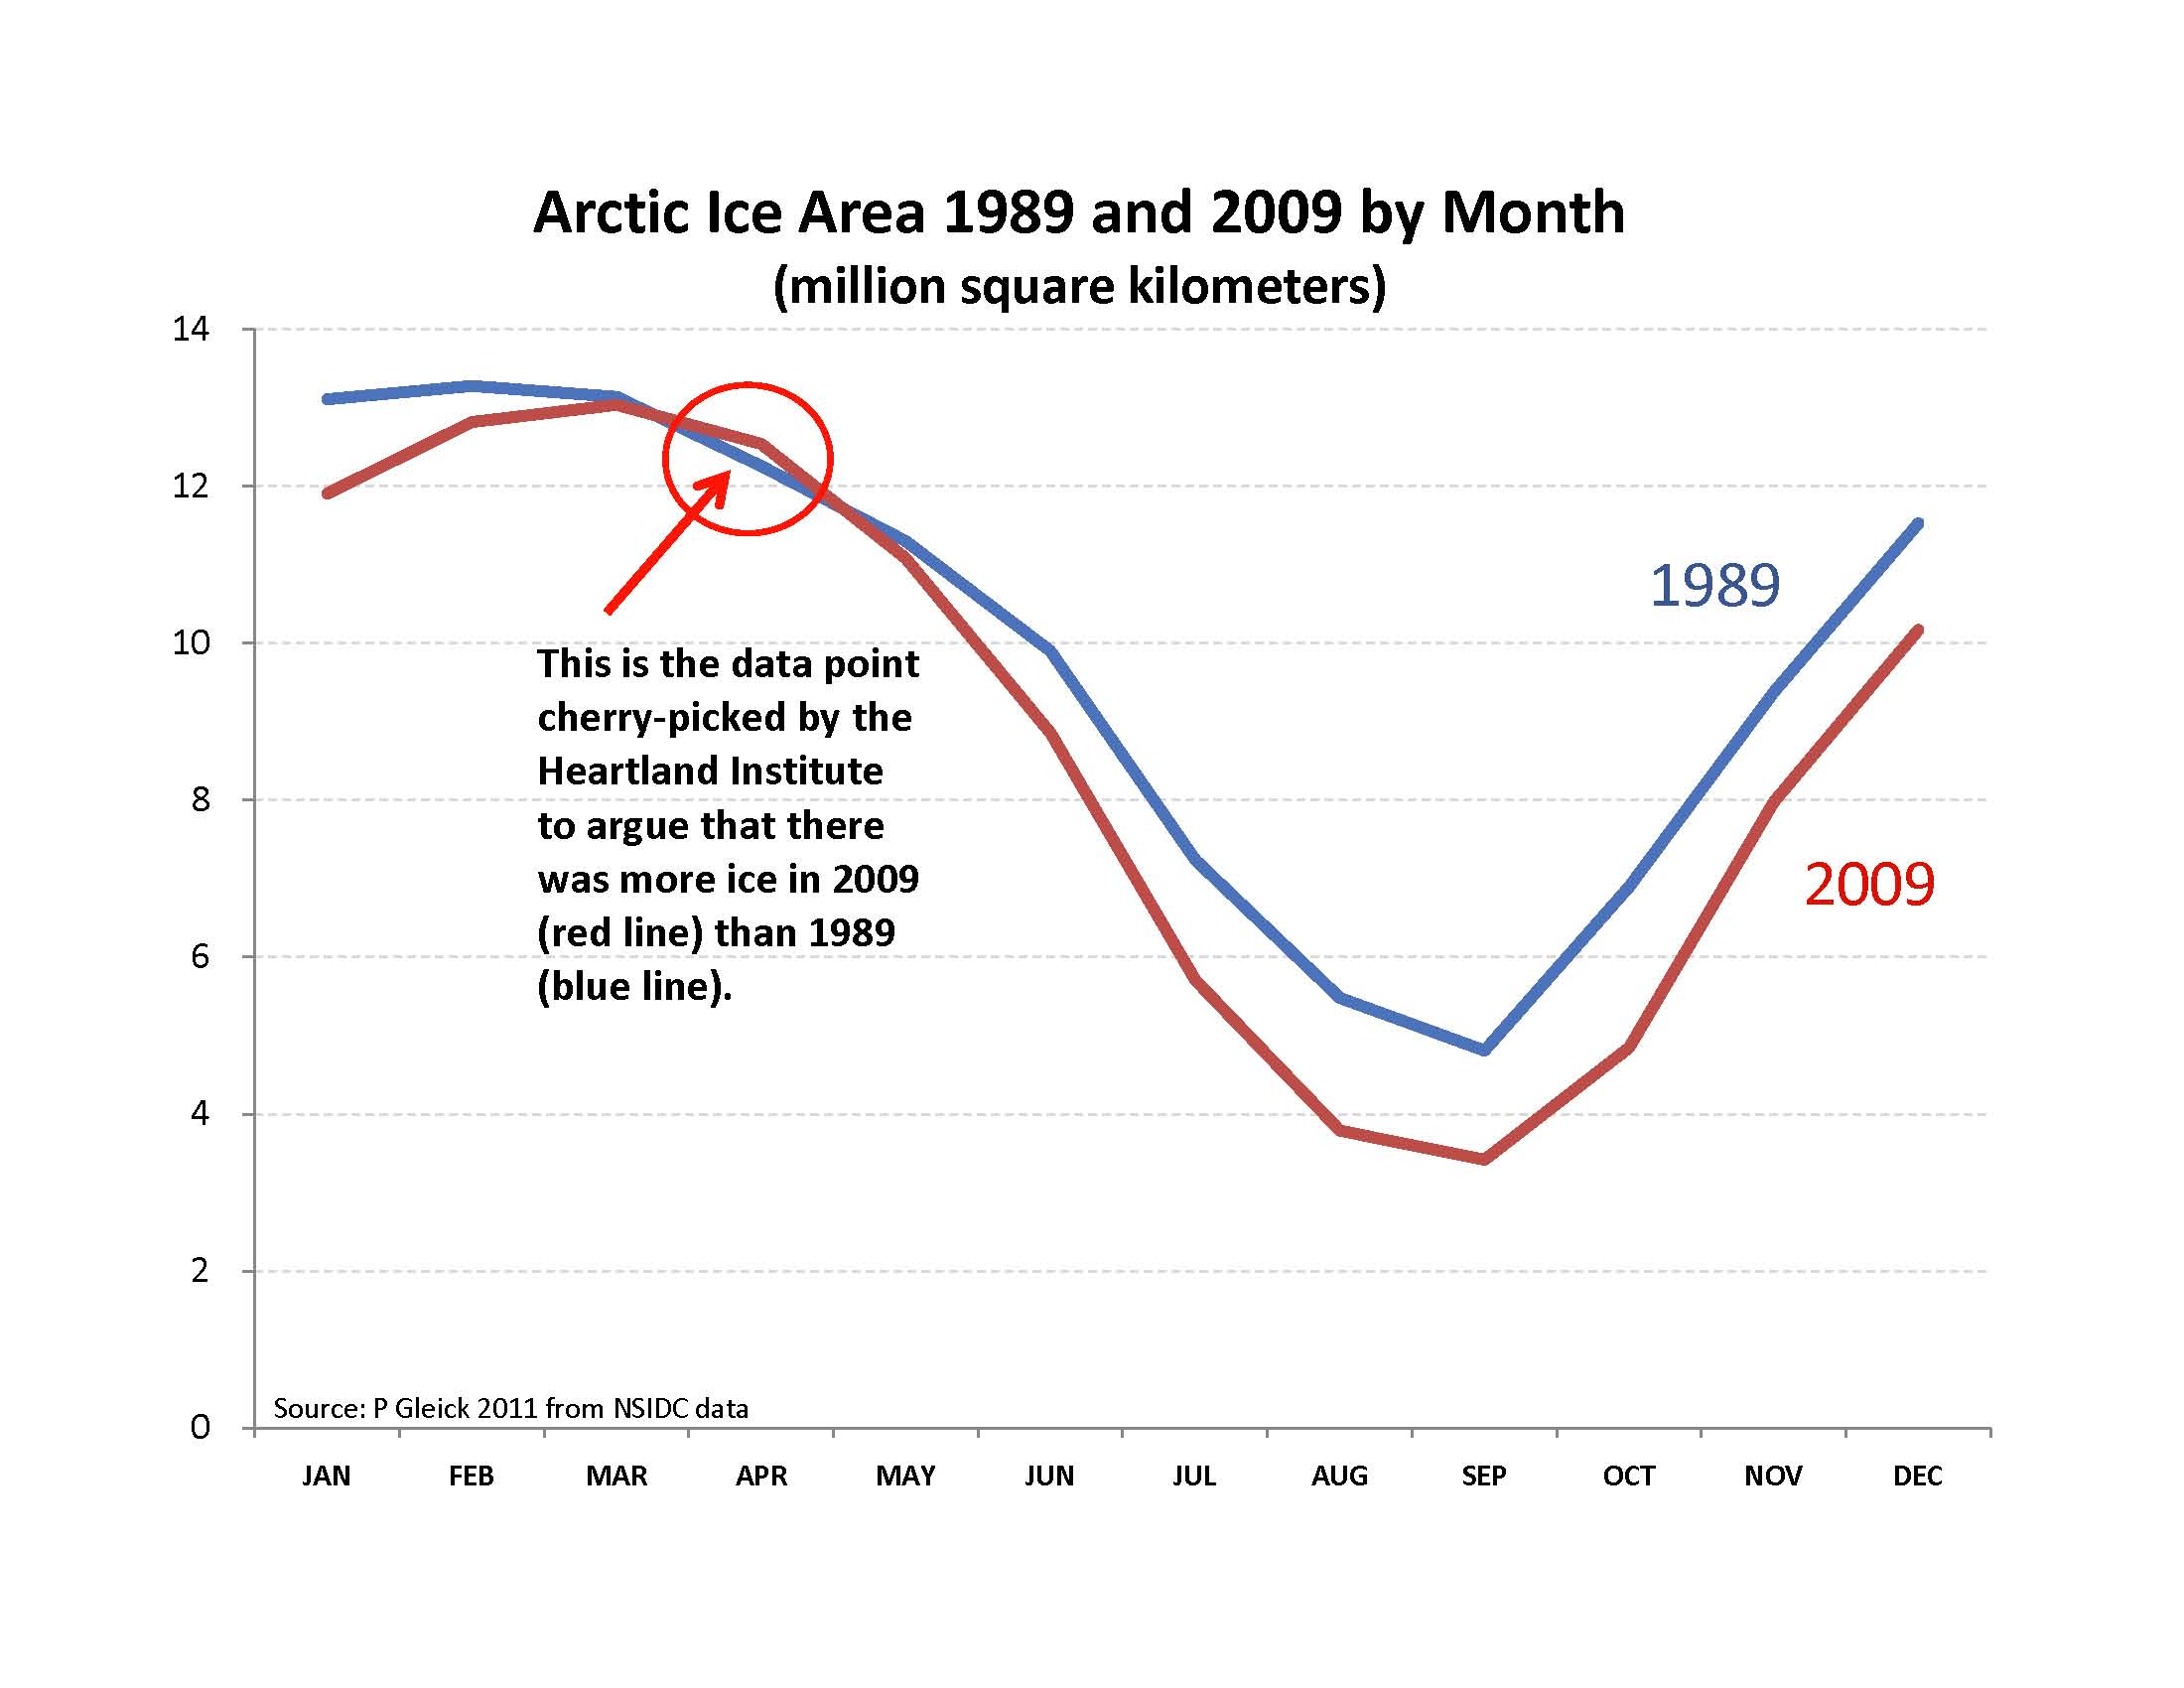
UPDATE: A must-read article on this subject is Peter Gleick's Misrepresenting Climate Science: Cherry-Picking Data to Hide the Disappearance of Arctic Ice including a graph that best illustrates the cherry-picking of the Heartland Institute (h/t to Sphaerica):

For more takes on this subject, see Scott Mandia, Phil Plait, Chris Mooney, Charlie Petit from Knight Science Journalism Tracker, Lou Grinzo, Richard Littlemore and a new Climate Crocks video by Peter Sinclair. If you want to get it from the horse's mouth, Walt Meier and Mark Serreze from the National Snow and Ice Data Center have submitted an opinion piece to the Santa Fe New Mexican, Arctic sea ice is not recovering.

Arguments


Schmitt is a geologist. What is it about some geologists that they get climate so completely wrong, to the point of making statements that are flatly contradicted by recent measurements?
= = = = = = = = = = = = =
Some of them do get quite foxed by CO2 levels in the early and mid Phanerozoic, they were notably higher. But then again that is more the solution to how we avoided freezing over with much lower solar energy.
As for this man, either he is making statements without having checked the underlying data, or he is consciously making an misleading presentation. I don't know what is worst. But I _really_ doubt he would say "temperatures have now returned to January levels" after a frosty night in April.
Or in other words, cherries are delicious.
How would he have felt if the underlying science were a "skeptic science" that came from just 3% of the publishing scientists? And, in particular, that these scientists were the rump contingent, a predictable group in every scientific field, that resists the new research.
And what would he have thought of the "heretic skeptics" campaigning for positions that the 3%'ers are unlikely to believe, and certainly couldn't profess in serious circles. And yet these "heretic skeptics" are the largest part of the movement. Did Harrison Schmitt ever think that he would become one?
PS See geologist Richard Alley's video lecture, "The Biggest Control Knob, Carbon Dioxide in Earth's Climate History"
http://www.agu.org/meetings/fm09/lectures/lecture_videos/A23A.shtml
http://climateprogress.org/2011/02/07/harrison-schmitt-climate-science-denier-arctic-sea-ice/
Science: Using all of the data to see the bigger picture.
The Yooper
The light blue oscillating "monthly ice extent" in Figure 2 is I think too light. I didn't even notice it when I first looked, and to me it's the most important part of the graph. It's the orchard, that makes it very clear from whence the cherries were picked. Interestingly, they're not even max extents, but obviously very arbitrarily chosen matches.
Could you darken that color? May make it royal (dark) blue, and instead make the currently royal blue yearly average black).
Misrepresenting Climate Science: Cherry-Picking Data to Hide the Disappearance of Arctic Ice
"Imagine a student in their graduate-level comprehensive exam trying to make a claim based on two data points that completely misrepresents the clear longterm trend."
You can actually imagine a mere layman, who does not even pretend to have the ability to read charts, finding intuitively something very wrong with that picture.
If we were to actually run into a layman using such a chart, it would be instructive to emphasize the visual emptiness of the chart. That should arouse suspicion in his mind.
Can anyone find a cherry to pick from this? The current year is more than 2 stddevs below the average and below 2006-2007, which was the worst year in the record.
I am wondering how, or if our usual skeptic contributors can possibly explain the thought process and motivations behind statements that are so glaringly wrong. What was Schmitt thinking?
Seriously? You think this is a low level?
google "Pole Shift Threatens To Cause Weather Chaos prison planet"
I think you guys are being unkind, though. There is every evidence that these folk really want to engage with science - the driving force of the modern era. Obviously they're not up to it, find it all a bit hard and confusing and, therefor, scary...
I strongly agree that talking in terms of standard deviation is meaningless, the null hyppthesis being that there's no trend. But we know that the trend is there and the null hypothesis should be that there's no change in the trend.
Seriously? You think they want to engage with science?
Google "Harrison Schmitt" to view his business, political and organisational connections.
I think you are being a little naive. There is every evidence that this guy is pushing an agenda and he doesn't care what data he dregs. Obviously you are just not up to his level of [self censored]
We have to accept that, as Phil Jones said, there's been no significant warming for the past 15 years. Also total polar ice isn't decreasing.
We have to be careful about the North West Passage being open - this isn't unusual - it's been open plenty of times in the past - before we had satellite measurement of polar ice.
We need to be realistic about the claims we make.
'As predicted' is loaded, projected changes in Arctic ice include a full range with associated uncertainty. The possibility of further area collapse was mooted, but was far from a mainline prediction as far as I can tell. Here's a paper from '07 where they help explain it. 2007 was far below model projections and since then we've stayed below model projections.
Phil Jones said no statistically significant warming at the 95% confidence level from 1995-2009. It is now (using '95-'10) statistically significant at that level. This is from the HadCRUT3 dataset which is only an atmosphere/surface measurement. If you look at ocean heat content, or latent heat invested in melting ice, or sea level (which integrates over those) then up to 2003 global warming was obvious in all of them. Since '03 we've seen significant rises in sea level and loss of ice, plus probably in abyssal warming, but perhaps not in 0-700m ocean heat content.
Total polar ice is not decreasing? The data say that it is. Sure, Monckton and some other skeptics say otherwise, but I tend to run with the data.
Antarctic sea ice is covered elsewhere on here. :)
That is really a multi-part statement. The claims are made: See the quote at the top of this post.
Greenland glaciers have been advancing since 2006, Artic [sic] sea ice has returned to 1989 levels of coverage, and snowy, cold winters and cool summers have dominated northern North America and Europe
The serious aspect is that these claims get repeated. People who don't bother to verify hear 'famous astronaut says' and their brains switch off. Then the amplification process begins: 'as everyone knows, the Artic has recovered'.
That the claims are so easily shown to be false shows how impoverished the denier arguments are.
Ironically, I posted the same graph at Deltoid yesterday.
It's important though to be very clear about distinguishing between 2006 and 2007, with respect to the winter maxima, and Stu N made this point for me when I myself skipped over it.
I was more concerned about the overall trend compared to 2007, and where it is heading, but if we're not careful it's quite possible that we could be accused of the sort of cherry-picking that Peter Gleick indulged in.
That's one mud-hole I don't want to be wallowing in!
Today's graphic, as posted by Stu, is cemented here.
My guess is that this year is a statistical tie with 2006-07. Still massively below the average - and that's the point.
"Seriously?"
... ummm, no...
Should be said, I'm English and consider that Irony is the highest form of wit. Don't worry, lots of 'denialists' don't understand irony either.
Fair enough.
But difficult to pick sometimes if you don't know the poster.
For example, my response could be read as irony also. ;)
Arctic sea ice has decreased a lot more than Antarctic sea ice. Global sea ice is clearly in the decline.
Picking 2007 to try to suggest that the ice decline has stopped is as misleading and wrong as suggesting that temperatures have been flat since 1998. Both claims are equally wrong, the data shows that very clearly.
In fact, the decline in summer Arctic sea ice shows an accelerating decline up to 2010. If you can not understand that this does not necessarily mean that every year will be lower than the previous one, you have some serious catching up to do with the basics.
The very significant decrease in Arctic sea ice in the Arctic summer opens up large areas of ocean to absorb sunlight.
The Northwest passage has never been reported to open as much and as long as in recent years. All Northwest passages crossings in more distant history took several years. There has never been in recorded history so many days when both the NW and NE passages were open at the same time as there was in the past few summers.
All this has been explored earlier on this site, proper research here or on Google will take you to all the sources and data you need.
Hence, I don't expect him to return, or to read the reasonable responses people have written if he does. Nonetheless, in case someone else was taken in ...
I'll expand on Phillippe's response a bit. The global sea ice plot at Cryosphere Today shows a clear downward trend. All studies of land ice on Greenland show significant mass loss (see elsewhere on this site) and recent studies of Antarctica are showing the same sort of decline (also referenced on this site). That's all the "polar ice" so, yes, total polar ice is decreasing.
As for the NW passage, there was exactly one single-year passage before recent years (when there have been many, some in very light craft that couldn't take any serious impact with ice). That historic passage was of course commanded by Henry Larsen in the St. Roch, which was a heavily reinforced schooner. The St. Roch was able to squeeze down leads in ice that would look solid had there been satellite images back then. So really, the passage wasn't "open" in the sense that we use the term - meaning clear blue water on the satellite images. Larsen was a brave man who got lucky. Considering his one other passage took 3 years, we can say he averaged 2y per passage. In 2010, some Norwegians did the EW passage and the NW passage in a couple of months, using an ultralight fiberglass trimaran. There's just no comparison.
Thanks for all you do on this blog! And I do mean all the contributors.
Tom