


 Arguments


The thermometer needle and the damage done
Posted on 6 November 2015 by Andy Skuce
Rising temperatures may inflict much more damage on already warm countries than conventional economic models predict. In the latter part of the twenty-first Century, global warming might even reduce or reverse any earlier economic progress made by poor nations. This would increase global wealth inequality over the century. (This is a repost from Critical Angle.)
 A recent paper published in Nature by Marshall Burke, Solomon M. Hsiang and Edward Miguel Global non-linear effect of temperature on economic production argues that increasing temperatures will cause much greater damage to economies than previously predicted. Furthermore, this effect will be distributed very unequally, with tropical countries getting hit very hard and some northern countries actually benefitting.
Let me attempt a highly simplified summary of what they did. I’m not an economist and this analysis is not straightforward, so beware. If I confuse you, try Dana Nuccitelli’s take or Seth Borenstein’s or Bloomberg’s or The Economist's.
Firstly, Burke et al. looked at factors like labour supply, labour performance and crop yields and how they relate to daily temperature exposure. Generally these show little variation up to temperatures in the high twenties Celsius, at which point they fall off quickly. Secondly, those trends were aggregated to predict the relationship between annual average temperatures and the annual impact on economic output. Thirdly, they looked at annual economic output and average annual temperatures for individual countries for the period 1960-2010. Note that they only compared the economic effects of temperature change on individual countries, they did not correlate one country with another. Using these observations they were able to see how the observations compared with their predicted aggregate curve.

All figures from Burke et al. (2015).
This work showed that the GDP of countries with an annual average temperature of 13°C were the least sensitive to temperature changes. Colder countries on the left side of the hump would benefit from an increase in temperature, whereas warmer countries would see their output suffer as temperature increases. Note that the figure does not show that a certain temperature predetermines the level of wealth of a country (China, despite recent rapid growth is poorer than the US and Japan even though average annual temperatures are similar). Rather, it illustrates how susceptible countries are to increases or decreases in productivity relative to their annual average temperature.
There is some evidence that rich countries are slightly less affected by changes in temperature (the curve is a little flatter for them). There are few hot and wealthy countries examined in the study, so any general conclusions about them cannot be certain, but the evidence still points to them being more prone to damage from rising temperature than rich, cooler countries. No matter how rich you are, extra heat hurts the warm lands more than it does the temperate and the cool. You can’t buy your way out of the effects of global warming, except by moving away from the Equator or up into the highlands.
Ceteris non paribus
Other things being equal, poorer countries are expected to grow faster than already rich ones over the course of this century, which will reduce inter-country economic inequality. However, according to Burke et al, because poor countries tend to have warmer climates than rich ones, global warming will slow the rate of economic growth among the already warm and may even provide a boost to the economy for cool countries and regions such as Canada, Russia and Northern Europe. If global warming continues into the latter half of the twenty-first century, many countries may see the gains made over the next few decades reverse themselves. By 2100, some countries may find themselves back to where they are today, despite decades of progress made in the meantime.
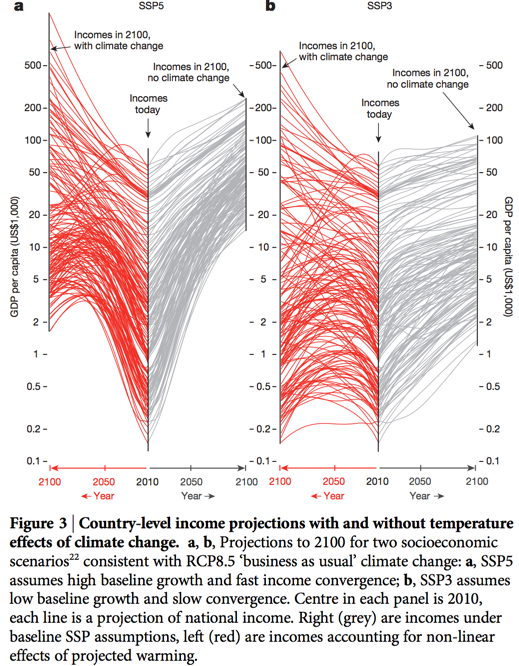
The two figures above show projections of wealth for the 166 countries studied under two economic scenarios: a high-growth, high-convergence one on the left and a low-growth, low-convergence one on the right. The grey lines show the baseline growth trajectories assuming no warming and the red lines the growth under the RCP8.5 worst-case greenhouse gas concentration pathway. Inequality is bigger at any given time when the vertical extent of the bundle of lines is bigger. (The vertical scale is a log scale.) If there is rapid growth, warm, poor countries will lose part of their hard-earned wealth as the climate warms—even so, they may end up ten times more wealthy than they are today. If there is only slow growth, many currently warm, poor countries may find themselves back where they started. Because some cool, rich countries become even wealthier under global warming than they would under a stable climate, global inequality between countries will greatly increase or, at best, stay at current high levels.
Ooh, ooh, the damage done

To see the effect expressed as a function of overall damage to the world economy, look at the black line in the figure on the left. It shows overall damage to world GDP of about 22%, far higher than the few percentage points of losses projected by conventional Integrated Assessment Models (IAMs). (Blue shading indicates the uncertainty band of the Burke et al. projection. The orange, blue and red solid lines show the various effects of assuming delayed impacts and different responses of rich and poor countries. The IAMs are shown by dashed lines.)
Burke et al. find that the cost of climate change is 2.5 to 100 times as high as previous estimates from the IAMs, with a central tendency of about 10 times the size. The damages in this study are much bigger at 2°C than the damages in IAMs are at 5°C.
As Joe Biden might say, this is a big [modifier redacted] deal. It is sure to be contentious. For example, an economist who advises the denialist Global Warming Policy Foundation has, not uncharacteristically, already complained that Burke et al. did not perform the statistical tests that he would have done.
However, the Burke et al. projections of damage are at least based on observations, whereas, according to economist Robert Pindyck:
The bottom line here is that the damage functions used in most IAMs are completely made up, with no theoretical or empirical foundation. That might not matter much if we are looking at temperature increases of 2 or 3°C, because there is a rough consensus (perhaps completely wrong) that damages will be small at those levels of warming. The problem is that these damage functions tell us nothing about what to expect if temperature increases are larger, e.g., 5°C or more.
It’s probably worth emphasizing that the damages in Burke et al. are calculated without any consideration of losses arising from ocean acidification, sea-level rise or increased extreme weather events, such as tropical cyclones. This is far from the full picture of climate-change damage.
The northern countries that do well out of this analysis should not feel complacent. No country is an economic or social island and the disruption among neighbouring countries and trading partners will certainly have adverse effects that haven’t been accounted for here. A future increase in inequality, dashed hopes of development, combined with pockets of extreme deprivation may make the current refugee crisis that is unfolding in Europe appear trivial by comparison.
Reference: Burke, M., Hsiang, S. M., & Miguel, E. (2015). Global non-linear effect of temperature on economic production. Nature.
Thermometer dial image from Russell Scientific
Help us do science! we’ve teamed up with researcher Paige Brown Jarreau to create a survey of Skeptical Science readers. By participating, you’ll be helping me improve SkS and contributing to SCIENCE on blog readership. You will also get FREE science art from Paige's Photography for participating, as well as a chance to win a t-shirt and other perks! It should only take 10-15 minutes to complete. You can find the survey here: http://bit.ly/mysciblogreaders. For completing the survey, readers will be entered into a drawing for a $50.00 Amazon gift card, as well as for other prizes (i.e. t-shirts).


Hi guys, wonder if you can help me out or know somebody who can?
When the earth was formed the amount of energy the sun was putting out was x, when we got too the carboniferous era when the coal beds etc were laid down, the suns energy had increased by about 30% to x and the carbon in the atmosphere was between 5000 to 7500 PPM with not even close to runaway and a fiery death for the earth.
Since then the suns energy has increased by another 10 % and we have 400 PPM roughly, since no matter what mankind does the earth sometime in the future will increase the PPM way beyond 400-500 PPM and heat the earth way beyond 2c again which we are now told is the last chance to halt disaster.
So at what PPM will the a earth now fry in the future, because obviously the textbooks say the earth will die in about 4-5 billion years as the sun changes as its energy is used up, so now that figure has to be wrong and has to be changed?
There are several points which might be useful to clarify. Firstly, I am not sure why you think that without mankind, Earth would increase CO2 beyond 500ppm? I mean I do agree, that in some very distant future the sun's increase in output will indeed heat oceans to point where CO2 increases but on say a 100M scale, CO2 content and temperature have trending down. There are long term processes removing CO2.
Second, I am not aware of any serious science predictions that "earth will fry" due to our CO2 emissions. The IPCC AR2 points out that rapid climate change creates many problems and certainly will increase localized disasters of various sorts (including security problems) in many places. I dont think anyone can claim with any certainty that it would "end civilization as we know it", but it would certainly impose a lot strains. Furthermore, best calculations suggest it would be cheaper to mitigate (stop emitting) than adapting (living with consequences).
I am not sure that burning all available fossil fuels will change the time at which the earth will indeed die as the sun gets hotter. For starters, even if we did burn everything and put CO2 up to around 1000ppm, natural processes will reduce CO2 levels again (over 50-100 million years) far faster than the sun is heating.
TheHod @1, the current solar insolation averages at 238 W/m^2 globally averaged and allowing for albedo. Assuming the same albedo, that means it was 70% of its current value, or 68 W/m^2 less 4.56 billion years ago. In the middle of the Carboniferious, ie, 0.33 billion years ago it was 97.2% of the current value, or 6.68 W/m^2 less than current values. That is equivalent to 1.8 doublings of CO2, or the equivalent decreasing the 5000-7500 ppm of CO2 (your figures) to 1430 - 2140 ppm.
One billion years from now, the insolation will be 109.6% of current levels, or 22.8 W/m^2 greater than current levels. That is the equivalent of doubling CO2 levels 6.2 times, or increasing CO2 levels to 20,400 ppm. Clearly so large in increase in solar insolation would not be survivable by our civilization assuming currently projectible technologies, so that absent large scale migration to Mars and the Asteroid belt, or actually shifting the orbit of Earth to that of Mars, we will be extinct by then along with all vertebrates on the Earth.
Given, however, that that is 200 times longer than the duration of Genus Homo, 4000 times the duration of the species Homo sapiens, and 83,000 times the duration of agriculture; it is pure fantasy to imagine that anything resembling Homo sapiens or a descendant of our civilization will be present on the Earth at that time. It is a time so distant as to be inconsequential to us, and therefore entirely off topic in relation to the OP.
"Furthermore, best calculations suggest it would be cheaper to mitigate (stop emitting) than adapting (living with consequences)."
but stopping emitting, means people would have to radically change their "non-negotiable" lifestyles, and curtail human breeding and we know that isnt going to happen. :(
This assesment of the relation between climate change and economies can quite easily lead to misjudgment on what will happen in the future because it only deals with some aspects of how civilization operates. The holistic scenario is that society is very dependent on the goods and services provided by a vast, irrevocable aging infrastructure operaated and maintained by using irreplaceable natural resources. Economic growth entails the usage of these natural resources at a high rate without taking into account the divestment of natural material wealth.
A rational consideration of how climate change (and ocean acidification) will affect what happens should take into account what will irrevocably happen to the infrastructure.
Yemen is about to be hit by its second cyclone in a week...after seeing not one cylcone in nearly 100 years.
Do you think maybe, just maybe, something's a bit...out of kilter??
www.aljazeera.com/news/2015/11/rare-cyclone-bears-beleaguered-yemen-megh-socotra-weather-151107221838657.html
earth.nullschool.net/#current/wind/surface/level/orthographic=-309.08,10.96,2584
Well, yes, denisaf and wili, the Burke study only looked at the effect of temperature, not resource depletion, nor extreme weather.
wili @6, the al jazeera article to which you link indicates that Socrota Island being struck by two cyclones in one season is unprecedented, not that its being struck by a cyclone at all is unprecedented. Indeed, the following map of cyclone tracks shows that while uncommon, cyclones are definitely not unprecedented in the region, with 10 occuring of the Yemeni/Somali coast between 1980 and 2005, and with at least one of those striking Socrota Island and one stricking the Arabian Peninsula almost precisely on the border between Yemen and Oman. Given that single cyclones are unusual, but not unprecedented, nothing significant follows from just one season with two cyclones in the region.
Tom,
I found your graph at Wikipedia. It was not labeled very well, but it appears to me that the blue dots are tropical storm strength and other colors indicate Cyclone (hurricane) status. None of the old curves crossing Yemen are hurricane strength anywhere near Yemen or Socrotra island. Bob Hensen (who writes most of Jeff masters blog now) states:
"Aside from Chapala, only two other tropical cyclones are known to have made landfall in Yemen in the last 125 years: a destructive tropical depression in 2008, which caused an estimated 200 deaths, and a tropical storm-strength cyclone in 1960. The impact of the 2008 cyclone was magnified by heavy rains that had fallen just days earlier from the remnants of another tropical cyclone. Likewise, if Megh did make landfall on a track like Chapala’s, the potential for flooding this time could be even worse."
I understand that in times past the rare tropical storms that formed in this part of the world did not usually reach hurricane strength. The water temperatures are record warm this year, and the record is very long. This area has had sailors for centuries, Hurricanes are known to be extremely rare. The occurance of a single hurricane strength landfalling (or nearby) storm in Yemen (or Socotra) is apparently unknown for at least 125 years. Two hurricane strength storms in a single year is unprecedented.
Michael Sweet @9 the colour key to the graph is found here. Further, a better graph can be found here. It extends from 1970-2005:
Looking closely, it shows 6 tropical cyclones transiting or glancing Socrota Island in that period, of which two where hurricane strength at some stage in their history.
Bob Hensen mentions a Tropical Storm and a Tropical Depression, neither of which was at hurricane strength. Based on the NOAA hurricane tracks database, the 1984 storm passed directly over Socrota Island before striking the Yemeni mainland. There are only two storms in the region in 1960, a Tropical Storm that dissipated about 100 Nautical Miles north of Socrata Island, and a Force 1 Cyclone that dissipated about 200 NM north of Socrata Island. He ignores the Cyclone Keila in 2011, which having struck the coast of Oman, doubled back around to strike the Yemeni mainland. More importantly, he ignores strength 1 cyclone that grazed Socrota Island in 1922, along with five other tropical storms or depressions to have passed over the island in the 125 year period, including storm 12A which appears to have dropped from strenth 1 to Tropical Storm status just before landfall on Socrota Island.
Using the NOAA data, I can calculate a rough estimate of the probability of two cyclones hitting Socrota Island in a year. In all, since 1844, at least 33 storms of at least strength 1 have formed within 600 NM of Socrota Island. Of those, at least 13 have occured in a year in which another strength 1 storm also formed. That is, given that a Hurricane strenght forms in a given year, there is a 34.4% chance that another will form in the same year. Of those storms, at least 3 have passed withing 50 NM of Socrota Island while still being at least strength 1, meaning that if a strength 1 storm forms in the region, it has a 9.1% passing close enough to Socrota Island to significantly effect it. Combining the values, we then have a 3% chance that if a strength 1 storm significantly impacts Socrota Island, another will do so in the same season. Further, there is at least a 15% chance of a strength 1 storm forming in the region in any year, leading to a 0.4% chance of that occuring in any year. That is, it is a 1 in 250 year event. That has not occured before 2015, but the probability of its occuring is not so low that we should be stunned that it has occurred, or immediately leap to the conclusion that because the event is rare it was caused by global warming.
Indeed, paradoxically, we should expect 1 in 250 year events every year. That is because the odds are for a limited location. Taken across all locations globally, the chance that no 1 in 250 year meteorological event occurs is vanishingly small.
Tom,
Dr. Jeff Masters, who is a hurricane specialist, says:
"Twin major hurricanes in the Arabian Sea: unprecedented in the historical record
Megh is the second major Category 3 or stronger tropical cyclone to affect Yemen this month. Just a week ago, Tropical Cyclone Chapala took advantage of the the warmest waters ever recorded in the Arabian Sea at this time of year to intensify into a top-end Category 4 storm with 155 mph winds (1-minute average). This made Chapala the second strongest tropical cyclone on record in the Arabian Sea, behind Category 5 Cylcone Gonu of 2007, the only Category 5 storm ever recorded in the Arabian Sea (Gonu peaked at 165 mph winds). Chapala went on to devastate Yemen's Socotra Island and mainland Yemen near the port city of Mukalla on November 3, killing at least eight people and causing widespread destructive flooding. According to NOAA's Historical Hurricanes tool, prior to this year, there had only been five major Category 3 or stronger tropical cyclones recorded in the Arabian Sea since accurate satellite records began in 1990, and an additional Category 3 storm that occurred in 1977. Thus, two major hurricanes in one month in the Arabian Sea is a remarkable occurrence." (emphasis in original).
While your calculation suggests a one in 250 chance of two category 1 hurricanes near Socotra in a single year, what is the chance of two category 3 hurricanes, which are much rarer? Therecord shows that two category three or higher hurricanes in a single year have never happened before. I note that the only observed category 5 hurricane occured less than 10 years ago and its formation was affected by AGW. Previous observations, while less accurate than satalites, go back over 125 years and show no additional major hurricanes.
I stand behind the claim that the hurricanes in Yemen are an unprecedented event.
michael sweet @11, it turns out that of the eight category 2 or stronger cyclones in the Arabian Sea, based on the NOAA database, prior to 2015:
1) All have occured north east of a line from the Maldives to Quatar;
2) The first to occur was in May of 1975, with 5 occuring after 1997;
3) Of the 6 category 3 plus, the first was in Nov, 1977, with 5 of the 6 occuring after 1997; and
4) The two category 4 plus cyclones occured in 2007 (Gonu) and 2010 (Phet).
On that basis I would agree that prima facie, the strengths of Chapala and Megh are a product of global warming.
I'm wondering if the economists that predicted that hotter poorer nations will have the most problem with global warming were taking account of the probable fact that richer less warm nations are more dependent on abundant fossil fuel energy for their survival? Thus say, if eventually there is a huge carbon tax and not very cheap renewables to replace it, might not rich nations take a bigger hit than poorer ones where perhaps people are more self-sufficient and produce more of their own goods because they can't afford not to?
No, these researchers did not look at the problem from that angle. I would expect that any proceeds from a carbon tax levied in any country and would be spent within that country, either by reducing other taxes or by increased government spending. So, there shouldn't be that big of a direct hit from a carbon tax. Nevertheless, even rich countries will endure some strains from carbon taxation, since there will be winners and losers, as well as adjustment pain.
But on the whole, the rich will be able to deal with carbon taxes better, even if they have to pay more, simply because they can afford more options to avoid them.
It's like a dog chasing its tail: only the most anti-intellectual of societys could still be stuck on this as if it were a problem...that's what the goggle-box 'll do to ya!!!