The Climate Show Episode 10: David Suzuki and the sun
Posted on 3 April 2011 by John Cook
The Climate Show have released Episode 10 featuring the long awaited interview with David Suzuki. Glenn decided to take it up a notch, recording the episode at high definition. Unfortunately things went a little pear shaped when his system was unable to handle the larger video file. So this week's podcast is audio only. However, you can still watch video of the David Suzuki interview.
The loss of video was a little unfortunate as my debunk was heavily dependent on graphics. So as you listen to the audio (subscribe to the podcast via iTunes or listen directly here), perhaps the best approach would be to follow along with the following graphics. We debunked the argument "global warming is caused by the sun", beginning with a prominent example from the documentary The Great Global Warming Swindle. The filmmakers use the following graph as evidence that the sun must be causing global warming:
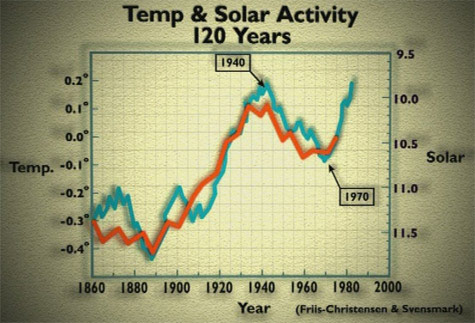
However, the sharp eyed reader should have already spotted the trick employed in this graph - two tricks, in fact. Firstly, they cut off the solar data in the mid-1970s, attempting to hide the decline in solar activity. Secondly, they cut off the temperature data in the early 1980s, in an attempt to hide the incline in global temperatures. When you use all the available data, the divergence between sun and temperature is clear:
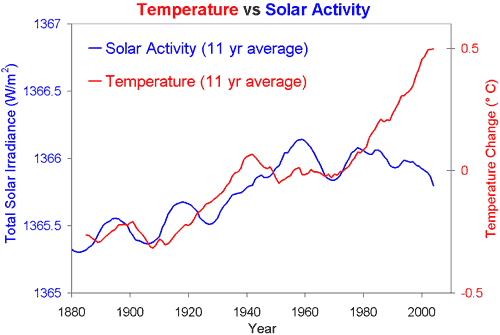
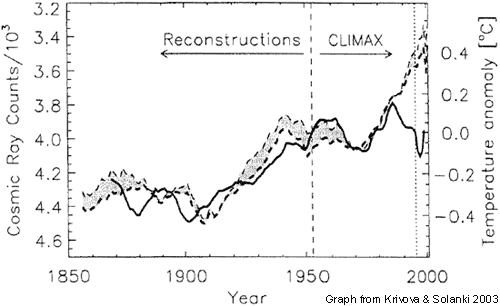
There are other ways solar activity can affect climate, such as cosmic rays. As with Total Solar Irradiance shown above, there is a good correlation between cosmic radiation and climate in the past but this correlation breaks down in recent decades:
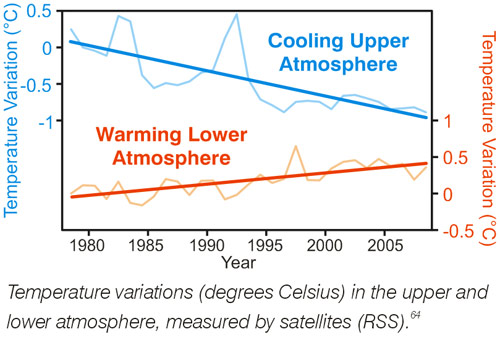
Next, we looked at several patterns you would expect to see if the sun was causing global warming. One distinctive pattern expected if the sun was driving global warming would be a warming stratosphere (the upper atmosphere). Greenhouse warming, on the other hand, predicts cooling in the upper atmosphere in contrast to solar warming:
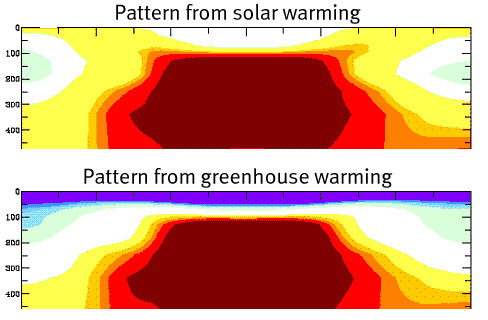
What we observe matches the expected pattern from greenhouse warming (I used the following graph from the Scientific Guide to Global Warming Skepticism):
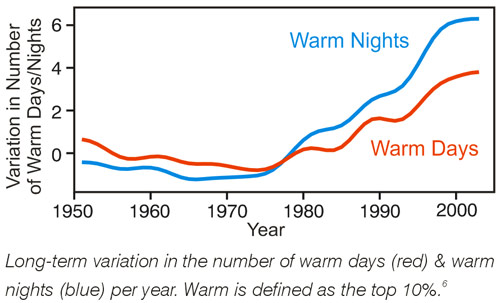
Another expectation from solar warming is that days should warm faster than nights, in contrast to greenhouse warming which should cause nights to warm faster than days. Observations of the daily cycle match greenhouse warming.
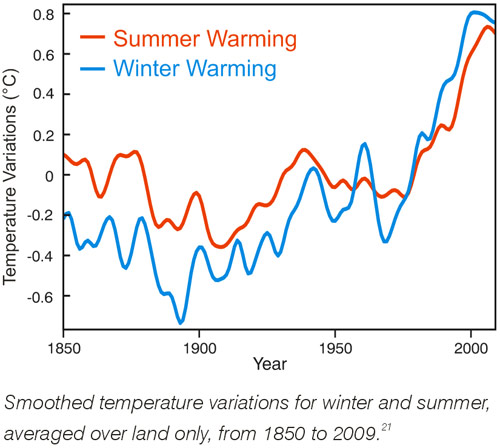
Similarly, solar warming should lead to summers warming faster than winters - greenhouse warming should give the opposite. Again, observations match greenhouse warming.
So multiple lines of evidence rule out the sun as the cause of global warming and point to an increased greenhouse effect as the primary driver of recent global warming.


 Arguments


 0
0  0
0


Comments