Climate Science Glossary

Term Lookup

Enter a term in the search box to find its definition.

Settings

Use the controls in the far right panel to increase or decrease the number of terms automatically displayed (or to completely turn that feature off).

Term Lookup

Settings


All IPCC definitions taken from Climate Change 2007: The Physical Science Basis. Working Group I Contribution to the Fourth Assessment Report of the Intergovernmental Panel on Climate Change, Annex I, Glossary, pp. 941-954. Cambridge University Press.

Home Arguments Software Resources Comments The Consensus Project Translations About Support

Bluesky Facebook LinkedIn Mastodon MeWe

Twitter YouTube RSS Posts RSS Comments Email Subscribe


Climate's changed before
It's the sun
It's not bad
There is no consensus
It's cooling
Models are unreliable
Temp record is unreliable
Animals and plants can adapt
It hasn't warmed since 1998
Antarctica is gaining ice
View All Arguments...


Username
Password
New? Register here
Forgot your password?

Latest Posts

Archives

Climate time lag

Posted on 8 July 2009 by John Cook

The previous post on CO2/Temperature correlation sparked some interesting comments on climate time lag. Unfortunately, the discussion went pear shaped with some ideological anti-intellectualism and things got a little bitchy after that. Nevertheless, climate time lag is an important subject that deserves more attention. Several metaphors were invoked in an effort to explain the phenomenon including stove hot plates and warming baths. However, I find the best way to understand climate time lag is a direct look at the science.

Our climate receives its energy from the sun. The amount of energy the planet absorbs from the sun is calculated from this equation:

Incoming Energy Flux= πR2S(1-A)

R is the radius of the earth, S (the solar constant) is the energy flux from the sun and A is the Earth's albedo - around 30% of sunlight is reflected back to space. The earth also radiates energy into space. The amount of energy emitted is a function of its temperature:

Outgoing Energy Flux = 4πR2εσT4

σ is Boltzmann's constant, T is the absolute temperature in degrees Kelvin and ε is the average emissivity of the earth. Emissivity is a measure of how efficiently the earth radiates energy, between 0 and 1. A blackbody has an emissivity of 1. Greenhouse gases lower the earth's emissivity. When the climate is in equilibrium, energy in equals the energy out.

S(1-A) = 4εσT4

What happens if the sun warms (solar constant S increases) then maintains a sustained peak? This is what occured in the early 20th century when solar levels rose then plateaued at a hotter state in the 1950's. The radiative forcing from the warming sun is not particularly large - between 0.17 W/m2 (Wang 2005) to 0.23 W/m2 (Krivova 2007) since the Maunder Minimum. Nevertheless, let's assume for the sake of argument that there is some amplifying effect (perhaps the cosmic ray effect on clouds) so that the warming sun has a substantial effect on global temperature.

When the sun warms, initially more solar energy is coming in than is radiating back out. The earth accumulates heat and it's temperature rises. As the earth warms, the amount of energy radiating back out to space increases. Eventually, the energy out matches the incoming solar energy and the planet is in equilibrium again. The time lag is how long it takes climate to return to equilibrium.

How long does the climate take to return to equilibrium? The lag is a function of climate sensitivity. The more sensitive climate is, the longer the lag. Hansen 2005 estimates the climate lag time is between 25 to 50 years.

How would climate have responded to the solar levels maxing out in the 50's? For the next few decades after the 50's, the radiative imbalance would've gradually decreased until the climate reached radiative equilibrium around the late 80's (give or take a decade). So how has our planet's radiative imbalance evolved over the latter 20th century?
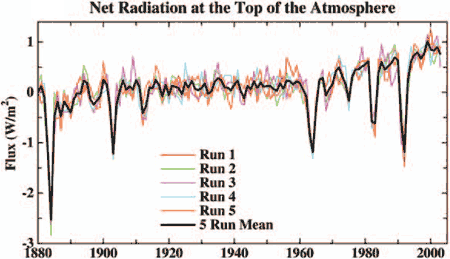

Figure 1: net radiation flux at the top of the atmosphere (Hansen 2005).

Hansen 2005 finds that the net radiative imbalance has steadily increased over the 20th century. There is no indication that the climate is heading towards equilibrium - quite the contrary. This is confirmed by satellite measurements of energy flux at the top of the atmosphere:
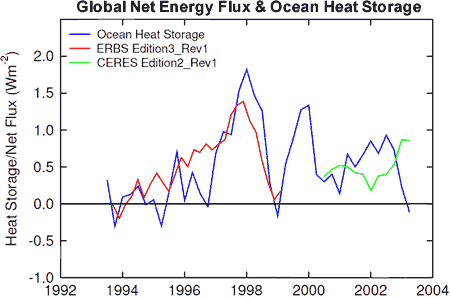

Figure 2: Global ocean heat storage (blue) against global net flux anomalies (Wong 2005).

The climate is not heading towards equilibrium. Rather, the radiative imbalance is increasing with the climate steadily receiving more energy than it is radiating back out into space. And this is where the true significance of climate time lag lies. Even if the radiative imbalance were to level off at its current rate of around 0.85W/m2, it would take several decades for the climate to return to radiative equilibrium. Based on this climate lag, Hansen 2005 calculates there is still 0.6°C warming still "in the pipeline".

0 0

Printable Version  |  Link to this page

Comments

1  2  3  4  5  6  7  8  Next

Comments 1 to 50 out of 388:

  1. Maybe you should take some lessons from the Real Climate website. They don't suffer fools over there. Cuts way down on the bitchiness.
    0 0
  2. I think it bears mentioning that an increase in sunlight will increase heating in the oceans as compared to an increase in the GH effect(which will primarily heat the atmosphere). Energy that is absorbed by the oceans will be emitted slower than energy absorbed by the atmosphere. It takes much longer to heat the ocean that it does the air(due to the mass difference). Given this alone, a straight increase in solar irradiance should have a longer lag time than an increase in the GH effect(even assuming the energy contribution is the same). Cheers, :)
    0 0
  3. One of the problems is that A, contrary to the ruling assumption, is not even nearly constant resulting in an increase in surface incident shortwave radiation of 6 W/m2 between 1984 (the beginning of cloud reconstructions) and 1998 and a decline of 2 to 4 W/m2 from 1998 to 2008. The decline in cloud cover between 1984 and 1998 seems to be equally high and low cloud - so the increase in shortwave forcing is not offsett by longwave cloud effects. The only reasonable conclusion seems to be that cloud changes contributed significantly to late century warming - and certainly of the oceans. All I can say in relation to the IPCC is - how do you like those bananas? No - naughty - I shouldn't gloat - I could conceivably be wrong. Although it is all adding up - sea surface temperatures, ocean heat content, global surface temperature, sea levels and cloud cover. Let me go back to the Usoskin result provided earlier. The link is between cosmogenic isotopes and global temperature reconstructions over 1150 years with the best correlation on a 10 year lag. The likely conection is between the Interplanetary Magnetic Field (IMF)/cosmic radiation/clouds. This is summarised in Jasper Kirkby "Cosmic Rays and Climate'. The IMF is reflected in the aa-index of Earth geomagnetic activity which peaked in 2003 on an annual basis - although 11 year averages peaked in the late 1980's. In discounting the link to surface temperature rise post 1975, both you and Ilya Usoskin use the wrong metrics - solar irradiance in your case and the sunspot number for Ilya. The 10 year lag between the IMF, clouds and, consequently, global total heat content seems to be working out pretty well. See Spencer and Braswell - http://www.drroyspencer.com/Spencer-and-Braswell-08.pdf for the implications for TOA radiative balance for varying cloud cover. Changing cloud cover falsifies the Hanson paper referred to above. Swhartz - http://www.ecd.bnl.gov/stevepubs/HeatCapacity.pdf - provides a discussion of surface temperature response to climate perturbation based on ocean heat capacity. An interesting discussion that finds a relaxation period of 5 years and low climate sensitivity to CO2.
    0 0
  4. I have been introduced to an update of the ISCCP reconstruction. The increased shortwave forcing between 1984 and 1998 is 3.4 W/m2 in the newer study.
    0 0
  5. Good to see such a quick response John, well done (but I didn't think I was being bitchy, so there!). But my physics isn't good enough to understand completely what is being said here, or by Hansen in the paper being summarised. Let me try some questions. 1. If there is a 20-50 year lag, why is there such an instant response to volcanic eruptions, which are equivalent to reducing solar input? 2. I had understood that the variations in solar input were too small to do more than explain some of the noise in the graphs, and "The radiative forcing from the warming sun is not particularly large" seems to conform this, so why is this an issue in the greater scheme of GHG effects? 3. The plateau business is confusing. The graph you show of net radiation is essentially plateaued from 1900 to 1970. Hansen has a graph of surface temp which shows a rise to 1940 and then a plateau to 1970 - is this the lag effect of solar increase in the early 20th century? I haven't seen that as an explanation before. 4. Granted some meaningful changes in solar radiation, are you saying this: when solar input increases, radiation out also increases, but it takes a while to warm up the whole planet so radiation out increases more slowly and the planet warms up slightly faster than it might otherwise have done until equlibrium is reached. When solar input decreases, radiation out continues at a higher rate because of the planet temperature, and therefore the fall in temperature, until equilibrium is reached is faster than it might otherwise have been. 5. Leaving those details aside, the increase in the temperature of the Earth from 1970 onwards has taken place in spite of falling or steady solar input, and therefore can only be the result of lower radiation outwards which in turn is the result of rising CO2 levels. That is, the solar input question, while of academic interest, has no relevance to the fact of global warming in recent times. And will continue to be of no relevance unless an increase in solar input makes our problems even worse.
    0 0
  6. "The 5-yr global mean CERES net flux from the standard CERES product is 6.5 W m-2, much larger than the best estimate of 0.85 W m-2 based on observed ocean heat content data and model simulations. The major sources of uncertainty in the CERES estimate are from instrument calibration (4.2 W m-2) and the assumed value for total solar irradiance (1 W m-2). After adjustment, the global mean CERES SW TOA flux is 99.5 W m-2, corresponding to an albedo of 0.293, and the global mean LW TOA flux is 239.6 W m-2. These values differ markedly from previously published adjusted global means based on the ERB Experiment in which the global mean SW TOA flux is 107 W m-2 and the LW TOA flux is 234 W m-2." Toward Optimal Closure of the Earth's Top-of-Atmosphere Radiation Budget....Loeb et al.
    0 0
  7. re #3 Robert ("Robbie" now?), we've already seen on the other thread that there's something rather dodgy about these data. I think we need to wait until the practitioners sort out their methodologies and analyses before we can take the cloud/albedo data seriously. It's a very difficult topic. Interplanetary Magnetic Field. I'd like you to refer us to a peer-reviewed paper that discusses a mechanism and a quantitative analysis of any IMF/CRF/cloud/climate relationship. It seems to me that with the seeming difficulties in relating the CRF-climate hypothesis to empirical observation, some dubious recourse to the IMF is now being made. Let's see some science please. The Schwartz paper. You've made the same mistake with Schwartz as with Goode and Palle. You haven't noticed that these authors have recvised their work in subsequent publications. Schwartz's original analysis was poor (an arbitrary and ridiculously small time constant deining the inertia in the ocean resonse to radiative forcing), and he published a correction in which he increased the time constant to 10 years (I think) and now comes up with with a climate sensitivity around 2 oC (of warming per doubling of atmospheric CO2): http://www.ecd.bnl.gov/steve/pubs/HeatCapCommentResponse.pdf His ocean inertial time constant is probably still to low (and in any case the ocean response very likely can't be modelled with a single time constant), and making it a bit longer would put his climate sensitivty smack back into the scientific "best estimate" of around 3 oC per doubling of [CO2].
    0 0
  8. re #5 David, I think I can answer your point #1. First of all we need to define what we mean by lag. This is the period during which the climate response to a change in forcing comes to equilibrium with the forcing. So if we double atmospheric CO2 and the climate responds with a 3 oC rise in temperature, the lag refers to the time for the full 3 oC of warming to be realised. This "evolution" to a new equilibrium occurs on many different time scales. The atmosphere will respond quite quickly...the oceans very slowly. In reponse to a large volcanic eruption there is a rapid onset and very short duration (18-24 months) "pulse" of considerably reduced radiative forcing. The atmosphere will cool quite quickly and this will be quite noticable in land/ocean surface temperature measures. The oceans will statrt to cool. However they will not have "got very far" in cooling before the atmospheric aerosols are washed out of the upper atmosphere and the radiative forcing has returned to the pre-eruption level. So basically in a volcanic eruption the effects of the forcing doesn't penetrate very deeply into the "climate system". Only the superficial levels with rapid response times (the atmosphere) are significantly affected. Although it gets a bit colder in the year or two following a large volcanic eruption, this degree of cooling is small compared to the cooling that would occur if the negative forcing was maintained for a long enough period (hundreds of years) for the ocean heat content to come to equilibrium with the reduced forcing...
    0 0
  9. re the 'radiation at the top of the atmosphere' graph, why do all the runs correlate very closely during the 'dip' periods, compared to the more typical periods?
    0 0
  10. #8 Chris - thank you, that makes sense. The more general point I was exploring is that, as is clear on the previous thread, denialists are interpreting "time lag" as meaning some period when change in input (ie from the sun) has no effect at all on global warming until some long time afterwards, 20 - 50 years, when it suddenly warms up. This is to "explain" why global temperatures keep rising, inconveniently, when sun activity is low and falling. That is, the rise now is a delayed reaction to sun activity half a century ago. In fact, as I was trying to tease out with my questions, the "lag" that Hansen (and John Cook) are talking about is just a delay in the full effect of input changes being felt. A change in sun activity does give an instant response, but equilibrium, between the new input and output parameters, is not reached for some time. However a tracking of temperature would still show it rising and falling (if this were the case) with sunspot activity or cosmic rays or whatever deus ex machina mechanism is the denialist talking point of the day. It doesn't, it rises, and rises, and rises, with GHG concentration, and time is running out. It is I suppose another example of where climatologists need to be very careful of the terminology they use. But it is impossible to guard against the cherry picking of words and sentences and gotcha moments that is the antithesis of science.
    0 0
  11. Not trying to hide - Rob or Robert is fine - my laptop was offline and I used a work email in registering and forgot my login details. My mates call me Robbo. The cloud reconstruction is, and I will quote Goode et el 2009, that using 'satellite cloud data and Earth reflectance models, we also show that the decadal scale changes in Earth's reflectance measured by earthshine are reliable, and caused by changes in the properties of clouds rather then any spurious signal, such as changes in the Sun-Earth-Moon geometry.’ It is not just one paper or source however – see Hatzianastassiou et al ‘Global distribution of Earth’s surface shortwave radiation budget’, the Global Energy Balance Archive, the International Satellite Cloud Climatology Project and the Baseline Surface Radiation Network. We saw an increase in surface incident shortwave radiation of 3 to 4 W/m2 between 1984 and 1998 and a decrease of 2-3 W/m2 between 1999 and 2008. These fluxes are climatologically significant. As I say, clouds have been treated as a climate feedback rather than a climate forcing and this is proving to be a questionable assumption. I have provided references. There is a link to a 42 page summary from CERN’s Jasper Kirkby. It appeared in Surveys in Geophysics 28, 335-375 (Nov 2007) – but is available on the CERN server. There are several references linked to on ScienceBits: http://www.sciencebits.com/CosmicRaysClimate Check out Figure 3 on the site – but of course never relying on a single source. Google Ilya Usoskin who has a dozen relevant studies on his website. Usoskin specialises in correlating cosmogenic isotopes with global temperature reconstructions over 1150 to many thousands of years. There is also a Hadley Centre Technical Note No 62 prepared for the 4AR. Both the Schwartz and Spencer and Braswell papers I referred to as interesting discussions. The Spencer and Braswell paper is more relevant to changing shortwave forcing. But this is about time lag. The Mizimi post adds another element to uncertainty in the TOA fluxes – CERES calibration – on top of cloud changes and early 20th century TSI changes – as well as other changes in Earth albedo – snow and ice, black carbon, land clearing etc. I have trouble accepting PDO data prior to WW2, let alone calculated TOA fluxes to 1880. The uncertainties are far greater than the changes being modelled. If we add to this the more recent ocean cooling. At a very minimum – a lack of heating since 2004. Does that imply a new climate equilibrium has been reached? Hardly, climate is not and never has been in equilibrium which is the fundamental flaw in all of the climate equilibrium models.
    0 0
  12. Another issue about time lags and solar changes: it isn't only solar irradiance that causes T on earth to warm, less low cloud cover is one example which would magnify a slight solar radiation increase. Your data seems to contradict that of Danish solar scientists (eg the book 'the Chilling Stars'), which state that total solar effects peaked in 1985, not the mid 20th centuy. In cold-temperate climates, a slight increase in solar irradiance most significantly reduces cloud cover, as the sun 'burns off' low clouds (just like early morning fog- but only when condensation points are already close to T already-ie in cold-temperate climes), however in tropical climes a slight increase in T/solar irradiance may increase overall cloud cover (the process is not linear). This effect would cause surface T in temperate climates (eg USA/Europe)to rise more than tropical climates, which is also what is observed. The troposphere mostly above ? the reduced low cloud cover shouldnt heat much?, which is also what is observed. Note also, that once low clouds pass their condensation point, they disappear very quickly (ie a tipping point), which would produce a sharp spike in T, and this is not a linear, smooth process-the same as on a cold morning fog, once it has gone. As for time lags, the cold-temperate oceans, with less cloud cover (following a slight rise in T), would heat slower than the land. Whether or not the clouds in tmerpate zones would take time (ie years-decades) to 'burn off' is another possible T lag. I also note that paintings in the 'litle ice age' are generally more cloudy than modern european climates. Danish solar scientists state that solar effects peaked in 1985, not the 1950s (including ?cosmic rays, ?clouds, ?solar magnetics), and with a heat time lag of ~10 years, would bring a peak in the mid-late 1990s, which is also what is observed. And what about solar magnetic field, and cosmic rays. Solar irradiance is not the only solar effect, and non-linear effects may account for recent warming trends. T has now flattened since ~2003, and the worlds governments are going to look pretty silly when T doesnt rise onver the next 10-20vyears, since solar activity has now waned, and c02 does hardly anything at all.
    0 0
  13. re #15 thingadonta The "chilling stars" Danish scientists certainly don't consider that there is a lag between solar effects and the cloud/climate response. There are three very significant problems with your argument. For example, have a look at the web article on the website of the Danish scientists here: www.spacecenter.dk/publications/scientific-report.../Scient_No._3.pdf If you look at Figure 1 and 2 (especially 2b) you'll see that the Danish scientists attempt to define correlations between solar parameters (they use the cosmix ray flux-CRF, but since all the solar parameters cycle in phase with the solar cycle, this could be solar irradiance or whatever). Are there "lags" in the solar/temperature response demonstrated by these authors? No. They attempt to show that the CRF matches the temperature response effectively with zero lag. The second problem relates to the solar-cloud link. This is normally made in relation to the hypothesis that variations in the cosmic ray flux (CRF) modulated by the solar variation, results in changes in low level clouds. The idea is that the cosmic rays nucleate cloud formation, such that a high CRF (bottom of solar cycle) leads to lots of clouds (and vice versa). Again, the cloud nucleation effect is essentially instantaneous [***]. No lag in cloud levels expected, and there should be a minimal lag in the onset of the temperature response , especially in the atmosphere. The third problem relates to cloud formation. Although the CRF proponents seem to be attempting to insinuate that tiny secular changes of a few percent have altered cloud levels (and this earth temperature) in a significant manner throughout the latter part of the 20th century, they leave unspoken a rather fatal flaw in their analysis. While the secular long term CRF variation since the onset of detailed measures (1958) has been negligible (see Figure 2 of the Svensmark-Friis-Christensen web report I urled above), the variation of the CRF within the solar cycle is very large indeed...it can be up to 25%. Therefore if changes in the CRF dramatically influence low level clouds in a climatically-meaningful manner there should be large and obvious cyclic changes in the cloud levels as the solar cycle waxes and wanes.... ...except that there aren't: http://isccp.giss.nasa.gov/climanal1.html ............................................. [***] Svensmark has recently published his data on cloud nucleation by gamma rays in a model system containing atmospheric pollutants (SO2 and ozone). He had to use very high aerosol concentrations (20-1500 times realistic true atmospheric levels) in order to detect nucleation with his particle detector. Nevertheless, the nucleation occured rapidly (max nucleation within 10 minutes of onset of iradiation). There we don't expect a lag between CRF changes and changes in nucleation events leading to putative cloud formation in the atmosphere, even if cloud formation itself may take some time (minutes/hours) to arise from nucleation. MB Enghoff, JOP Pedersen, T Bondo†, MS Johnson, S Paling and H Svensmark (2008) Evidence for the Role of Ions in Aerosol Nucleation J. Phys. Chem. B 112, 10305–10309 abstract: Aerosol nucleation has been studied experimentally in purified, atmospheric air, containing trace amounts of water vapor, ozone, and sulfur dioxide. The results are compared with model calculations. It is found that an increase in ionization by a factor of 10 increases the production rate of stable clusters by a factor of 3, probably due to ion-induced nucleation.
    0 0
  14. Nice reply, I need to do more research here, I only note that clouds are weird, and also point out that any small global changes in cloud cover would have VERY strong forcings-you can observe this on any cloudy/foggy morning. Note also that the sun 'burning' off low clouds (like burning off fog), even if only a small amount- is hardly mentioned by most reseachers (think Europe in the middle ages compared to today-look at the Dutch 17th Century paintings!). Cloud 'forcings' would be large, and could be strong enough to explain T changes in the 20th century- IF they respond to small changes in solar activity etc, but I note that heat T lags are not mentioned by the Danish scientists etc.
    0 0
  15. Chris, can you post the material pertaining to the "20-1500 times realistic true atmospheric levels" you mention above? The only link to the paper I have found is behind a pay wall. I find this interpretation odd, because it seems to contradict earlier work by the some of the same authors see here - http://adsabs.harvard.edu/abs/2006cosp...36.2889P where they claim that the levels of SO2 ozone and WV are atmospherically relevant. Further, just for people's information, here is a very good discussion on the state of play of the cosmic ray hypothesis IMO. http://www.sciencebits.com/SloanAndWolfendale "One last point. Although many in the climate community try to do their best to disregard the evidence, there is a large solar-climate link, whether on the 11-year solar cycle (e.g., global temperature variations of 0.1°C), or on longer time scales. Currently, the cosmic-ray climate link is the only known mechanism which can explain the large size of the link, not to mention that independent CRF variations were shown to have climatic effects as well. As James Whitcomb Riley supposedly once said: "If it walks like a duck and quacks like a duck, I would call it a duck"." Cheers, :)
    0 0
  16. The CRF-cloud relation is not at all so obvious as "skeptics" like to claim. Chris' point about the lack of cyclic variations in phase with solar cycle is a major hurdle in pursuing that hypothesis. Sawhnet, would you expect anything not in defense of his pet theory on Shaviv's personal blog? Any blog post including these words "many in the climate community try to do their best to disregard the evidence" is going to be met with great skepticism by me. I'm sure that, as a self proclaimed skeptic, you can understand.
    0 0
  17. A question for Chris, since I could not read through that paper: does "an increase in ionization by a factor of 10" correspond to what happens in nature?
    0 0
  18. Philippe, you may not care for the tone of the Shaviv's reply, but it seems to me that the long-term correlation btw CRF and climate has very strong evidentiary support, whether or not it can be separated from noise for the short term. There are many papers that demonstrate such a correlation - see here for example. http://geology.gsapubs.org/content/37/1/71.abstract BTW, I would not be so quick to accept chris's assertion that there is no link btw CRF and clouds. In the discussion on Shaviv's page, he states the following: "The next criticism Sloan and Wolfendale raise is the fact that when the cloud cover is correlated with the cosmic ray flux over the 11-year solar cycle, it appears that the cloud cover leads the cosmic ray flux variations by about 3 months (see panel 2 of fig. 1 above). If cosmic ray flux affect the cloud cover, such a lead should not be observed." (Shaviv then goes on to discuss his reasoning why this objection doesn't apply). Cheers, :)
    0 0
  19. I wonder why the cloud nucleation should be instantaneuos and why there should be therefore an immediate link to the 11 year solar cycle. Ionised aerosols are much smaller than cloud condensation nuclei. It must take some time to coalesce into larger particles and then to accumulate water vapour. There is an obvious 20 to 30 year cooling and warming pattern in global temperatures - as well as longer (1000 to 1500 year) cooling and warming. Unless we can distinguish clearly between natural variation and anthropogenic global warming - the attribution problem is not solved. The heliospheric/cosmic ray/ cloud connection is the leading contender for a source of the variation on these timescales. The basis of the concept relies is in analysis of beryllium and carbon isotopes form ice cores. The correlation over more than a thousand years is best with a 10 year lag. But this is only a correlation. The essential question is, because it is fundamental to assumptions about TOA fluxes (and therefore the time lag and cimate sensitivity), is whether clouds are changing in reality and from observation - and what are the implications. Clouds decreased from 1984 (when the reconstructions commence) to 1998 - with an increased shortwave forcing at the surface of 3 to 4 W/ms. Cloud cover has subsequently increased decreasing the shortwave forcing by 2 W/m2. Ocean heat content has, at a minimum, not increased since 2008. That is clear in: Sea level budget over 2003–2008: A reevaluation from GRACE space gravimetry,satellite altimetry and Argo A. Cazenave a,⁎, K. Dominh a, S. Guinehut b, E. Berthier a, W. Llovel a, G. Ramillien a, M. Ablain b, G. Larnicol b Also in the recent work by Willis referred to elsewhere and the 2009 Energy and Environment Article by Loethe. At the same time the monthly values of global surface temperature continue to decline. People are hoping that surface temperature will reach a new record if an El Nino forms in the boreal summer. The strength of El Nino is statistically correlated with the state of the Pacific Decadal Oscillation. While the PDO is cool - it is hugely unlikely that a strong El Nino will form. NASA is predicting record temperatures when El Nino returns. It is not even close this year and we will return to La Nina next year. Energy can be transferred betwen the ocean and atmosphere - especially in ENSO events. However the total energy of the ocean and atmosphere (barring volcanos) cannot decline with the forcings given by the IPCC. It seems likely that there is less energy in the climate system today than in 2005. This is a serious problem for AGW theory. - although I am anticipating that Chris will argue that there is more energy. It is hiding perhaps under a rock.
    0 0
  20. The Cazenave paper states that the sea level increase of the past 5 years is due to increase of the oceans' mass due to shrinking land ice, both from polar ice caps and mountain glaciers. It seems that perhaps that could prevent too much warming from comparatively modest forcings. There has to be a reason for all that ice to melt. It also seems to undermine your assertion about the "total energy in the system." We're missing big chunks of ice that have now become water. What is exactly the 1000 to 1500 years cycle that you refer to?
    0 0
  21. There is a 1500 (1470) year natural solar cycle, which is a superimposed 87 year and 210 year solar cycle overlap. It has been traced 600 times over the last 1 million years in ice cores, is very consistent, and we are currently about halfway through the latest solar warming trend, which started in about 1750; T will rise another 0.5-1 degree C over the next few hundred years, from the sun, as it has already risen about 0.8-1 degree C since 1750, also because of the sun. C02 is irrelevant to this trend. Current T is entirely in line with this well-defined 1500 year solar trend. Reference: "Unstoppable global warming every 1500 years" by F.Singer and D.Avery. They also trace numerous studies which confirm the trend, eg the medieval warm period, the little ice age etc etc.
    0 0
  22. Re: Lee Grable at 04:44 AM on 9 July 2009 Maybe you should take some lessons from the Real Climate website. They don't suffer fools over there. Cuts way down on the bitchiness. Real Climate is the worst possible propaganda site on the entire web. That's Hansen and buddies. Can't expect a skeptic view not to be derision there. Just asking a simple question results with a sarcastic answer, never a true answer. You can't trust any alarmist. It's like a scientific reason for a 6,000 year old Earth.
    0 0
  23. Philippe Possible the AMO. I'm not sure. I have not read Cazenave's paper but it sounds about right.
    0 0
  24. Not really.Wouldn't explain how mountain glaciers are melting everywhere. From what I remember, the Avery-Singer piece refers to Dansgaard-Oeschger events. There is an abundant litterature on the subject. These events appear to be mainly Northern hemisphere occurrences and only in Grenland did they produce large warmings. Most analyses use Greenland ice cores. They are found throughout the latest glaciation until about 23000 yrs ago, where they no longer appear in the paleo record. Furthermore, some research also shows that, while the Northern Hemisphere warmed in DO events, the Southern hemisphere cooled. THe best explanations advanced so far postulates changes in ocean currents leading to changed heat distribution.
    0 0
  25. Thingadonta, if the cycle is 1500 yrs and it last started in 1750, how can we be halfway through? Seems half way would be in 2500.
    0 0
  26. There is an 11,000 year sunspot reconstruction on Wikapedia. It is of course based on the so called cosmogenic isotopes is ice cores. These are isotopes of carbon and beryllium that are formed when affected by ionising cosmic radiation. The amount of cosmic radiation hitting atmosphere is modulated by the heliosphere which is in turn associated with sunspot count. http://en.wikipedia.org/wiki/Solar_cycle I wouldn't get too caught up with looking for precise cycles - just note that it goes up and down. The heliosphere changes as a result of internal cycles in the Sun such as the 11 year cycle, the 22 year solar polar magnetic reversal cycle and with the orbits of particularly the large outer planets. The time periods associated with these cycles are averages – the heliosphere doesn’t change on cue or even smoothly. A reconstruction of heliospheric magnetic intensity – based on carbon 14 in ice cores – is found here. http://en.wikipedia.org/wiki/File:Carbon14_with_activity_labels.svg Note the ‘Modern Maximum’ which went off the chart last century. Might it be related to the syzygy of March 10 1982? At any rate, the magnetic intensity of the heliosphere is declining rapidly – a decline that will continue sporadically over the next few centuries. It is typical that the error bounds from this kind of research are greater the further back in time you go. The last thousand odd years have been correlated with temperature reconstructions. The 1000 year temperature reconstructions from tree rings and oxygen 18 are of course bounded by large potential errors. But both the temperature reconstructions and the very fallible and partial historic records suggest a high point in global temperature around 1000 AD – called the ‘Medieval Optimum’ – and a low point in the 1700’s called the ‘Little Ice Age’. The correlation is between cosmic radiation and global temperature. Conceivably there could be a link between the heliosphere and solar irradiance. However, it seems that solar irradiance does not vary significantly. This has led some to posit a more subtle connection of the heliosphere to climate through ionisation of aerosols and subsequent formation of cloud condensation nuclei. CERN is currently undertaking a program of experimental investigation of this physical process. A review of the correlations, the hypothesis and the experimental design is provided at: http://arxiv.org/abs/0804.1938 The movie version is available here: http://cdsweb.cern.ch/record/1181073/ Sunspots have been counted since soon after the invention of the telescope by Hans Lippershey in Holland in 1608. The low point is at 1650 to 1700 AD which is associated with very low temperatures in Europe and with low temperatures in the millennial temperature reconstruction. http://www.cru.uea.ac.uk/cru/info/milltemp/ Global temperature rose 1000 years ago, dipped to the 1700’s and has risen since very much in line with the cosmogenic isotope count. Note also the shorter term variation in temeperature. The instrumental record of global surface temperature again shows shorter cycles – noting again that the reliability of the data diminishes with time. Increasing to 1880, declining to 1910, increasing to 1945, declining to 1975, increasing to 1998 and declining to June 2008. There are other 20 to 30 year cycles. The Pacific Decadal Oscillation – a cool mode form the mid 1940’s to the mid 1970’s and a warm mode from 1976 to 1998. The PDO was initially defined in terms of a relationship between sea surface temperature in the north eastern Pacific and fisheries productivity. In a cool mode, cold and nutrient rich water upwells strongly boosting productivity. In a warm mode, the upwelling is suppressed. Biology suggests that the current cool mode commenced in after 1999. http://jisao.washington.edu/pdo/ ENSO also has 20 to 30 cycles. These can be seen clearly in the multi-variate ENSO index of Claus Wolter. http://jisao.washington.edu/pdo/ There was a notable shift in climate in 1976/77 known as the ‘Great Pacific Climate Shift’. It is no accident that the periods of warming and cooling of the Pacific sea surface and global near surface atmospheric temperature are the same. Is there a link between these phenomenon and neutron counts on a solar cycle? I don’t know and I don’t care. Clouds, oceans and atmosphere are physical systems with a lot of momentum when they get going. They are not switched on and off like a light globe. What does the cloud evidence say? From the beginning of reconstructions in 1984, Earth albedo decreased by 1% (3.4 Wm2) to 1998. In 1999/2000 Earth albedo increased by 0.6% (2 Wm2) and has essentially stayed there. http://www.bbso.njit.edu/Research/EarthShine/ It suggests a physical explanation for surface and ocean warming and cooling. Actual changes in shortwave forcing as a result of changes in cloud cover. I am more interested in how it might work as a cause of the PDO and decadal ENSO modulation. There is a layer of warm surface water overlaying colder subsurface water. Subsurface currents are driven by cold water sinking at high latitudes and by the rotation of the planet. Upwelling of cold and nutrient rich water occurs as a result of physical characteristics in a few spots – especially the north eastern Pacific and in the Humboldt Current off South America. A little surface cooling and cold water upwells strongly in the north eastern Pacific. A little surface warming and the upwelling is suppressed. The central Pacific undergoes the same heating and warming over which is superimposed the 2 to 7 year ENSO cycle. This is a theory that probably requires 20 more years of cloud data. Regardless of the cause, the PDO, the decadal modulation of ENSO and suppressed global near surface atmospheric temperatures are with us to about 2024. El Niño are weaker in cool PDO periods. The next El Niño will not be a 1998 event – and global surface temperatures will continue to fall. In the longer term, the evidence for a cosmic ray/ climate link is strong. This suggests a cooling influence over the next couple of centuries – regardless of the mechanism.
    0 0
  27. Is heat hiding in the molecule? ‘First, from 2004 to the present, steric contributions to sea level rise appear to have been negligible…Although the historical record suggests that multiyear periods of little warming (or even cooling) are not unusual, the present analysis confirms this result with unprecedented accuracy.’ ‘The rate of ocean mass increase based on GRACE during the study period is similar to previous estimates based on observed melting of land bound ice, which tend to be around 1 mm/yr [Shepherd and Wingham, 2007; Kaser et al., 2006; Rignot and Kanagaratnam, 2006; Velicogna, 2006; Chen et al., 2006]. However, most of the 3.5 mm increase seems to have occurred in a 6-month period between late 2004 and early 2005. On the other hand, the inferred estimate (Jason – Argo) implies a much greater rate of ocean mass increase and significant uncertainties in the trend over the GRACE record remain. Until these issues are resolved, the long-term rate of ocean mass increase remains uncertain.’ http://ecco.jpl.nasa.gov/~jwillis/willis_sl_budget_final.pdf Let’s neglect the unlikely 6 month rise and assume a mass sea level rise of 5mm over 2004 to 2008. Using the area of the ocean and the enthalpy of fusion for water (use Wikipedia) gives a total enthalpy of 5.6 x 10 to the power of 20 J – about 1/250th of the total ocean heat content. This of course is heat converted to internal kinetic energy – i.e. hiding in the molecule. Even if we increase the non steric sea level rise by an order of magnitude - there is still a substantial energy deficit. This is heat that has to come from somewhere. The additional heat from IPCC net forcing is about 4 x 10 to the power of 22 J over the last 5 years – check my calcs (please check my calcs). We should have had either atmospheric or ocean temperature or both increase – but we have had neither. This effectively falsifies AGW theory.
    0 0
  28. re24" "the Avery-Singer piece refers to Dansgaard-Oeschger events. There is an abundant litterature on the subject. These events appear to be mainly Northern hemisphere occurrences and only in Grenland did they produce large warmings" No. There is abundant literature, ignored by the IPCC, that nz, china, siberia,central america and other places warmed in line with Europe in the medieval warm period. To say it was confined to europe/greenland is not correct; IPCC selects eg another example of tree rings in TASSIE AND then compares them to urban heat islands in recent tassie, more of the same hockey stick rubbish, completely ignoring data from NZ and other places. IPCC should be called the international panel of cherry pickers. IPCP. Its detailed in the singer and avery book, and peer reviewd articles are listed. It was no confined to northern hemisphere and greenland etc. The 1500 year cycle is not even with time across its warming/cooling trends.
    0 0
  29. re28 G'day Thingadonta The 1500 year Dansgaard-Oeschger Events become Bond Events in the holocene. There are 10 references listed on Wikapedia and a reasonable summary. http://en.wikipedia.org/wiki/Bond_event There is a 2008 non tree ring reconstruction here: http://www.ncasi.org/publications/Detail.aspx?id=3025 which discusses the geographical problem and which, incidentally, shows the warm period as warmer than 1998. Is the IPCC still arguing that this was a Northern Hemisphere phenomenon and therefore it doesn’t matter. What would they imagine the ‘physical mechanism’ is behind that? And as for only Greenland warming. lol Cheers Robbo
    0 0
  30. re 29: Yeah, a 500 year long, one hemisphere phenomenon. Haven't the IPCC ever heard of sampling density bias? If they are fewer studies in the southern hemisphere, this donest mean it didnt occur there. This is a typical socialist type misinterpretation-ie sampling density/occurrence correlates with fact/importance. I have seen this sort of bias in socio-economic analyses conducted by the public service, which attributes vocation significance/indices to actual number employed in an industry, rather than wages and other factors etc. So doctors, at less than 1% by number in a region, can be done away with....not to mention commuters, investors, etc etc-but I digress.... The chinese have kept good records, and have a strong medieval warm period, as do the Japanese. NZ was settled during this time around AD1000, just like Greenland (which may or may not be correlated, its just interesting), and glacial advances/retreats have actually been dated in NZ and are in line with european glacier advances/retreats. Mayans and Aztecs empires were disrupted by severe droughts. Easter island agriculture declined as T got colder from the time of settlement around ?AD800 (although other factors were also probably at work there). Anyway, the medieval warm period in the southern hemipshere has been detailed by much better methods than the above speculations, and keeps showing up in the data: it isnt a greenland phenomenon. I wonder if anyone has done a study of migrating agriculute in NZ's south and north islands since polynesian settlement around ?AD1000, this could show a trend if the south island for example got colder and farmign was abandoned, progressively moving north after the medieval warm period? I did read somewhere that the polynesians were attempting to grow tropical-type crops in places, but it got too cold for them, maybe they were moving progressively north as the islands went into the little ice age?? But I will have to find the reference. Also of interest, in the book "the Chilling Stars" by Danish solar scientists, a recently melted snow/ice pass in the European Alps in 2003 revealed various items left from both the roman and medieval warm periods-including shoes, clothes and the like-showing the pass was open and travelled in both previous warmings. These items were only exposed in 2003. A roman ruin is also located there, the locals finally found out what this old ruin was for, all the way up in those mountains-it was an ancient roman mountain pass lodging-only very recently reusable for travellers. So much for a greenland-only medieval warm period...
    0 0
  31. #27: "Let’s neglect the unlikely 6 month rise... We should have had either atmospheric or ocean temperature or both increase – but we have had neither. This effectively falsifies AGW theory." Well I'm convinced. Science is easy.
    0 0
  32. You can not attribute everything to a cycle,especially since neither DO events, Heinrich events or Bond events have been shown to be truly cyclic in nature. The periodicity of Bond events is estimated by Bond himself with a very large uncertainty. Your sampling bias complaint is unfounded. The data are there, they simply do not show synchronous hemispheric warming with D-O events. The Bipolar Seesaw shows up during the periods considered: http://www.scenta.co.uk/environment/news/cit/1271676/bipolar-seesaw-connects-the-poles.htm Excerpt: "the Antarctic starts to cool every time more warm water starts to flow into the North Atlantic during warm events in the north." NOAA has a nice discussion: http://www.ncdc.noaa.gov/paleo/abrupt/data3.html This article is interesting too: http://www3.interscience.wiley.com/journal/82002936/abstract?CRETRY=1&SRETRY=0 Robbo's link to the Wikipedia article on Bond's events: "the only Holocene Bond event that has a clear temperature signal in the Greenland ice cores is the 8.2 kyr event." The main difference between Bond and DO events is that Bond events are of much smaller nagnitude. Although the oceanic circulation pattern suspected in DO events appears to be conserved, it does not seem to be significant climatically in most cases. The Loehle E&E thing that you link makes no mention of Bond events. Except for not being dendro, what are the data used by Loehle? Your link does not say what the proxies are, where they were gathered, by whom, there is no data publication referenced, just Loehle's own compiled file in excel, which does not really help.
    0 0
  33. "In the late 1980s and early 1990s, rapid and large climate changes had been identified in Full Glacial sediments from the North Atlantic (Figure 9; Heinrich 1988; Bond et al. 1992). The Greenland ice core also showed evidence of similar variability (Dansgaard et al. 1993). These results convinced many people of the importance of abrupt climate changes (Weart 2003); that is,the climate may change as a step function. Efforts were made to relate these results to climate “episodes” that had been known for many years, such as the Younger Dryas Period (e.g. Wright 1989; Broecker et al. 1988). However, much of this work was done in the North Atlantic region,where large outbreaks of icebergs and pack ice could amplify the actual climate changes. Subsequently, climate variability of this timescale was also identified in postglacial sediments from some ocean cores in the North Atlantic, and it was suggested that Holocene climates varied significantly at a periodicity of roughly 1500 years during both interglacial and glacial times, as well as during the transition between them (Figure 9; Bond et al., 1997, 2001). This has important consequences for the identification of possible causes. The spatial distribution of the changes must be known, and this has occupied many people for the last decade. We therefore suggest that the dominant millennial-scale climate frequency in the Holocene is not 1500 years, but rather circa 1,000 ± 100 years. This circa 1,000 ±100-year periodicity actually matches better with the record of 14C variations in the atmosphere and 10Be. Cross-spectral analysis of the North Atlantic IRD marine record and cosmogenic nuclide records (14C and 10Be; proxies for solar variability and ocean ventilation changes) shows power at 300-500 and 900 to 1100-year frequency bands during the past 12,000 years (Bond et al., 2001). Hughen et al. (2000) suggest that climate variations such as the Younger Dryas are synchronous with atmospheric 14C changes, interpreted by the authors as ocean circulation changes. This suggests that these climate transitions are associated with major changes in the carbon cycle (Kutzbach notes Figure 19; Stuiver et al. 1995). Therefore it is possible that a weak periodic solar and/or ocean forcing in frequency bands of 300-500 and 900- 1100 years may be the dominant forcing during the Holocene when ice-sheets are less significant components of the climate system. The dominant ca 1500-year periodic signal during glacial regimes could have an internal origin and could explain why this periodicity does not show up in the 14C nor the GISP2 18O record of the past 12000 years (Stuiver et al.1995; Schulz and Paul 2002). Although a ca 1500-year periodic signal has been observed in some marine and terrestrial records (Bianchi and McCave 1999, Hu et al. 2003), we have argued above that individual records may simply be lacking some particular warming or cooling event." "Millennial-scale climate variations in the Holocene " by K Gajewski explores the apparent periodicity of climate changes ..the 1500year cycle referred to above. Climate Variabilityand Change Past, Present and Future Sorry about the address!! It gives some interesting views on 'step' changes in climate during the holocene period.
    0 0
    Moderator Response: [Sph] Hotlinked to fix page.
  34. I don't know where to start. Except to say that the medieval warm period was real as was the little ice age. All of the temperature renconstructions show this. The Loehle paper is downloadable at the site linked to. The data sources are described in the paper. Steric sea levels have not increased since 2004 - no thermal expansion therefore no increase in ocean heat content. No increase in atmospheric temperature - currently at the 1979 to 1998 average. http://www.drroyspencer.com/latest-global-temperatures/
    0 0
  35. I was going to finish that but posted instead. I was looking for the hiding place for that damn heat and someone suggested it wss in melting ice. Yhe estimates of mass sea level increase are not precise - but 1 mm/year from the land/ice contribution seems reasonable - see the discussion in the Willis et al link provided. So the mass rise approximately equals the volume of melted ice as an order of magnitude calculation. There is not nearly enough melting to hide the heat. Most of the heat storage is in the oceans - 95% appromimately. Stop quibbling and put it all together. No one denies that carbon dioxide is a greenhouse gas. But now we have a situation where the planet is not warming because of natural variability - we need to appreciate the modes of natural variation before we can understand human impacts.
    0 0
  36. Despite so many words spent on GCR here, there are still so many unclear things about the theory, so many unexplained climate facts, that while it's certainly worth being studied by scientists it's quite a long way from being complete. In other words, it didn't even begin to put it all together.
    0 0
  37. Well how about a March 2009 report suppressed by the US EPA? http://cei.org/cei_files/fm/active/0/DOC062509-004.pdf Or the following from Dr. Nicoals Scafeta. http://yosemite.epa.gov/ee/epa/wkshp.nsf/84E74F1E59E2D3FE852574F100669688/$file/scafetta-epa-2009.pdf There has been climate variation over the past 1000 years - and I have referenced the Hadley Centre Technical Note 5 and other sources. There are 50 year cycles in global surface temperature, Arctic surface temperature, American surface temperature, sea surface temperatures, Australian, American, Indian, Asian and African rainfall, west coast US fisheries and cycles of sardine or anchovy in Monterey Bay. There is decadal variation in cloud cover. An increase in shortwave radiation at the surface of 3.5 W/m2 between 1984 and 1998 and a decrease of 2 W/m2 since. Global surface temperature is currently at the 1979 to 1998 average. ARGO data shows no increase in ocean heat content. Together they are the reservoirs of most of the global heat content - a global heat content that should rise with C02 acording to AGW theory. These are all empirical reality going begging for a theory. By all means, dispute the theory but stay true to the data.
    0 0
  38. The correlation between cosmogenic isotopes and global surface temperature over 1150 years is also an empirical reality - with the best correlation being with a 10 year lag. It implies a relationship between heliospheric magnetic intensity and global surface temperature. Do you have a different theory to explain the data? i.e correlation is not causality. What is then the cause of climate variation - and why isn't it included in the IPCC forcings? Apologies for posting the same thing three times - it seems to happen when the refresh button is pushed.
    0 0
  39. There is a wonderfull book on fisheries and climate cycles if anyone is interested. http://alexeylyubushin.narod.ru/Climate_Changes_and_Fish_Productivity.pdf Cheers
    0 0
  40. I think your multiple postings of the same thing are ok, since if you say something loud enough and for long enough, people will begin to believe it- at least it works with saying a 1/10,000 part change in trace gases in the atmosphere has raised the earth's climate T by about one degree ....whilst similar changes in something so enormous as the sun is dismissed as "too tiny". And then there is the argument that the sun hasnt changed much since the mid 20th century,-imagine a bunch of human-global warmers running around between 1 and 3pm looking for a 'mechanism' to explain why the day continues to get warm after the sun peaks at noon.... Future generations will laugh. Human global warming is the 21st century version of Babylonian astrology...but in reverse, instead of movements in the heavens supposedly affecting peoples lives, now people's activities are affecting the 'heavens'...
    0 0
  41. John, responses to these latest two posts ("Climate time lag" and "The CO2/Temperature correlation over the 20th Century") are sounding like a seminar at the Heritage Foundation. We have, it seems, every far-fetched, imaginary, evidence free, disproved, possible mechanism for rising temperature on this planet, except the one for which we have evidence - rising greenhouse gas levels. It would be good if you could cut through some of the nonsense.
    0 0
  42. re:45 It is patently FALSE to say there is only one mechanism or line of evidence for warming-that of rising trace gas levels. The sun has also increased activity over scales of decades-centuries. Both changes are very small, it is a question of relative forcings, and which better correlates and explains, and their relative proportional effect. Even the IPCC guestimates the sun at around 7.5% contribution, down from ~20% from the 2004 report (which is the main issue of dispute). You sound very much like a 'majority-dominant conformist'-ie the common view that ~10% of data that doesnt fit into a dominant model or paradigm is irrelevant. This approach does not work within chaotic systems. Small 'irrelevancies' can have large-scale effects. To state that there is only one evidential 'mechanism' shows you colours; this summation is false. It is also pre-assuming the conclusion on relative forcings, and shows you are not really willing to look at all the evidence. 10% of data that doesnt fit within a 'dominant' model or paradigm does not necassarily only produce 10% of effect. This is especially the case in chaotic systems, and is part of the reason they are chaotic and unpredictable in the first place. Much the same modelling mistakes have been made by financial modellers in recent times. Note also: air T has not risen in at least 10 years, around 15 from a statistical viewpoint, irrepsective of El Nino, 1998. Yet you keep saying T is "rising". Which planet are you living on? Finally, rising c02 levels do not correlate with 2/4 step-like trends in earth T in the last 150 years (1940s-1970s, 2000s-2009), the sun's activity correlates with 3/4 (1890s-1940s, 1940s-1970s, 2000s-2009). So the sun correlates better than C02, (although the last is only a short period, so far). So which is, to use your words, "disproved". (Another word which shows you just don't get it).
    0 0
  43. the last post should be "re:41" sorry
    0 0
  44. Robbo, the point is that _you_ don't have a theory. And you'll never have one if pick up a selected set of contraddictory data uncritically. What is left is just a declaration of your ideology.
    0 0
  45. Ricardo, I keep referencing peer reviewed literature, highly experienced and respectable scientists, the Hadley Centre, CERN etc and you keep saying - nah it just isn't so - you're an idiot right ring ideologue. Atmospheric temperature has declined since 1998 on every record bar the GISSTEMP – and that shows 1998 and 2005 (after a data rejig) as equal within the limits of error. An El Niño may form in the boreal summer but there are a couple of problems with this idea. It is first of all only a transfer of energy from the ocean to the atmosphere. The ocean will get cooler – it doesn’t change the total energy equation. Secondly, ENSO event frequency and intensity is statistically associated with the state of the Pacific Decadal Oscillation. A cool mode, over 20 to 30 years, is associated with more intense and more frequent La Niña and less frequent and less intense El Niño. A weak El Niño or neutral conditions is statistically probable in the current PDO cool mode. Ocean warming trends seem to be indistinguishable from zero (Leuliette 0.8mm/yr +/- 0.8, Willis -0.5mm/yr +/- 0.6, Loethe declining heat content, Cazanave – essentially zero). I expect that there is a 20 to 30 year cooling trend from the underlying cause of the blindingly obvious and related global multi decadal phenomenon. We shall see who has a theory.
    0 0
  46. Robbo, you definitely misquoted or misunderstood my comment. I've never said you're an idiot nor a right wing ideologist. I didn't even said that the GCR-clouds connections is a hoax. I've just pointed out that the "theory" of GCR-induced global warming is not yet a theory and i'm sure you are well aware that a correlation does not make an hypothesis a theory. Assuming it's _the_ theory is simply ideological.
    0 0
  47. "I keep referencing peer reviewed literature, highly experienced and respectable scientists, the Hadley Centre, CERN etc and you keep saying - nah it just isn't so - you're an idiot right ring ideologue." But as you said in #27: "Let’s neglect the unlikely 6 month rise..." So what good is referencing peer reviewed literature if you can cavalierly discount inconvenient information? Maybe that's why you think we think "you're an idiot right ring ideologue."
    0 0
  48. re #15 Shawnet, I can't find a freely downloadable version of the paper. Here's the relevant section from the experimental methods section of the J. Phys. Chem. paper I referred to in post #13:
    "Two series of measurements were performed: the first one (I) with SO2 set to 4 ppb and O3 to 23 ppb and a second series (II) with SO2 set to 30 ppb and O3 to 68 ppb. Atmospheric levels of SO2 range from 20 ppt in the marine surface layer to 1.5 ppb in polluted areas, and O3 concentrations lie between 20 and >200 ppb."
    The ozone levels are realistic. The SO2 levels are very high, especially considering that in the preindustrial natural world, SO2 levels are more likely to be the 20 parts per trillion (marine surface layer) than the 1.5 parts per billion (heavily polluted areas). After all "heavily polluted areas" only exist (outwith volcanic eruption scenarios) in the modern era within which independent evidence rather negates a significant climate contribution from the CRF flux. Natural (non-pollutant) levels of SO2 are between 20-230 ppt according to Seinfeld J.H, Pandis S.N Atmospheric chemistry and physics (1988). I should say that the large 4000 to 30000 parts per trillion concentrations of SO2 used by Svensmark (rather than 20 to 230 ppt natural levels) is not necessarily a major flaw in Svensmark's study, since the particle count is limited by the sensitivity of the particle detector used, and doesn't necessarily mean that lower levels of SO2 don't produce gamma-ray-inducd particles – they just couldn't be detected with the set up used (according to Svensmark's paper). Incidentally,the sentences you pasted from the site you urled seem rather defensive to me! I haven't come across any papers in which the solar-climate link is "disregarded". Solar contributions are always considered - an example is the Hansen et al (2005) paper from which John Cook took the figure on TOA Net radiation. Inspection of the paper indicates that best estimates for all known and quantitated forcings were included in the analysis, solar included. That's always the case. I might say a bit more about the dreary website you urled if I have time later…..
    0 0
  49. re #17 Philippe - not sure. A couple of recent papers suggest: (1) that the change rate of ionization in the lower atmosphere through the maximum variation in CRF (solar cycle max to min) is of the order of 3% [*]... and (ii) that when the largest CRF variations (Forbush events) are analyzed in detail there is a small (but statisticaly insignificant) effect on cloud droplet size (not sure what this means with respect to the CRF-cloud hyothesis), but that the effect on cloud optical depth is in the wrong direction to that expected from the CRF cloud link [**]. So the real world still refuses to conform to the CRF-cloud-temperature hypothesis... [*]Erlykin AD et al. (2009) Solar activity and the mean global temperature Environ. Res. Lett. 4, art # 014006 Abstract: The variation with time from 1956 to 2002 of the globally averaged rate of ionization produced by cosmic rays in the atmosphere is deduced and shown to have a cyclic component of period roughly twice the 11 year solar cycle period. Long term variations in the global average surface temperature as a function of time since 1956 are found to have a similar cyclic component. The cyclic variations are also observed in the solar irradiance and in the mean daily sun spot number. The cyclic variation in the cosmic ray rate is observed to be delayed by 2-4 years relative to the temperature, the solar irradiance and daily sun spot variations suggesting that the origin of the correlation is more likely to be direct solar activity than cosmic rays. Assuming that the correlation is caused by such solar activity, we deduce that the maximum recent increase in the mean surface temperature of the Earth which can be ascribed to this activity is less than or similar to 14% of the observed global warming. [***] Kristjansson JE et al. (2008) Cosmic rays, cloud condensation nuclei and clouds - a reassessment using MODIS data Atmos. Chem. Phys. 8, 7373-7387 Abstract: The response of clouds to sudden decreases in the flux of galactic cosmic rays (GCR) - Forbush decrease events - has been investigated using cloud products from the space-borne MODIS instrument, which has been in operation since 2000. By focusing on pristine Southern Hemisphere ocean regions we examine areas where we believe that a cosmic ray signal should be easier to detect than elsewhere. While previous studies have mainly considered cloud cover, the high spatial and spectral resolution of MODIS allows for a more thorough study of microphysical parameters such as cloud droplet size, cloud water content and cloud optical depth, in addition to cloud cover. Averaging the results from the 22 Forbush decrease events that were considered, no statistically significant correlations were found between any of the four cloud parameters and GCR, when autocorrelations were taken into account. Splitting the area of study into six domains, all of them have a negative correlation between GCR and cloud droplet size, in agreement with a cosmic ray - cloud coupling, but in only one of the domains (eastern Atlantic Ocean) was the correlation statistically significant. Conversely, cloud optical depth is mostly negatively correlated with GCR, and in the eastern Atlantic Ocean domain that correlation is statistically significant. For cloud cover and liquid water path, the correlations with GCR are weaker, with large variations between the different domains. When only the six Forbush decrease events with the largest amplitude (more than 10% decrease) were studied, the correlations fit the hypothesis slightly better, with 16 out of 24 correlations having the expected sign, although many of the correlations are quite weak. Introducing a time lag of a few days for clouds to respond to the cosmic ray signal the correlations tend to become weaker and even to change sign.
    0 0
  50. A rather fatal flaw with the cosmic ray flux (CRF) cloud/climate hypothesis is that the straightforward natural experiments in which the CRF varies by up to 20% through the 11 year solar cycle, or undergoes dramatic short lived reductions again up to around 20% in so-called Forbush events, shows no significant cloud response whatsoever…..and yet some proponents of this hypothesis claim a substantial CRF role in the very marked warming of the last 30-odd years, even though the secular trend in the CRF has been close to zero since around 1958 (slightly in the "cooling direction" if anything through the early 21st century). If massive changes in the CRF produce an undetectale responses, how can virtually zero long term change (or changes in the wrong direction) produce very large effects? The way that the CRF'ers attempt to wriggle free of this problem says quite a lot about the unfortunate disconnect between science in the scientific literature and presentations by a small number of advocates on webstes. On this thread Robbo (post #19) has attempted to deal with the problem ("fatal flaw") by questioning whether CRF- induced cloud nucleation should be instantaneous and whether there should be a link to the 11 year solar cycle. Perhaps there is a long lag between nucleation and cloud formation? Shawnet (post #18) suggests in response to this problem: " I would not be so quick to accept chris's assertion that there is no link btw CRF and clouds" (which I never asserted at all, btw), and refers us to a very odd website by Shaviv. Let's look at both of these: ONE: Robbo and his questioning of fast cloud response to changes in CRF and a link to the solar cycle. Is there a large lag? Let's see what the the CRF-climate advocates think. We can assume that their websites provide the most salient representation of their views untainted by the rigours of peer review. Svensmark: www.spacecenter.dk/publications/scientific-report.../Scient_No._3.pdf Svensmark clearly thinks there should be a negligible lag between the change in the CRF and the cloud/temperature response. He (and Friis-Christensen) make great play in purporting to show a very close temperature-solar cycle link. There's nothing controversial about that of course; it's expected that the solar cycle variation should give a contribution to temperature variation near 0.1 oC max-min-max. Of course it doesn't have anything necessary to do with the CRF, and is fully explainable by changes solar irradiance as indicated by a large body of solar science. No lag. Shaviv: http://www.sciencebits.com/SloanAndWolfendale No lag either. In fact his main criticism of the Sloan Wolfenden paper on the lack of correlation of CRF changes in Forbush events and the cloud response (see TWO below – this is the web page that Shawnet directed us to) is that they use weekly and monthly averages of cloud cover. According to Shaviv the cloud response to the large changes in the CRF is fast and one needs to use daily averages of cloud cover to capture the response. He says "To see effects, one therefore needs to use daily averages of the cloud cover". No lag. So Robbie's questions are addressed very succinctly by the two major proponents of the CRF-climate notion. There isn't a lag between CRF changes and cloud/temperature response – the response should follow the solar cycle. Except it doesn't. It's worth pointing out that Shaviv's stipulation that one needs to address fast (daily averaged) cloud responses to CRF changes in Forbush events has been addressed in a recent detailed analysis of the fast (daily averaged) cloud response to CRF changes in Forbush events [***]. The result:
    "The overall conclusion, built on a series of independent statistical tests, is that no clear cosmic ray signal associated with Forbush decrease events is found in highly susceptible marine low clouds over the southern hemisphere oceans."
    TWO: Shawnet refers us to the Shaviv web site as an "explanation" why he "wouldn't be so quick to accept chris's assertion…" (i.e. my "fatal flaw" point in my first paragraph). In fact Shaviv doesn't address my point but attempts to counter a different one rasied by Wolfendale – Sloan that any slight cloud response to the solar cycle actually lead the CRF changes and therefore the causal element of the CRF-cloud hypothesis is incompatible with the very detailed empirical evidence of the last 60 years. Even 'though this is a different point to mine, let's look at this anyway. Shaviv makes a bogus argument in attempting to explain away the Wolfendale - Sloan problem. He asserts that the phase problem (cloud changes lead CRF changes) arises from the fact that the CRF isn't the only contribution to clouds and that the temperature response to the solar cycle drives a cloud response that shifts the phase of the solar cycle – cloud "couple". He uses some dubious numerology to calculate a cloud response to solar cycle irradiance changes based on the statement that: " We also know that the global temperature changes by about 0.1°C between solar maximum and solar minimum". That sounds like what I said above viz "it's expected that the solar cycle variation should give a contribution to temperature variation near 0.1 oC max-min-max."…. …except it isn't. Shaviv's assertion simply isn't true as anyone that inspects the earth's temperature evolution over the last 60 years could easily see for themselves (e.g. look at Svensmark's Figure 2 on his website I urled above). While the contribution of the solar cycle is around 0.1 oC, this is hidden beneath noise from internal variation in the earths temperature evolution, long term warming trends and so on. If we're going to compare empirical real world data on solar cycle-cloud responses, and are purporting a temperature – cloud contribution, we have to use the real temperature and not a theoretical idealised solar cycle temperature expectation. Likewise, since Shaviv is proposing a solar irradiance-induced cloud response that briefly leads the main CRF-cloud response, we need to consider cloud response during the early part of the solar cycle change. If, for example, the solar cycle max to min irradiance change results in a total change over around 5.5 years of -0.1 oC, Shaviv is proposing that the clouds are responding to an (idealised) temperature change near 0.018 to 0.036 oC (that isn't actually manifest in reality since these tiny contributions are completely swamped by internal variations in the climate system). Shaviv and Svensmark don't publish this sort of stuff in the peer-reviewed scientic literature since you generally have to present scientifically and logically robust arguments with proper data, in science journals. Obviously one can say whatever one likes on one's website. n.b. Those interested in the science on this topic should know that Wolfendale – Sloan have recently published a more detailed confirmation of the lack of correlation of CRF – temperature effects in the 20th century and which reinforces the expectation that any solar – climate relationships are likely due to solar irradiance variation rather than CRF changes. [*****] [***} Kristjansson JE et al. (2008) Cosmic rays, cloud condensation nuclei and clouds - a reassessment using MODIS data Atmos. Chem. Phys. 8, 7373-7387 [*****]Erlykin AD et al. (2009) Solar activity and the mean global temperature Environ. Res. Lett. 4, art # 014006 (see preceding post #49 for abstracts)
    0 0

1  2  3  4  5  6  7  8  Next

You need to be logged in to post a comment. Login via the left margin or if you're new, register here.


The Consensus Project Website

THE ESCALATOR

(free to republish)


© Copyright 2024 John Cook
Home | Translations | About Us | Privacy | Contact Us