Climate Science Glossary

Term Lookup

Enter a term in the search box to find its definition.

Settings

Use the controls in the far right panel to increase or decrease the number of terms automatically displayed (or to completely turn that feature off).

Term Lookup

Settings


All IPCC definitions taken from Climate Change 2007: The Physical Science Basis. Working Group I Contribution to the Fourth Assessment Report of the Intergovernmental Panel on Climate Change, Annex I, Glossary, pp. 941-954. Cambridge University Press.

Home Arguments Software Resources Comments The Consensus Project Translations About Support

Twitter Facebook YouTube Mastodon MeWe

RSS Posts RSS Comments Email Subscribe


Climate's changed before
It's the sun
It's not bad
There is no consensus
It's cooling
Models are unreliable
Temp record is unreliable
Animals and plants can adapt
It hasn't warmed since 1998
Antarctica is gaining ice
View All Arguments...


Username
Password
New? Register here
Forgot your password?

Latest Posts

Archives

Determining the long term solar trend

Posted on 25 March 2008 by John Cook

The most precise measurements of solar activity are satellite observations of Total Solar Irradiance (TSI). TSI is also a useful proxy for other solar activity such as solar flares, cosmic radiation, sunspots, radio flux, UV radiation and x-ray flares - all of which correlate with TSI. However, there is no single continuous record since satellites began taking measurements in 1978. Instead, scientists have had to splice various satellite data together into a single composite record. The two most cited composites are by Frolich and Lean 1998 (PMOD) and Willson 1999 (ACRIM). ACRIM shows a slight increase in solar activity while PMOD shows an even slighter cooling trend.
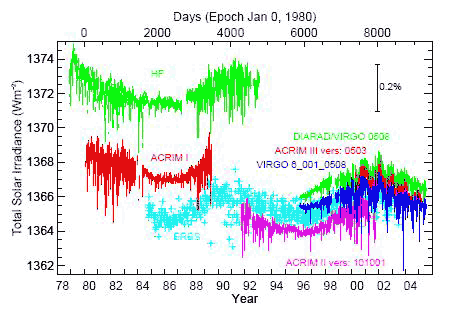
TSI raw satellite data - ACRIM, PMOD, VIRGO, ERBS, HF
Figure 1: daily averaged values of the TSI from radiometers on different space platforms since November 1978.

Both composites show little long term trend in TSI over the 30 years since satellite measurements began. Scafetta 2006, using the warming ACRIM trend, concludes "since 1975 global warming has occurred much faster than could be reasonably expected from the sun alone." So neither composite indicate the sun has been the primary cause of the last 3 decades of global warming. Nevertheless, determining the more accurate TSI reconstruction is a significant piece in the climate puzzle.

Comparing PMOD to ACRIM

The major difference between the two composites is the handling of data between 1989 and 1991. There is a 2 year gap between ACRIM-I and ACRIM-II (tragically due to the Challenge space shuttle explosion). To fill the gap, both composites use the HF data but in dramatically different ways.
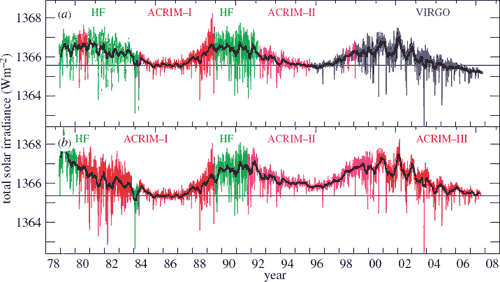

Figure 2: PMOD TSI composite (top) versus the ACRIM TSI composite (bottom). Coloured lines give the daily values with the black solid lines giving the 81 day mean.

PMOD applies corrections to the HF data, which has many sudden jumps due to changes in the orientation of the spacecraft and to switch-offs. Figure 3 demonstrates how the HF corrections are responsible for virtually all of the difference between the long-term drifts of the composites.


Figure 3: The difference between the ACRIM and PMOD composites. The grey line gives the daily values, the black line the 81 day running mean. The step in the ACRIM gap during 1989 is clearly seen and is about half the amplitude of the solar cycle variation.

Another way of comparing the two composites is a scatter plot of TSIACRIM vs TSIPMOD. Most of the data has ACRIM exceeding PMOD - this is for data after 1992. However, there is a small population of points where ACRIM is slightly smaller than PMOD, forming a second, dotted line.
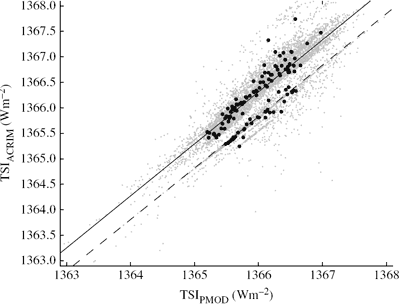

Figure 4: Scatter plot of the daily values (grey) and independent 81-day means (black) of TSIACRIM as a function of the corresponding TSIPMOD value.

Independent tests of the PMOD and ACRIM composites

So which composite correctly handled the HF data? Does TSI dramatically increase during the HF period as ACRIM supposes and the raw HF data indicates? Or did PMOD get their calibrations right when they adjusted the data to show slight solar cooling over the ACRIM gap? Fortunately, there are a number of independent measurements that can confirm solar activity over this period.

  • Lee 1995 compares the ERBS satellite data with the Nimbus HF data and found the HF data drifted significantly over the period of the ACRIM gap while the ERBS data shows a slight cooling.
  • Krivova 2003 compares TSI to UV levels. UV levels fluctuate more than TSI - a trend would be more visible. As UV correlates closely with TSI, Krivova concludes PMOD is more accurate and there has been little secular trend in TSI over the past few decades.
  • A reconstruction of TSI using sunspot numbers (Krivova 2007) found the minimum of cycle 23 was lower than the minimum of cycle 22, in contrast to the ACRIM composite.
  • Zurich sunspot counts during the ACRIM gap show a slight downward trend consistent with the PMOD recalibrated data (courtesy of Open Mind).

The latest independent test comes in the form of a new, wordily titled paper, "Recent oppositely directed trends in solar climate forcings and the global mean surface air temperature. II. Different reconstructions of the total solar irradiance variation and dependence on response time scale" (Lockwood 2008). It compares PMOD and ACRIM to a TSI reconstruction based on measurements of solar magnetograms dating back to 1976 (Wenzler 2006). The agreement between PMOD and Wenzler's TSI reconstruction is very good (a correlation coefficient of 0.91). The corresponding correlation with ACRIM is 0.84. Also revealing is a scatter plot of the PMOD composite with Wenzler's reconstruction:
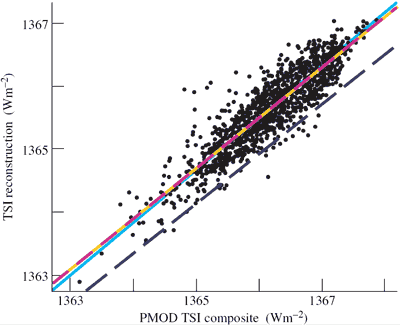

Figure 5: Scatter plot of the daily values of the TSI, as simulated from ground-based magnetograms, as a function of the simultaneous PMOD composite value (1979–2003). The dashed mauve/orange line is the best least-squares linear regression fit and the light blue line is the ideal line of perfect agreement.

If the PMOD composite is correct, the data points should be clustered around the ideal (light blue) line. If ACRIM is correct, a second population should appear aligned along the dashed blue line. Figure 5 shows no such second population. Wenzler's TSI model provides another independent confirmation for the PMOD composite.

So independent tests indicate the PMOD composite is the more accurate TSI reconstruction. The sun has shown a slight cooling trend over the last 3 decades. Not only is the sun not contributing to global warming, it has had a slight, long term cooling effect.

0 0

Printable Version  |  Link to this page

Comments

Comments 1 to 20:

  1. Fraud? In Physics today, March 2008, on page 51, Scafetta and West show a red curve of TSI (total solar irradiance)with a clear increase of TSI since 1980. The subscript mentions 'Data for the red curve are from http://www.cru.uea.ac.uk and http://www.acrim.com'. I followed these links and found instead a slight decrease of TSI since 1980. The error is serious as the authors end their paper with the suggestion that the IPCC report does not need to be taken seriously.
    0 0
    Response: I don't think Nicola Scafetta is engaging in fraud. The ACRIM composite does have a (slight) long term trend of increasing TSI (perhaps you were looking at the graphs on the ACRIM homepage which show a decreasing trend over the last couple of years). But she seems to be convinced the sun is contributing a large portion of the global warming since 1975. In Scafetta 2006, she compares solar activity to temperature and finds "since 1975 global warming has occurred much faster than could be reasonably expected from the sun alone." Then she casts doubt on her conclusion by citing urban heat island effect, imprecisions in solar data, land use. It's the first time I ever saw a scientist debunk their own conclusion in the same paper.
  2. See the graph of TSI John just poated on the global cooling thread
    0 0
    Response: You mean this one:


    Quite coincidentally, we've been discussing TSI reconstructions although I did this latest PMOD vs ACRIM post because I received a copy of Mike Lockwood's paper last week. But it's neat timing - Krivova's 2007 TSI reconstruction is quite relevant to the PMOD/ACRIM debate.
  3. Re: since 1975 global warming has occurred much faster than could be reasonably expected from the sun alone." Agreed. But this does not prove the AGW hypothesis. Let me quote Thomas W. Blaine, Ohio State University Extension FactSheet "Global Climate Change": *** "The specific gases that occur naturally in the atmosphere to sustain the greenhouse effect include water vapor, carbon dioxide (CO2), methane (CH4), ozone (O3), and nitrous oxide (N2O). These are often referred to as “greenhouse gases.” It is widely agreed that concentrations of greenhouse gases present in the atmosphere (particularly carbon dioxide and methane) have varied tremendously over the period of the earth’s existence, and there is considerable agreement that these changes correlate with temperature change. ... It was about 18 degrees F warmer than at present about 100 million years ago when the dinosaurs roamed the earth. It is estimated that at the other extreme, the earth was more than 10 degrees F cooler than at present during the last ice age, which ended about 10 thousand years ago. ... Numerous questions remain. For example, why has there been only a 1 degree F increase in global temperature, when climate models predict it should have been twice that amount, given current greenhouse gas emissions?" *** This addresses long term trends while your blog here is using only short term data. TSI by itself is almost meaningless but the Solar Cycles can be used as a clock. Mackey explains how the gravity of the planets and the gas giants in particular effect solar tides and increase the effect of solar wind as well as TSI. This hypothesis is a much newer one than AGW, has just as good a fit with known data and definately needs further study. Not covered by Mackey are the same tidal effects on the earths internal engine. These effect the primary local climate drivers like El Nino / La Nina.
    0 0
  4. This is not to say that there is no AGW, there is definate evidence of AGW contribution through ozone, hydrocarbons and oxides of nitrogen, but CO2 appears to be the feedback mechanism rather than the cause, hence the lag. But until any hypothesis has been proven true I will remain skeptical as I have an field engineering background and can not accept any hypothesis based solely on consensus.
    0 0
    Response: The problem with invoking CO2 lagging temperature as a way of disproving AGW is that ice core records actually confirm the amplifying effect of atmospheric CO2. Plus as you say, it's a feedback mechanism. We pump CO2 into the air, it causes warming, the warmer temperatures cause the land and oceans to give up more CO2 - you have a positive feedback loop. There's a paper coming out on this very mechanism which I hope to post on within the next few weeks.
  5. I am not saying that CO2 lag disproves AGW, I accept the fact of AGW but I do not accept that CO2 is the prime mover. I do look forward to reading the paper you mention with great anticipation. I wan't to see if it confirms my suspicions. In 1975 the Clean Air Act was passed, requiring vehicle manufacturers to meet standards in HC, CO and NOx. As you are probably aware these emissions ride opposing curves so lowering one tends to elevate another. The addition of a catalyst, and later a combination of three catalysts was able to reduce these emissions by changing the specified emissions to water vapor and CO2 and Sulphur dioxide. I worked in an emissions lab for 10 years and when the 1981 standards came out there was an additional increase in CO2 and water vapor (these emissions were not considered harmful to the environment) and additional sulphur dioxide. That is why exhaust systems don't last as long as they did on pre-emission vehicles. The largest emission from modern gasoline engine vehicles has been water vapor. This means sulphuric acid diluted in water vapor pumping out from all the vehicles fitted with a catalytic converter (1975 on for most passenger vehicles). Don't you find this coincidental timing of instituting emission controls and the advent of acid rain and AGW just a little strange?
    0 0
    Response: The timing isn't strange at all. The Clean Air Act had the effect of lowering aerosols in the atmosphere which have a cooling effect. As aerosols have a short life in the atmosphere, removal of the cooling effect would've been fairly quick. This is one of the reasons for mid-century cooling (with cooling solar activity possibly one of the other factors) which ended in the mid 70's. I wasn't aware that the Clean Air Act had the effect of increasing CO2 emissions which is an interesting point.
  6. To stay in topic, this post and its sequel are mighty interesting: http://tamino.wordpress.com/2007/07/24/pmod-vs-acrim/
    0 0
  7. You're right Phillippe, interesting.. but oh no another variable that affects everything.
    0 0
  8. Philippe I understood the main post but had some difficulty following the updates. His summary statement is logical but I can't seem to figure out if he reinforced the original statement or switched directions.
    0 0
  9. Wondering Aloud That is what converted me from passively accepting AGW to being skeptical (as to the source and strength of AGW) in the first place. There are too many variables that were not originally addressed and that may explain the large discrepancies between predicted behavior and observations.
    0 0
  10. What about solar cycle #25? The current rate of the sun's conveyors has slowed to a crawl which predicts sunspot activity 20 years from now: http://www.physorg.com/news66581392.html "...For more than a century, "the speed of the belt has been a good predictor of future solar activity... [ 2022 could be ] "...off the bottom of the charts."
    0 0
  11. John I assume that you are aware of the news for the past couple of days. There is something about changing the shape of the magnetic field that rings a bell but I can not remember what it is. Discovery - Source Of Slow Solar Wind 2 April 2008 - 1:54am Magnetic Substorms In Space 3 April 2008
    0 0
    Response: I wasn't aware, thanks for the heads up. The links don't seem to work but googling your headlines brought up the info easy enough. Thanks, interesting stuff!
  12. Yes, I noticed that only the links that you post work, the ones from comments only work with cut and paste. There are some other sites like that also, I don't know why it is except possibly the O/S running on the server. Whiles links made in unix will always work with MS software, I find that MS created links often do not work on unix servers. That was why we used unix for our websites (before I retired I was involved in building a support network by editing and converting technical manuals). But thats why I include title and date, and author when available. BTW I have some cantidates for your weekly contest that I enjoyed reading: http://www.time.com/time/magazine... The Clean Energy Scam TIME/CNN http://epw.senate.gov/public/index.cfm?FuseAction=Minority.Blogs... New Peer-Reviewed Scientific Studies Chill Global Warming Fears Posted By Marc Morano – Marc_Morano@EPW.Senate.Gov August 20, 2007 http://epw.senate.gov/public/index.cfm... U.S. Senate Report: Over 400 Prominent Scientists Disputed Man-Made Global Warming Claims in 2007 Senate Report Debunks "Consensus" Report Released on December 20, 2007 U.S. Senate Environment and Public Works Committee (Minority) http://www.environmentalgraffiti.com/sciencetech/volcano... Volcano, Not Global Warming Effects, May be Melting an Antarctic Glacier January 21, 2008 http://www.energytribune.com/articles.cfm?aid=828 Mar. 20, 2008 By Roy W. Spencer The Sloppy Science of Global Warming Roy W. Spencer is a principal research scientist at the University of Alabama in Huntsville. His book, Climate Confusion: How Global Warming Leads to Bad Science, Pandering Politicians and Misguided Policies that Hurt the Poor, will be published this month. http://www.appinsys.com/GlobalWarming/Phoenix_UrbanHeat.htm This document provides an examination of the urban heat effect in Phoenix Arizona.
    0 0
    Response: My links are hyperlinks only because I'm using HTML - feel free to use HTML in your comments. In fact, please do so the long URLs don't wreak havoc with my web design. Eg - <a href="http://www.website.com/">Title of Link</a>

    But please keep the links on topic.
  13. John Thank you, will do hyperlinks, and yes I will try to stay on topic although it is difficult because one factor usually involves another.
    0 0
  14. "So neither composite indicate the sun has been the primary cause of the last 3 decades of global warming." A bit of pedantry....with the exception of internal heat, ALL of the heat recieved comes from the sun; therefore the sun IS the primary cause of GW. Science is about exactitude; CO2 & other factors simply moderate the heat flow process Heat in - Heat out. The CO2/GW lead/lag debate cannot be dealt with as a separate isolated issue; GTemp up, ice melt increases(cooling), evaporation increases (cooling), more active oceanic flow - better heat distribution, biomass increases locking up CO2 and so on. Because all the factors in the climate process are interelated (and clearly somewhat synergistic)it has to be modelled as a whole; selecting datasets (for whatever reason -cherry picking; better accuracy;longer sampling periods etc) is fine as long as you then re-run the entire model. If anything, this post simply reminds us how little real, definitive, accurate, comprehensive data is available and until we get THAT sorted out the AGW argument will not be taken seriously except as a political issue.
    0 0
  15. John, In your response to Quietman in #4 above, you say;- ".... it's a feedback mechanism. We pump CO2 into the air, it causes warming, the warmer temperatures cause the land and oceans to give up more CO2 - you have a positive feedback loop." There are two sides to that coin. What about the negative feedback loop of the water cycle? Higher temperatures also mean more atmospheric water vapour... more water vapour, more clouds... more clouds, more reflection of solar radiation, and hence cooling.
    0 0
  16. Pump more CO2 into the air and warm the place up and plants grow better and bigger....reaction mass increases roughly 100% for every 10C rise...CO2 gets locked up, more clouds, more precipitation, more CO2 from declining oceanic planktonic activity, more CO2, more clouds, more CO2 washed out back into the land where it becomes carbonates, over time CO2 goes down, temp drops, the balance shifts from land to ocean again and the cycle continues. This has been going on ever since plant life started photosynthesis and the small amount of extra CO2 we release will not substantially affect the cycle.
    0 0
    Response: On the contrary, the amount of CO2 we release has raised CO2 levels to its highest level in at least 800,000 years (according to ice core readings that go back that far)
  17. #15 That's just incorrect Healthy Skeptic. Raised greenhouse gases cause the atmosphere to warm and to increase the concentration of water vapour. That's a straightforward prediction from our understanding of atmospheric physics....... and we can measure this in the real world. There is no evidence that increased water vapour has a "cooling" effect that you speculate on. Since warmer air has a higher capacity for water vapour there is no necessary increase in clouds with enhanced water vapour. In any case clouds don't just reflect solar radiation. They also also efficiently trap outgoing thermal radiation (even an unhealthy "skeptic" must have direct experience of that fact!) and retain heat in the surface and lower atmosphere. Since we have a wealth of paleodata on the relationship between Earth's temperature and atmospheric CO2 levels, and the data indicate a clear correlation between temperature and CO2 (highish temperatures when CO2 is high and lowish temperatures when CO2 is low), a skeptic would have every reason to be skeptical about your proposed cooling efect of water. It's pretty clear that increased water vapour enhances CO2-induced warming. try this, for example: http://www.nasa.gov/topics/earth/features/vapor_warming.html
    0 0
  18. #16 Some plants grow better with raised CO2 and some don't. Since plants also require water and nutrients, the idea that plants will continue to show enhanced growth in a world with higher CO2 levels, and that this will result in "locking up" of significant CO2, is fallacious. In any case, the limits on plant growth and CO2 sequestration are dominated by land use/deforestation, and not be CO2 levels. The notion that "reaction mass increases roughly 100% for every 10C rise" is an empirical finding from physical chemistry and doesn't apply to biological systems. Your other points about cycles don't really accord with real world considerations either. The rate of drawing excess CO2 out of the atmosphere is very slow, and so there isn't really any significant "draw down" of the vast amounts of CO2 we're pumping into the atmosphere apart from that amount that is partitioning into the oceans. It's plain to see that atmopsheric CO2 levels are rising at a phenomenal rate (over 100 times faster than during the last glacial to interglacial transition which is the most recent example of a natural change in atmospheric CO2 levels)...so your "cycle" clearly isn't acting.. The "small amount of extra CO2 we release" is certainly not "small"! It's enormous. It's an amount that could only be sustained for a truly tiny period (several hundred years), and it's occuring at a rate that were we to carry doing so for several hundred years we would effectively return to the atmosphere all of the CO2 in fossil fuels that took several hundreds of millions of years to form... You are correct 'though, that the massive amounts of extra CO2 that we release "will not substantially affect the cycle". The cycle responds very slowly to enhanced CO2, and so any feedback elements are going to be rather insignificant in their abilities to mitigate our truly massive increases in atmospheric CO2...
    0 0
  19. The amount of CO2 we put into the atmosphere is large when considered on its own. What remains there is about 50%, the rest ends up in the oceans. So of the 2.7 x10e13 kg we emit, roughly 1.3 x 10e13 stays to increase the 3 x 10e15 kg of CO2 already there. In that context the amount we add is small....very small.
    0 0
  20. You really need to consider what "large/small" refers to in context. It's difficult to come up with a meaningful context in which our rate or return of atmospheric CO2 into the atmosphere is not massive: It's massive in relation to the time (100's of millions of years) it took to sequester this carbon in the first place. We're dumping it back in to the atmosphere at a rate somewher around 1 million times faster than it took to sequester. It's massive in relation to the cumulative increase in the concentration of CO2 in the atmosphere. It's massive in relation to the rate of enhancement of the Earth's atmosphere greenhouse gas concentration. It's massive in relation to the rate of enhancement of greenhouse gas concentrations and forcings compared to recent Earth's history; e.g. glacial cycles of last million years....the greenhouse gas concentrations of the last 10 million years. It's massive in relation to the rate at which natural cycles (largely weathering) can remove excess CO2 from the atmosphere. It's massive in the context of the rate of depletion of a non-renewable energy source...
    0 0

You need to be logged in to post a comment. Login via the left margin or if you're new, register here.


The Consensus Project Website

THE ESCALATOR

(free to republish)


© Copyright 2024 John Cook
Home | Translations | About Us | Privacy | Contact Us