


 Arguments


El Niño in 2014: Still On the Way?
Posted on 9 July 2014 by Rob Painting
Key Points:
- Development of El Niño in 2014 continues to edge closer with sea surface temperatures (SST) in the key indicator equatorial regions approaching El Niño thresholds.
- The discharge of ocean heat to the atmosphere associated with the build-up of the El Niño phenomenon has predictably seen a rise in global surface temperatures, resulting in May 2014 being the warmest May ever recorded.
- Despite the strong initial build-up of a large warm water volume anomaly (WWV) in the equatorial subsurface ocean earlier in the year, the atmosphere has so far not provided sufficient reinforcement to maintain this large pool of warmer-than-average water and a substantial portion has been eroded.
- The last half-century of observations, however, still favour the development of an extreme El Niño event, but the substantial reduction of the warm water volume anomaly (thankfully) diminishes the odds of a powerful event rivaling that of 1997-1998 from taking hold.
Figure 1 - global sea surface temperature (SST) anomalies (departures from the long-term average) as at 26th June 2014. Strong equatorial SST warming off the coast of South America (shown in red rectangle) is a tell-tale signature of El Nino conditions beginning to form. Image from NOAA Coral Reef Watch.
El Niño on the Wane?.......
The intensity of El Niño is determined by a number of factors but, as discussed in the previous 2014 El Niño post, the size of the equatorial warm water volume (WWV) anomaly is a crucial ingredient because the heat from this warm water volume is discharged to the atmosphere as El Niño matures.
Earlier this year we saw the largest March WWV anomaly ever recorded. This warm anomaly exceeded even that of the monster El Niño of 1997-1998, raising fears of a similarly devastating El Niño in 2014. Fortunately, the chances of a repeat of 1997-1998 appear to have greatly diminished. The atmosphere needs to provide reinforcement in order for El Niño to fully take hold, and although there have been brief episodes of westerly wind bursts, which allow near-surface warm ocean currents to flow back toward the east and shut off the upwelling of cold water there, these have not been of sufficient strength, or persistence, to shut off the upwelling entirely. As a result, the anomalous pool of warm water sitting beneath the eastern Pacific Ocean has been eaten away (moved out of the equatorial region) and is now substantially smaller than before - see Figure 2.
Figure 2 - Global ocean temperature anomaly for the period 29th March-17th June 2014 (the Pacific Ocean is in the centre frame). Note that these are anomalies, not absolute temperatures, so the warmest water is still at the surface. The decline in the equatorial WWV anomaly is obvious as time progresses. Image adapted from CPC GODAS.
One striking aspect of Pacific sea surface temperature patterns in Figure 1 is the difference between the North and South. In the North Pacific, the subtropical gyre - the large rotating mass of surface water in the equatorial to mid latitudes - appears to have spun-down. Consequently, the poleward export of warm surface water northwards out of the tropics has been greatly reduced, and the Pacific Decadal Oscillation (PDO) - an index of sea surface temperatures north of 20° latitude - has switched to a positive (warm) phase in 2014.
This isn't the case for the South Pacific subtropical gyre. The persistent easterly trade winds have the gyre still exporting heat poleward out of the tropics. The two main indicators of this, aside from the ongoing trade winds themselves, are the anomalously warm sea surface temperatures, and anomalous sea surface height, west of New Zealand (the centre of the gyre), and the ongoing upwelling of cold water off the coast of South America.
Figure 3 - Global sea surface height (SSH) anomaly for May 2014. The black ellipses are a (very) rough sketch of the Pacific Ocean subtropical gyres, with the arrows denoting the direction of their rotation. Above-average SSH in the South Pacific gyre indicates warm water mass (exported from the tropics) piling up in the centre of the gyre, whereas below average SSH in the North Pacific indicates weaker-than-normal circulation. Units are in centimetres Image adapted from CPC GODAS.
....Or Extreme, Irreversible, El Niño Already Set in Motion?
So, with the subsurface blob of warm water in the eastern equatorial Pacific having decreased substantially, does that mean that there's no risk of an extreme El Niño happening? Well, no, not if the last 50 years of ENSO observations are anything to to go by.
Kim & Cai (2014) looked at the various phases of ENSO since 1960 and found that a strong flow of warm water (Kelvin waves) toward the eastern Pacific during the early, developing, phase of El Niño, specifically the months of April and May, only occurred in the lead-up to events which later matured into extreme El Niño. Kim & Cai (2014) defined an extreme El Niño as those events where sea surface temperatures in the Niño 3 region reached a peak anomaly in excess of 1.2°C above long-term mean. 4 of 16 El Niño in the 50-year observational record fell into the extreme category, namely; 1972-73, 1982-83, 1997-98, and 2009/10.
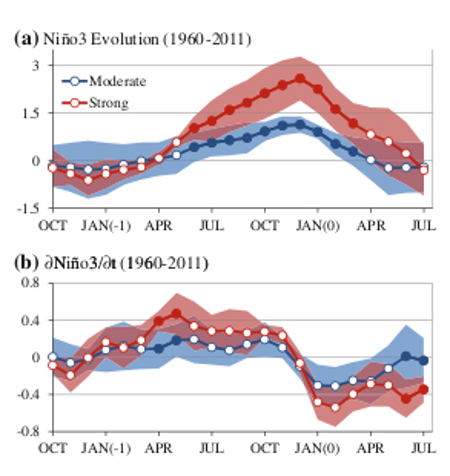
Figure 4 - from Kim & Cai (2014). SST change in the Niño3 region for El Niño years between 1960-2011 with the solid lines indicating the mean. The evolution in Nino 3 SST anomalies for strong & moderate events through the year is shown in (a), and the bottom panel (b) shows the rate of SST change throughout El Niño. The bottom panel demonstrates the importance of the warming rate in the months of April & May in creating the stronger SST warming later in the year. Image from Kim & Cai (2014).
What the authors found is that whenever this strong horizontal transport of warm water from western to eastern Pacific occurs over the critical April-May period, it is inevitably the precursor to an extreme El Niño taking place later in the year (El Niño reaches a peak around December). If this relationship still holds true, then the strong Kelvin wave activity, corresponding anomalous eastward flow of warm water, and the change in sea surface temperatures in the Niño 3 region during April-May this year, portends an extreme El Niño making its presence felt later in 2014.
Reinforcements May be on the Way
Unlike some previous El Nino years, notably the monster 1997-1998 one, the trade winds have picked up strength again over the last 4 weeks, which has held back further El Niño development. This is seen in the Southern Oscillation Index (SOI), which has been positive over the past month - indicating a lower sea level pressure at Darwin than at Tahiti.
For El Niño to keep evolving the atmosphere needs to respond and provide encouragement. This is typically accomplished by convection (evaporation/clouds/rainfall) moving out from the western Pacific to the central Pacific and beyond. Doing so reduces or reverses the sea level pressure gradient between Tahiti and Darwin (and shifts the SOI into negative values), thus shutting down the trade winds temporarily.
Some models predicted that the Madden-Julian Oscillation (MJO), a tropical pulse of cloud and rainfall (i.e. strong convection) that moves eastward along the equator with a cycle of 1-2 months, was due to move eastward out over the equatorial Pacific at the time of writing. If so, we should expect to see westerly wind bursts (WWB) in the western Pacific develop, and early indications are that they have.
Figure 5 - Tropical SST and wind five-day means (top panel) and anomalies (bottom panel) from 22nd May-26th June 2014. Westerly wind bursts (arrows pointing to the right in bottom panel) die out on May 22, followed by a lull before strengthening again in late June. White areas of the animation are missing data. Note the pool of warmer-than-normal surface water moving westward in the last few frames. Images from the TAO Project.
This means that further Kelvin waves will makes their way across the Pacific Ocean, thus transporting more ocean heat from west to east, and giving the system a further nudge toward El Niño when it reaches the eastern Pacific in about two months time. But for El Niño to take a firm hold, the atmosphere is going to have to play ball by persistently shifting convection out toward the central and eastern Pacific, thereby relaxing the trade winds. Once the trade winds weaken sufficiently, so too will the upwelling of cold water in the east, and the poleward transport of warm surface water out of the tropics.
Let's Not Party Like it's 1997-1998
Earth's weather continues to slowly inch toward El Niño, but the failure of the trade winds to persistently weaken has seen El Niño's development in 2014 delayed. If, as some indicators suggest, the system does develop into a full-blown El Niño we can expect tropical sea surface temperatures to continue to increase right up to the end of the year (see Figure 4) before gradually diminishing in 2015.
Fortunately there has been a marked reduction in the equatorial warm water volume anomaly in the last month, so an El Niño rivaling that of 1997-1998 - the most powerful El Niño of the 20th Century - seems unlikely. But even so, Pacific Ocean trends of the last 50 years demonstrate that the strong equatorial flow of ocean currents toward the eastern Pacific in the critical April-May period, have always preceded extreme El Niño events later the same year. Should this trend continue, and based on observations earlier this year, we could still experience an extreme El Niño in 2014. Only time will tell.


May I suggest that, if you want this excellent piece to be fully accessible to all interested readers, you avoid the temptation of lapsing into acronym speak. I have been following this thing for quite a while, but I still forget, for example, what WWV is. Yes, you spell it out early on. But most interested but casual readers don't scour every word from beginning to end, but skim for the parts that interest them most. But when, as they skim, they hit more and more bewildering acronyms, the less likely they are to persevere. Thanks, again, for a great, informative piece. I hope it can be made even more informative for many more people with just some relatively minor adjustments.
Just eyeballing the figures and computing with error bars as wide as a spiv I get:
450 degree-metres 7,700 km latitude 2,200 km longtitude
=7.6 * 10**18 kg-degrees
=31 zettajoules
Does that sound about right or does somebody have a better estimate of the heat content in that pool of warm water vis-a-vis the temperature benchmark for its anomaly ?
A very clear and thorough presentation of this multi-faceted aspect of our planet's complex, but increasingly better understood, climate system.
In the opening of the 3rd last paragraph I believe you transposed east and west. I believe it should be:
"This means that further Kelvin waves will makes their way across the Pacific Ocean, thus transporting more ocean heat from west to east, and giving the system a further nudge toward El Niño when it reaches the eastern Pacific in about two months time."
(Rob P) - Thanks for pointing that out. Now fixed.
Thanks again Rob for another very interesting article. The one thing that I hadn't read anywhere else is that the PDO has shifted to a positive state. How robust do you think this change is? Is it possible that it could shift back to a negative state? Perhaps you could elaborate more on what you think the broader implications might be. Should we expect surface temperature to increase again at rates last seen in the 80s and 90s?
(Rob P) - Is the weakening Pacific Decadal Oscillation (PDO) a sign of the climate moving toward a positive Interdecadal Pacific Oscillation (IPO), or 'accelerated warming decades' as Meehl et al (2013) put it? That's a very interesting question.
I'll have a future blog post about that, but not only is the PDO positive, but the North Atlantic subpolar gyre is cooling - consistent with the spin-down of the North Atlantic subtropical gyre, and the subsequent reduction in the northward transport of warm subtropical surface water.
This image from Meehl (2013) - based on the NCAR climate model runs - differentiates the hiatus vs accelerated warming decades. The approximate area of the North Atlantic subpolar gyre is south of the southern tip of Greenland.
Note that the subpolar gyres spin in the opposite direction to the subtropical ones creating surface divergence. Therefore upwelling (Ekman suction) occurs in the subpolar gyres - as opposed to surface convergence and downwelling (Ekman pumping) in the subtropical gyres.
Joe T
The monthly Pacific Decadal Oscillation inde is available here. I would also strongly recommend the Australian Government's Bureau of Meteorology's ENSO Wrap-Up which gets updated roughly once every two weeks. The latter includes multiple tabs: Overview / Sea surface / Sea sub-surface / SOI / Trade winds / Cloudiness / Outlooks / Indian Ocean / Effects. Indian Ocean focuses on the Indian Ocean Dipole (IOD) also known as the Indian Ocean Dipole Mode Index (DMI) with recent data and basic explanations.
The Indonesian eruptions of the Kelut volcano and Sangeang Api volcano on February 13 and May 30 respectively may already have switched the Pacific Ocean back into a more La Nina mode. The eruption clouds of both eruptions penetrated well into the stratosphere.
I like your piece, Rob, but you say "the substantial reduction of the warm water volume anomaly (thankfully) diminishes the odds of a powerful event rivaling that of 1997-1998 from taking hold." We will be thankful in one way — from potentially less drought and other extreme weather conditions than otherwise — but in another way it would be good to have an El Nino as strong or stronger than the one in 1997-1998 because then many more people may wake up to the reality of global overheating, like many did when 1998 became the hottest year in the instrumental record at that time, and be inspired to take climate action.
(Rob P) - I understand the sentiment, but there are no guarantees that another record-breaking warm year will sufficiently shift public opinion. The last one came only 4 years ago (2010), and yet here we still are.
The level of greenhouse gases - predominantly carbon dioxide - in the atmosphere is what counts and so far that just continues to climb. You will note (below) what happened to CO2 levels after 1998 - they kept increasing. As long as that continues, the oceans and atmosphere will only grow warmer and the oceans will continue to acidify.
wwysim - for what fairly spare information I can find, the volume of ejecta from the recent Indonesian eruptions is far below Pinatuba and unlikely to affect weather.
While volcanoes undoubtedly cool the climate, I am unaware of evidence that they can affect the ENSO cycle. Do you have a reference?
I've never been able to find a good explanation of why El Nino events cause temporary atmospheric warming. There are 4 factors I can think of:
1. Increased volume of warm surface water increases the amount of IR radiation entering the atmaosphere, and so causes increase warming.
2. Increased evaporation causes a higher humidity and therefore increased absorption of IR radiation ( a temporary enhanced greenhouse effect).
3. Incresed eveaportaion of warm water carries energy into the atmosphere which is transferred to the rest of the lower troposphere by conduction and convection.
4. Increased evaporation causes an increase in humidity which results in more cloud formation. As the vapour condenses, the production of latent heat involved in the phase transition is transferred to the surrounding air by conduction.
Are any of these mechanisms responsible for the increased temperature? If so, which ones and to what degree does each contribute to the warming?
I think this would be a good topic for short article.
With regard to my previous post, I've thought of a 5th possible mechanism for warming.
5. A decrease in cloud cover over land results in more sunlight being absorbed by land surfaces. This results in an increased amount of IR radiation entering the atmosphere, which causes the temporary warming.
The basics of how El Nino temporarily increases the global average and La Nina temporarily reduces the global average is the air circulation above the water surface is warmed above warmer water and cooled above cooler water:
@OPOF
Thank you for the reply but I was already aware of the basics. The question I have is, "how does the warm ocean water transfer thermal energy to the air above it?"
I believe that the main method of thermal energy transfer is via Method 4 as described in my first post - "increased evaporation leads to increased humidity, which leads to increased cloud formaton, with the extra warming due to latent energy liberated from the phase transition as gaseous water vapour condenses to form liquid water droplets in clouds." But I don't know if that is actually true.
WRyan,
I had not misunderstood your question, but can clarify my response.
The air passing across the water is affected by the temperature of the water surface. It is like the way the air above pavement is warmed in the night if the pavement is heated by the sun during the day.
The large area of cooler surface water referred to as La Nina will lead to cooler air than the large area of warmer surface water referred to as El NIno.
WRyan, One more piece of information that mayhelp understand the temporary but significant influence of the swings between El Nino and La Nina is the amount of change of average ocean surface temperature in the equatorial Pacific.
The ENSO values are presented by NOAA as the ONI (Ocean Nino Index), along with explanations of how they are evaluated. The variation in the average surface temperature of the equatorial Pacific Ocean is as much as 4 degrees C. That is why a stong El Nno or La Nina can temporarily result in a significant shift of the global average temperature from the ONI Neutral condition.
WRyan,
Also, natural wind patterns circulate air above the equatorial Pacific to other regions of the planet. So the changes of the surface of the equatorial Pacific can significantly change surface temperatures beyond the equatorial Pacific.