Climate Science Glossary

Term Lookup

Enter a term in the search box to find its definition.

Settings

Use the controls in the far right panel to increase or decrease the number of terms automatically displayed (or to completely turn that feature off).

Term Lookup

Settings


All IPCC definitions taken from Climate Change 2007: The Physical Science Basis. Working Group I Contribution to the Fourth Assessment Report of the Intergovernmental Panel on Climate Change, Annex I, Glossary, pp. 941-954. Cambridge University Press.

Home Arguments Software Resources Comments The Consensus Project Translations About Support

Twitter Facebook YouTube Mastodon MeWe

RSS Posts RSS Comments Email Subscribe


Climate's changed before
It's the sun
It's not bad
There is no consensus
It's cooling
Models are unreliable
Temp record is unreliable
Animals and plants can adapt
It hasn't warmed since 1998
Antarctica is gaining ice
View All Arguments...


Username
Password
New? Register here
Forgot your password?

Latest Posts

Archives

Empirical evidence that humans are causing global warming

Posted on 15 October 2009 by John Cook

It still surprises me when I hear skeptics claim there is no evidence that we're causing global warming. The evidence is there in the peer reviewed literature. What they're really saying is they haven't bothered to look. So to make things easier for everyone, here is the evidence that humans are causing global warming. It's not based on theory, climate models, faith or political ideology but on direct, empirical observations. The line of evidence is as follows:

Humans are raising CO2 levels

Is it arrogant to claim we humans could possibly affect something as large as the global climate? It's not a question of arrogance. It's merely a question of numbers.

The first measurements of atmospheric CO2 were conducted by Charles Keeling in 1958 at Mauna Loa, Hawaii. Currently, atmospheric CO2 levels are being measured at hundreds of monitoring stations across the globe. For periods before 1958, CO2 levels are determined from analyses of air bubbles trapped in polar ice cores.

In pre-industrial times, CO2 has been relatively stable at around 260 to 285 ppm. Over the last 250 years, atmospheric CO2 levels have increased by about 100ppm. Currently, the amount of CO2 in the atmosphere is increasing by 15 gigatonnes every year.

We can calculate how much CO2 we're emitting from international energy statistics, tabulating coal, brown coal, peat, crude oil and cement production by nation and year. What we find is fossil fuel emissions have continued to increase. In 2008, we were emitting CO2 at a rate of 29 gigatonnes per year.


Figure 1: CO2 levels (Law Dome ice core and Mauna Loa, Hawaii) and Cumulative CO2 emissions (CDIAC).

Humanity is emitting nearly twice as much CO2 as ends up remaining in the atmosphere. Oceans and plants are actually reducing our impact on climate by absorbing a large portion of our CO2 emissions. Our actions are having a significant impact on the composition of our atmosphere. It's not arrogant to say we can change global climate. On the contrary, the arrogance lies in thinking we can act as we like without consequences.

CO2 traps heat

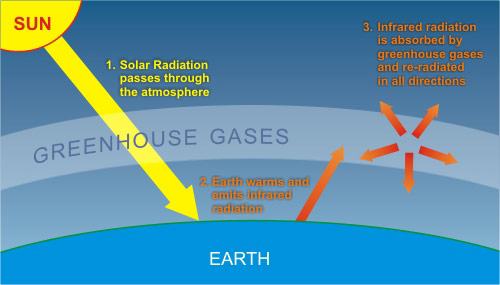
How does CO2 trap heat? Sunlight passes through our atmosphere and warms the earth. The earth cools by emitting infrared radiation back towards space. As infrared radiation travels through the atmosphere, some is absorbed by greenhouse gases such as water vapour and CO2. This warms the atmosphere which then reradiates the infrared radiation in all directions. Some escapes to space while some radiates downwards and further warms the Earth.

With more CO2 in the air, we expect to see less infrared radiation escaping out to space.  To confirm this, satellite readings of outgoing radiation in 1970 were compared to measurements made from 1996 through to 2006 (Harries 2001, Griggs 2004, Chen 2007). They found a drop in outgoing radiation at the wavelengths that CO2 absorbs energy, consistent with theoretical expectations, thus finding "direct experimental evidence for a significant increase in the Earth's greenhouse effect".

Ground measurements also find an increase of infrared radiation heading back down towards Earth, confirmation of an enhanced greenhouse effect (Philipona 2004, Puckrin 2004Wild 2008, Wang 2009). By closely analysing the changes at different wavelengths, scientists can calculate how much each greenhouse gas contributes to the warming effect. The results are consistent with both theory and satellite measurements of the enhanced greenhouse effect, leading the authors to conclude that "this experimental data should effectively end the argument by skeptics that no experimental evidence exists for the connection between greenhouse gas increases in the atmosphere and global warming." (Evans 2006)

Our planet is accumulating heat

We know we're raising CO2 levels. We have proof that more CO2 causes an enhanced greenhouse effect. What is the result? When you add up all the heat accumulating in the oceans, land and atmosphere plus all the energy required to melt glaciers and ice sheets, you find that the planet is accumulating heat at a rate of 190,260 GigaWatts (Murphy 2009). Considering a typical nuclear power plant has an output of 1 GigaWatt, imagine 190,000 nuclear power plants pouring their energy output directly into heating our land and oceans, melting ice and warming the air.


Figure 3: Total Earth Heat Content from 1950 (Murphy 2009).

What about claims that it hasn't warmed since 1998. Could we be experiencing global cooling? Not at all. How do we know? Think about what global warming really is. The planet is accumulating heat. More energy is coming in than is going out. Is this energy imbalance still occuring?

To answer this question, think about where most of global warming goes? Around 95% goes into warming the oceans. Measurements of ocean heat content find a warming trend through to the end of 2008 (Schuckmann 2009). There's strong evidence that the oceans are still accumulating heat. Global warming is still happening.


Figure 3: Time series of global mean heat storage (0–2000 m), measured in 108 Jm-2.

So why have we experienced surface cooling in recent years? It's not unusual or unprecedented for surface temperatures to show cooling over short periods. As the ocean contains much more heat than the atmosphere, relatively small exchanges of heat between the ocean and air can cause significant changes in surface temperature.

In 1998, we experienced the strongest El Niño on record. This moved massive amounts of heat from the Pacific Ocean into the atmosphere, leading to an abnormally warm year. Conversely, the last few years have seen the strongest La Niña conditions in over 20 years which had a cooling effect on global temperatures. It's not unusual or unprecedented for surface temperatures to show short term cooling during a long term warming trend.

So we have a clear line of evidence. Our CO2 emissions far outstrip the observed rise in CO2 levels. Surface and satellite observations confirm an enhanced greenhouse effect. And ocean heat observations tell us the planet is accumulating heat. Science tells us we need to reduce our CO2 emissions to stop global warming. But like any issue, we'll never come close to resolving it unless we admit there is a problem.

NOTE: There is a more detailed, technical version of this post for the more eggheaded readers. This post was written as part of Blog Action Day.

0 0

Printable Version  |  Link to this page

Comments

1  2  Next

Comments 1 to 50 out of 71:

  1. The only problem with this analysis is that beyond certain levels the carbon dioxide level gets saturated and very little extra warming occurs. Most of the climatologists I've consulted agree with this; it's just a question of at what level warming stops. Many sources seem to agree that 200 ppm sees the most warming; after that, warming declines and eventually becomes minimal. At 400 ppm, we've almost certainly reached the point of effective saturation, which might explain why the planet hasn't warmed in a decade.
    0 0
    Response: I suggest you read through the post again. Two points to look for. One, the CO2 effect is not saturated because we're observing an enhanced greenhouse effect. The logarithmic relationship between CO2 and temperature has been confirmed by empirical observations. Secondly, don't be misled by erroneous arguments like 'global warming stopped in 1998'. The planet is still accumulating heat. Satellite measurements show more energy coming in than escaping back out to space. We have been warming over the last decade.
  2. Paul, saturation has not been reached. See A Saturated Gassy Argument at RealClimate. That link is to Part I, but there is also a Part II.
    0 0
  3. Sorry, I should have listed A Saturated Gassy Argument second. Your first stop, Paul, should be right here at Skeptical Science: Is the CO2 Effect Saturated?. If you need more convincing after that, click on the links in my comment immediately above this one.
    0 0
  4. Whatever energy is radiated into the atmosphere by the surface of the Earth, whether by sea or land, represents a LOSS of energy from the surface. There is no radiative heating of CO2 without cooling of the Earth's surface. Any radiative energy that returns to the Earth from the atmosphere (having originated from the surface), would warm the surface, but at the same time be associated with equal COOLING of the atmosphere. This energy has essentially been reflected or could be considered as if it never left the surface in the first place. In terms of this type of accounting, the energy cannot be in two places at once. It is either on the surface or in the atmosphere. As a result, globally speaking, it does not seem possible for there to be a net positive offset DIRECLTY related to the operation of these radiative mechanisms. However, the portion of energy that is "trapped", due to reflection as described, would seem to accumulate, and cool through either conductive or convective mechanisms. Those which caused the air to warm would now depend ironically on greenhouse gases for expelling this additional energy. For those that may think this explanation is oversimplified, please take a look again at the diagram of the Earth's atmosphere, and remember that you cant get something for nothing, because if you could, we could solve the energy crisis by simply building greenhouses in our backyards. My last thought would also be to consider the temperature on the Moon's lightened surface, which has absolutely no atmosphere at all.
    0 0
  5. RSVP, your comment did the impossible, being at the same time trivial and wrong. For sure you completely lack the concept of energy balance, which is (should be?) indeed trivial. I don't think this blog should be involved in such high school level, or maybe even common sense, discussions or teaching.
    0 0
  6. RSVP, You are having a problem with visualizing how the greenhouse effect works. Energy is not "trapped" by the greenhouse effect, the flow of energy is continuous but slowed in the outward direction. The surface is warmer with a greenhouse effect because it looses energy to space more slowly. The atmosphere is like the lithosphere or crust of the Earth in that the very high heat just several miles below Earth's surface only very, very slowly is allowed to escape the Earth's interior. Just think of how much cooler the Earth's interior or the interior of the Sun would be if the overlying matter were not opaque to outgoing radiation.
    0 0
  7. "Whatever energy is radiated into the atmosphere by the surface of the Earth, whether by sea or land, represents a LOSS of energy from the surface. There is no radiative heating of CO2 without cooling of the Earth's surface." I suppose this could make sense if there was no sun adding to the mix, but otherwise this sounds like me saying my stove top surface actually cools because it's loosing energy as it radiates heat.
    0 0
  8. John, Yet another outstanding post. I will also be referring to the Wang 2009 article on my site. I have been using you as a source more and more frequently. BTW, I hope you do not mind but I have referred readers over at WUWT to your site quite a bit lately. :) You are doing a tremendous service to the general public!
    0 0
  9. RSVP Your questions seem to go to basic climate physics, electromagnetic radiation, light - energy, blackbody radiation, and greenhouse gas IR absorption - emission. I suggest that you read David Archer's excellent book, Global Warming - Understanding the Forecast to get a solid grounding in climate physics. The book is actually a text used at the University of Chicago for non-science majors. It is very readable and will help you understand what climate models do. Since Archer presents the subject in a systematic way, it will be easier to understand than a series of Q&As from a number of Skeptical Science readers. In addition to the book, Archer provides videos of his U of Chicago lectures and access to 8 on-line models. I've posted about Archer's book at this link.
    0 0
  10. Good post. Skeptics might counter with "ok, so humans cause some global warming, but not very much". A next logical progression is to discuss climate feedbacks and why the net feedback is almost certainly positive.
    0 0
    Response: Funny you should mention that, the next post on climate sensitivity is on that very subject.
  11. "Whatever energy is radiated into the atmosphere by the surface of the Earth, whether by sea or land, represents a LOSS of energy from the surface. There is no radiative heating of CO2 without cooling of the Earth's surface." I suppose this could make sense if there was no sun adding to the mix, but otherwise this sounds like me saying my stove top surface actually cools because it's loosing energy as it radiates heat.
    0 0
  12. WeatherRusty I used the word "trapped" as does the article. Thumb Heating and cooling mechanisms have nothing to do with whether something is subjectively perceive as being "hot" or "cold". Your CPU's heatsink might feel hot while it is actually cooling your CPU. On the other hand, a thing may be "cooling" or "heating" if the temperature is dropping or raising, but that is a different idea. Riccardo It is not clear where the line needs to be drawn for a website tuned to "Examining the science of global warming skepticism". If something is "wrong" or "trivial", please be more specific. ------------------------------------------------- In general, what I have noticed in all posts is that no one is able to think for themselves. The validity of any assertion must be backed by an article, google, etc. I remember this mentality from the schoolyard (i.e., if I didnt see it on TV, it cant be real, etc.) And more accutely is the sense that anything that appears to stray from "the consensus" is labeled as "political". Ironically, if there was perfect consensus there would be no need for further discussion, however as there is no consenus in reality, the entire discussion is nothing but political, and as such hypocritical.
    0 0
  13. RSVP writes: "In general, what I have noticed in all posts is that no one is able to think for themselves. The validity of any assertion must be backed by an article, google, etc." The problem is that almost every sentence you post here is wrong. It's abundantly clear that you just don't understand even the most basic science involved. People are thus posting links to answers or explanations because they hope you will read them and learn something. It's not a blind appeal to authority by people who are "unable to think for themselves". It's an effort to help you learn something by people who are disinclined to explain the same utterly basic things over and over again when there are handy and informative explanations already written.
    0 0
  14. RSVP, If I read your post #4 correctly, you seem to be implying that the greenhouse effect violates the laws of thermodynamics. In your summation you said: "remember that you cant get something for nothing, because if you could, we could solve the energy crisis by simply building greenhouses in our backyards." I believe you think this way because you regard the energy emanating from the Earth's atmosphere to be the primary source. The Sun is the primary source. The flow of energy is a two way street, a net warming on average during daylight hours and a cooling at night. However, the cooling loss of energy is also occurring during the daylight hours, it is ongoing day and night. And nothing is "trapped"..bad choice of words in common usage to describing what is happening, leading to all kinds of misconceptions. The greenhouse effect isolates on the cooling aspect of this flow of energy, it does not create additional energy but rather slows down the outward flow on energy and thus the cooling tendency. A surface that cools more slowly will end up being a warmer surface.
    0 0
  15. RSVP, I just was less patient the the other mates here; just read their replies. But to male my point clearer, i'll give you an example of one of your trivial but wrong reasoning. If you take away heat from a body, it will cool; this is the trivial part. But if you apply it to the earth surface and the atmosphere alone it's plain wrong.
    0 0
  16. If you want empiracle evidence of the saturation level of CO2 then look no further than Venus. It has an atmosphere which is over 95% CO2 and surface tempuratures are at 467 degrees celcius hotter than the surface of Mercury. Seems we still have a long way to go before reaching that saturation level.
    0 0
  17. There are two ways you can raise the water level in a lake. You can increase the flow of water from the lake's inlet, or you can decrease the drain of water through the lake's outlet. Likewise, the heat content of the climate system (atmosphere, oceans, and land) is ultimately determined by the balance between energy input (shortwave radiation from the sun) and energy output (longwave radiation from the earth out into space). CO2 in the atmosphere reduces the flux out of the system and increases the heat content of the system. Eventually, a new equilibrium is reached, where the outgoing longwave flux once again matches the incoming shortwave flux, but at a higher level of heat content of the climate system.
    0 0
  18. To me, you don't even really need to quantify the exact impact of CO2 on temperature to believe we will suffer major consequences from rising CO2. If you accept that CO2 has SOME impact on temperature (which even the most ardent skeptics do), the only thing you need to know is that CO2 is already at its highest level in 400,000 years, and probably in 15 million - and it's poised to double. There's simply no conceivable way we can pump that much CO2 into the atmosphere without SOMETHING drastic happening. Here's my Blog Action Day post, via Coby: http://scienceblogs.com/illconsidered/2009/10/blog_action_day.php
    0 0
  19. Both surface temps and ocean heat content vary on annual to multidecdal (to indeed millenial plus) timescales. The Schuckmann paper shows modest warming from 2003 to 2008. However, the result is strongly dependent on the state of ENSO at start and end dates. The ocean is currently a little cooler in the information provided by the NOAA National Oceanographic Data Center (NODC). http://www.nodc.noaa.gov/OC5/3M_HEAT_CONTENT/ There is no strong warming evident in the past 6 years. This is consistent with both the evidence of past multidecadal changes and the expectation of a cooling influence for 20 to 30 years form 1998. There is nothing difficult or controversial in this - climate changes - and sudden climate shifts - occur naturally and obviously. This makes any climate prediction problematic and the 'radiative equilibrium' models utterly nonsensical. http://www.nodc.noaa.gov/OC5/3M_HEAT_CONTENT/ The radiative imbalance is not constant. Until there is a better understanding of natural variations in climate - the attribution of recent warming to AGG is pointless and misguided. The radiative equilibrium model of atmospheric physics is and always has fundamentally flawed - based as it is on a flawed assumption of solar and Earth albedo constancy. http://www.sciencedirect.com/science?_ob=ArticleURL... http://wattsupwiththat.com/2009/08/11/ocean-heat-content-and-earth%E2%80%99s-radiation-imbalance/ Use of the ohc paper by Schuckmann et al to assert continued gloabl warming is misguided.
    0 0
    Response: The Douglass paper you link to looks at the planet's energy imbalance and finds it has increased from the 1970's to present:


    They argue that there's a correlation between energy imbalance and the Pacific Decadal Oscillation. But there is no causation. On the other hand, the causation between CO2 and energy imbalance is proven by multiple lines of empirical observations.

    Note, using Schuckmann to assert an energy imbalance doesn't contradict Douglass's results either - they do exactly the same thing - use ocean heat to find a positive energy imbalance.
  20. I will link also to the International Arctic Research Centre http://icecap.us/images/uploads/RECENT_RESULTS.pdf Continued neglect of the obvious and the evident - is just very, very silly.
    0 0
  21. Robbo the Yobbo, "Continued neglect of the obvious and the evident - is just very, very silly." I completeley agree with you, but you need to modify the claim "This is consistent with both the evidence of past multidecadal changes and the expectation of a cooling influence for 20 to 30 years form 1998" in "This is consistent with both the evidence of past multidecadal changes and an almost linear underlining trend" So yes, it's silly to neglect that decadal variability alone _cannot_ do the job. One last thing: "expectation of a cooling influence for 20 to 30 years form 1998" could you please explain? I've never heard such a claim from a scientist, apart from the blatantly misinterpreted Latif words reported across the web.
    0 0
  22. International Arctic Research Center? What the heck is that now? Is it the name D'Aleo gives his site these days? Seems to imply it's doing real research so I would have expected better than a blog post. On the other hand, looking at Cryosphere Today, we see that the current global sea ice anomaly is about -1.75 million sq km. The last time that there was a positive anomaly of comparable magnitude was late 1988. http://arctic.atmos.uiuc.edu/cryosphere/IMAGES/global.daily.ice.area.withtrend.jpg
    0 0
  23. Thumb, "this sounds like me saying my stove top surface actually cools because it's loosing energy as it radiates heat." That is pretty much a correct observation otherwise you stove would melt pretty soon. If something radiates energy, then it is a cooling phenomena per definition.
    0 0
  24. Douglas and Knox looked at periods of radiative imbalance in the light of the multidecadal ocean/climate states - they say that the radiative imbalance changed again with the climate shift in 2000 to -0.2 W/m2. The best argument for a natural origin of decadal climate shift is the shift in climate after 1999. The difference between Schuckman and Douglas is 1 W/m2. There is obviously no agreement. There is also no agreement of Schuckmann to the OHC data at the National Oceanographic Data Center. The Douglass graph you show stops at the most recent climate shift. You certainly can't have read the paper - or even the blog - to come to the conclusion you have. Abstract Ocean heat content and Earth’s radiation imbalance D.H. Douglass and R, S, Knox Dept. of Physics and Astronomy, University of Rochester, PO Box 270171, Rochester, NY 14627-0171, USA Earth’s radiation imbalance is determined from ocean heat content data and compared with results of direct measurements. Distinct time intervals of alternating positive and negative values are found: 1960–mid-1970s (−0.15), mid-1970s–2000 (+0.15), 2001–present (−0.2 W/m2), and are consistent with prior reports. These climate shifts limit climate predictability. The recent change to a -ve radiative imbalance is certainly in line with observations of Earth albedo since 1999. Google Project Earthshine and look at the most recent additions to the bibliography. The PDO is not the cause of anything - but is in itself one outcome of 20 to 30 year global ocean states. There is a 100 years of science on this in both the Atlantic and Pacific and thousands of papers. Don Easterbrok, Pielke Sn, Bob Carter, Roy Spencer and Stewart Franks – amongst many others - have been discussing this for a decade. How this must rankle. Keenlyside has been talking about multidecadal Atlantic influences on global surface temperature for years. Recently Kyle Swanson and Anastasio Tsonis used a numerical method to analyse for shifts in ocean/climate states. They found what was evident for many years from eyeballing (that is, after all, what they are for)the ocean indices graphs. The mid 1940's, the mid 1970's and 1999/2001 are the most recent climate shifts. At least half of recent warming between 1976 and 1998 was the result of the most recent warm ocean mode. We are now in a cool ocean mode - a cooling influence in the atmosphere and oceans that lasts for 20 to 30 years from the last climate shift around the change of the millenium. The IARC is based at the University of Alaska at Fairbanks. I linked to ICECAP to find a nice summary - but by all means link to the IARC directly and search for decadal changes. http://www.iarc.uaf.edu/ If you look at any Artic temperature reconstruction - you will see very pronounced decadal temperature variation. A peak in the 1940's and a recent peak around 2000. There are some temperature anomalies here for instance - http://icecap.us/images/uploads/RECENT_RESULTS.pdf The satellite sea ice anomalies referred to are not of sufficient record length to capture decadal variability. The satellite record doesn’t give enough information to draw meaningful conclusions at this time. The Arctic should, like the rest of the planet but more strongly, cool over the next couple of decades. ‘Multidecadal fluctuations in the Arctic/North Atlantic climate system should be taken into account when assessing long-term climate change and variability. Understanding the key mechanisms influencing the Arctic/North Atlantic multidecadal variability is essential for developing robust climatic forecasts.’ Schuckmann et al is utter rubbish because they – like most people around the world – have not come up to speed with multidecadal ocean/climate shifts. Mojib Latiff said that asking the uncomfortable questions about climate variation was needed lest the questions be asked by less forgiving people like myself. Simply claiming that Latiff was misrepresented – by a right wing journal such as New Scientist for God’s sake – is very, very silly. Clinging to denial of multidecdal ocean/climate states would be foolishness of monumental proportions. It is not suggested that carbon dioxide is not a greenhouse gas - simply that most of the recent warming between 1976 and 1998 was due to natural climate shifts - and all of the current cooling. Do you have another explanation for current cooling? Didn't think so. Ocean heat content is the best way of monitoring for radiative imbalances - but you have to expect that this is not constant nor linear - and none of the researchers - as Susan Wijfells said last month - agree with each other as yet. Obviusly - more development in methods is needed.
    0 0
  25. Robbo same old (and boring) skeptic attitude: assume what people think, claiming that people (_all_ indeed) said what you would like them say. Is there anyone denying the very existence of variability? I bet no. But you insist just to give yourself the right to say that my claim was foolish, and of monumental proportions ... There's no point at all to post offtopic on this issue for one more reason, variability do not rule out the background trend but is just suprimposed on it. You should be aware that decadal and multidecadal variability alone cannot explain recent temperature trend, as Latif that you quote continues to repeat over and over ... On the contrary, even a simple linear trend added to ENSO-PDO effect (plus volcanoes eventually) accounts for most, almost all indeed, of the temperature record including variability.
    0 0
  26. Riccardo Investing 15 seconds on a Google search, I found these two links among others http://www.scotese.com/climate.htm http://math.ucr.edu/home/baez/temperature/ both contain graphs that I assume are based on some science, showing that the planet's temperature has "forever" been changing with excursions of about 15 C peak to peak. If anyone wants to make a meaningful statement about man-made global warming, I would think as a minimum requirement that they would need contrast statistically the observed modern trends with this data and clarify how these are dissociated. This issue aside, given all the controversy, it would appear that a definion of "global warming" is wanting, given an understanding that theoretically, all human physical activities add some heat to the planet. Where do you draw the line in terms what is acceptable and inacceptable? I suspect that circular logic is at play here, since the implicit definition indicates that heat generated by greenhouse gases is inacceptable.
    0 0
  27. The problem I see with this article is that it uses the argument "guilt by association". The conclusion that human release of CO2 causes global warming does not follow from the factual observation that atmospheric CO2 levels and global temperature changes are corresponding in time. The second problem I see is that the OP uses positive confirmation to prove the thesis to be correct. However, Popper has taught use that we can only use falsification if we want to investigate something scientifically, and that we only can assign a certain confidence level to our knowledge, not a definite truth. Therefore, to strengthen the confidence in the thesis one should instead focus on falsifying other explanations not confirming a particular thesis. What gives us confidence in CO2 as being the agent for increase in global temperature? The foundation for claiming CO2 to be the agent is based on computer simulated climate models, but there are no definite empirical evidence or experiment so far that has singles out CO2 as the major agent. On the contrary there are evidence from observational data to support the interpretation that CO2 can not be a causal agent. What we know so far from empirical evidence is that those agent that has been investigated until now has not been good enough candidates to be singled out as The Agent of cause, not even CO2. Therefore one may take a step back and start to look over other things and ask oneself the question what we may have missed so far. And this is being done by the scientific community by investigating alternative explanations, but to ridicule this as "skeptic attitude" is to misinterpret the scientific way of approaching a problem. A "skeptic attitude" is a necessary condition to make progress in scientific understanding. Because it is used to exclude other possible explanation – not to prove an explanation. A scientific methodical oriented mind need always to ask them self the question "What if I am wrong?" Knowing this but still claiming that CO2 is the agent is equal to claim that the computer climate models describes the climate with sufficient parameters – in other word that is to claim that the computer models holds the ultimate Truth in this question. The OP asked if this is arrogant to claim - the reader may judge by them self.
    0 0
    Response: I can only assume that you didn't actually read the article above. I explain in (what I hoped were) easy to understand terms the causal link between more CO2 and an enhanced greenhouse effect (aka warming). I outline the direct measurements that confirm that the enhanced greenhouse effect is actually happening. If you're genuinely interested in learning more about the evidence for CO2 warming, I go into more detail here.

    The whole point of this article is to emphasise that the evidence for CO2 warming is not based on climate models but on definite empirical evidence. Please read the article above then peruse the experimental evidence for CO2 warming (and I recommend following the links to read the actual research papers cited).
  28. RSVP, you should invest much more than 15 seconds in reading after an easy google search. Especially when history is concerned you can't just pass by and come so superficially to unfounded conclusions; read carefully. A couple of quotes from your second link: "With just one more degree Celsius of warming, it'll be hotter than ever in the last million years. In other words, we may be witnessing the end of the whole cycle of ice ages!" We're almost there and in mere century or so. "Of course, 1 Celsius ain't much compared to the 15°-20° Celsius cooling throughout the Cenozoic - but it's happening fast, and and it's not over yet! With all the changes the Earth has experienced over its history, one might think one more change is no big deal. In the long run, yes. But the future of humanity depends crucially on what happens in the "short run": the next millennium or two. If we didn't mess around with the climate, our Earth's climate might remain stable for another thousand years or more. As it is, we're bringing on more sudden changes." And this is the conclusion after 65 milions years of history of earth climate. Finally, you question (Where do you draw the line in terms what is acceptable and inacceptable?) is a very important one for the choices that are to be made. To answer, though, one needs to accept the science in first place. After that it's more a political than scientific issue, a tough one indeed. You have to decide the level of damage people have to suffer and who is going to pay. I would not to be in Copenhagen in December ... :D
    0 0
  29. Riccardo, I dont know what "conclusions" you are referring to, but now that you mention it, the historical data appears to indicate that the Earth's climate is pretty unstable with or without mankind's "help". (Sorry for not being able to point to url for substantiating that thought.)
    0 0
  30. RSVP, i don't know exactly what you mean by "unstable", but i'd probably agree. It's the timescale and the causes that are different. Back to the issue of the analisys of the temperature trend you (and other people too) might be interested in this article due to appear in J. Clim.
    0 0
  31. To the OP: My remark was to draw attention to the fact that it does not follow from the premises, "CO2 is greenhouse gas", etc that "human release CO2 is the causes of temperature changes". The "conclusion" is not a conclusion but a separate statement that need a separate chain of evidence. Those evidence are not presented in the article, nor in the additional references given.
    0 0
    Response: So you will concede that CO2 causes an enhanced greenhouse effect and the planet is accumulating heat? But not that an accumulation of heat causes global temperature to rise?
  32. Re #24 Poor old Robbo….you keep on saying things that are simply untrue, and attempt to “recruit” science that simply doesn’t support your notions. Keenlyside and Latif, who you want to think support your notion of “cooling influence in the atmosphere and oceans that lasts for 20 to 30 years”, in fact predict a particularly large warming of around 0.5 oC in the period 2010-2030; see Figure 4 of: N. S. Keenlyside, M. Latif, J. Jungclaus, L. Kornblueh & E. Roeckner (2008) Advancing decadal-scale climate prediction in the North Atlantic sector Nature 453, 84-88 So you can’t use these scientists in support of a notion to which they have recently published an entirely contrary projection. Why keep restating what you know is a falsehood Robbo? Likewise your notion that Tsonis and Swanson consider that “at least half of recent warming between 1976 and 1998 was the result of the most recent warm ocean mode”, is another untruth, since we can inspect their analysis of the contribution of ocean circulation effects on surface temperature variability, and find that they consider that ocean circulation effects have made only a small contribution to late 20th century warming (likely no more than around 0.1 oC; i.e. nowhere near half), and essentially zero contribution to the overall warming of the 20th century. That’s not really surprising since the ocean circulation cannot “magic up” heat from nowhere..they merely redistribute the heat in the oceans: see Figure 3 of: Swanson KL, Sugihara G, Tsonis AA (2009) Long-term natural variability and 20th century climate change Proc. Natl. Acad. Sci. USA 106, 16120-16123 Your ad hominem at Schuckmann is ignorant; it's based on a misunderstanding of heat uptake, ocean currents and surface temperature measures. One can have relatively constant heat uptake into the ocean under a radiative imbalance, while having cyclic or stochastic ocean circulation effects on surface temperatures. Schuckmann et al is completely compatible with independent measures of radiative imbalance and other consequences in the natural world. Incidentally, for those like Robbo who might consider that “claiming that Latiff (sic) was misrepresented …is very, very silly”, the following video in which we can hear Dr. Latif’s words as he speaks them indicates rather categorically that pointing out the simple fact that he was (rather amusingly if it wasn’t a serious subject) misrepresented, isn’t “silly” at all: http://www.youtube.com/watch?v=khikoh3sJg8
    0 0
  33. Chris Schuckmann calculated heat content to 2000m. Heat content at lower levels might become important at some time. However, there is no possibility of comparison with other methodologies. Everyone else is finding no to minimal warming to 700m - although even then they are not consistent with each other. Should the planet be warming - Here is Kyle Swanson quoted verbatim from at real climate - http://www.realclimate.org/index.php/archives/2009/07/warminginterrupted-much-ado-about-natural-variability/ 'What’s our perspective on how the climate will behave in the near future? The HadCRUT3 global mean temperature to the right shows the post-1980 warming, along with the “plateau” in global mean temperature post-1998. Also shown is a linear trend using temperatures over the period 1979-1997 (no cherry picking here; pick any trend that doesn’t include the period 1998-2008). We hypothesize that the established pre-1998 trend is the true forced warming signal, and that the climate system effectively overshot this signal in response to the 1997/98 El Niño. This overshoot is in the process of radiatively dissipating, and the climate will return to its earlier defined, greenhouse gas-forced warming signal. If this hypothesis is correct, the era of consistent record-breaking global mean temperatures will not resume until roughly 2020.' Unless Swanson has changed his mind in the past 6 months - the underlying forced rate of warming is less than half of the total 1976 to 1998 warming. Take climate shifts out of the record and warming due to greehouse gases is less than 1/2 of warming between 1976 and 1998. Radiative imbalance is not constant nor linear. I have referred you to Project Earthshine before - again - there is a decrease in shortwave radiation between 1999 and 2008 of 2W/m2. There is no magic but the heat budget of the planet changes on decadal timescales. Latiff said that the difficult questions about multidecadal variability should be asked. The rest of the video confuses interannual with multidecadal variation. Typical clutching at straws.
    0 0
  34. Let's make this even clearer for Chris and Riccardo - The climate shifts occured in 1976 to 1977 and 1999 to 2001. The 1998 El Nino was said to be a big climate 'overshoot which is radiatively dissipating.' It is not part of the greenhouse gas signal - but an aspect of what is widely referred to as climate shifts. The causes of climate shifts are hugely speculative - so take any statement with a pinch of salt - but they appear in all sorts of climate records. The greenhouse signal is in the temperature record from 1977 to 1997. This is 1/2 of the total warming between 1976 and 1998. There are many other factors in there as well - black carbon, methane, solar irradiation, tropospheric ozone warming etc. Insistence that AGW is 0.2 degree C/decade is unsustainable.
    0 0
  35. Respond to respond in Post #31: I am not conceding anything, I am merely reacting to the, for me, obvious fact that the OP are using positive confirmation to led something in evidence and furthermore has failed to show that hypothesis of the form "IF humans release CO2 THEN there exists no global warming" are false. In this I assume the OP is aware of that condition not only must be sufficient but also necessary.
    0 0
  36. Robbo: "The Arctic should, like the rest of the planet but more strongly, cool over the next couple of decades." It's fun to watch you on the various threads claim something and then get caught by Chris in a fib and then have to step backward. But don't step back on your claim that I've quoted above. I want to bet you on it, and I'll give you good odds.
    0 0
  37. G'day Steve, My exact position is no warming for 20 to 30 years from 1998. There is no substantive difference between the Swanson quote above and this statement. Indeed it is consistent as well with the Keenlyside et al study in which Latif participated. Not sure what the problem is with the concept of shifts in ocean/climate states – all I get responses with nil substance to the effect that – nah – it just ain’t so. Yet these shifts are evident in the 100 year plus records of surface and ocean temperature and in hydrological regimes. Temperature variation in the Arctic shows an exaggerated response to variation in global temperature – strong decadal variation is apparent in any of the surface temperature records – and I linked to the IARC at Fairbanks Alaska for support. This is also interesting – there were shifts in temperature in Alaska of 3.1 degrees centigrade as a result of the 1976 climate shift. Hartmann, B., and Wendler, G. 2005: The Significance of the 1976 Pacific Climate Shift in the Climatology of Alaska. J. Climate, 18, 4824–4839. ‘The influence of the shift in Pacific Ocean variability on temperature is more pronounced in the continental regions of Alaska (south-central, interior, and west) than in the maritime regions (southwest and southeast). The Arctic, while it showed some response, is most likely governed more by Arctic variation (i.e., the Arctic Oscillation), and the interplay of Pacific and Arctic circulation variation and its effect upon Alaska is a possible subject for further study.’ The Arctic Oscillation is another example of multidecadal variability – albeit with a familiar periodicity – positive since the mid 1970’s and peaking in the late 1990’s. I am quite willing to revise my views if 100 years of ocean and hydrological science is suddenly reversed. But see no reason to do so while the world is currently not warming. Cheers Robert
    0 0
  38. Robbo, the concept of climate shift by itself is speculative. You should note the words used by Swanson, "We hypothesize" and "If this hypothesis". So you should not take climate shifts as given. But even if it will prove to be true, the overshoot is identified in 1998. Before that the trend was roughly 0.2 °C/decade while the full trend up to 2008 is 0.15 °C/decade. Is this you're claiming? And is this that eventually disprove agw or the effect of CO2 forcing? And what about this shifts that produce an overall upward trend and not simply ups and downs averaging to zero in the long run? What is responsible for this? Could it be that this shifts just modulates the average upward trend, as Swanson indeed suggested?
    0 0
  39. Riccardo, The idea of climate shifts is not speculative at all. What Swanson and Tsonis did was use a (undefined) numerical scheme involving long term records of global ocean and atmospheric indices to identify historical climate shifts. They did this instead of eyeballing them in from the graphs. These ocean/climate state shifts occurred in the mid 1940's, the mid 1970's and around the turn of the millennium. Other people have for decades been wondering what happened in 1976 to 1977 in the Pacific Ocean - the ‘Great Pacific Climate Shift' – and whether this was natural or not. That it seems to have turned around again strongly suggests a natural component. There are also decadal changes at the poles and in the Atlantic. I don't think Swanson and Tsonis add much to the science - but they are useful in providing another perspective - and one that even passes the realclimate test. I don't think those guys have more than a passing acquaintance with empirical oceanographic and hydrological science. As a proposed causal mechanism - Swanson and Tsonis posit a synchronous chaotic dynamic ocean system – i.e the states in the global ocean synchronise, have a hissy fit and shift into an alternate state. A mechanistic interpretation. I simply don’t think it’s so but is externally forced by radiative changes associated with variation in Earth albedo. What Swanson and Tsonis 'hypothesised' was: 1. that the trend between 1979 to 1997 was the residual warming trend when climate shifts are excluded - if you look at the trend line at the Swanson real climate blog - it is about 0.1 degrees C/decade; 2. that the current cool mode ocean/climate state could persist for 2 to 3 decades – as they have in the past. Swanson and realclimate characterise this as ‘warming interrupted’ – I think this depends on whether the ACRIM-PMOD or ACRIM-TSI trend for recent total solar irradiance is the more correct result. Regardless, the residual surface warming trend identified (0.1 degree C/decade) for recent warming is about correct - regardless of wehether this results from internal heat transfer between the ocean and atmosphere or is externally forced. If internal - the oceans should continue to warm in the current cool SST mode and the atmosphere cool. If external - the oceans should cool as well. As I say - I think the balance of probability favours external forcing. I have never intended to prove that carbon dioxide is not a greenhouse gas. The idea is that the climate states alternately augment and mask AGW as you suggest. But you cannot look at most recent augmented mode and conclude reasonably that all of the warming in the relevant period is AGW. The climate shift in the Pacific results not only in a cool and warm mode PDO’s – but in Pacific wide changes involving modulation of the frequency and intensity of ENSO events. A cool mode, such as we are now experiencing, has fewer and less intense EL Niño and more frequent and intense La Niña – statistically and hydrologically speaking. The Australian hydrological connection is best characterised in work by Stewart Franks but there are also global hydrological teleconnections of course. The idea of Ocean/climate state shifts has developed in the past decade – but they are based on long term empirical research and provide a reasonable working hypothesis for the lack of surface warming in the past decade. Cheers Robert
    0 0
  40. Riccardo I downloaded and perused the pdf from link... I have to give you credit for providing this reference as matching my earlier remarks. If I understand the report correctly, they are filtering spurious data such as that produced by volcanic eruptions and coming up with temperature profiles of the Earth or regions of the Earth and somehow dissociating human induced climate change. I suppose if you are looking for something you will find it, and if not, keep mounting the voodoo until you do.
    0 0
  41. [ Response: Funny you should mention that, the next post is on that very subject. ] I suppose that the next logical step before discussing feedbacks would be where the approx. 1 C of direct forcing from a doubling of CO2 comes from, although this tends to have much less dispute among already small contrarian circles.
    0 0
  42. RSVP, first of all a quote from Swanson post in realclimate: "Electricity and magnetism are those forces of nature by which people who know nothing about electricity and magnetism can explain everything. Substitute the words “modes of natural climate variability” for “electricity and magnetism,” and well…, hopefully the point is made." That is to say that there are several patterns of roughly decadal climate variability of which we know very little. Their study is in its infancy and very interesting. But one thing can be said, in the long run they average out. Having said this, the shift apparently occured in the '70. If you fit a straight line from 1970 to 1997 you can easily see it nicely fits the last decade too. What Swanson shows is just an illustrative example. As for Thompson paper, they pull out the effect of known varibility (nothing spurious) and see what is left. And yes, as all the scientists do they were looking for something, the temperature trend cleaned up of the known variability. But the good news is that did it using no GCM, filtering, strange smoothing techniques, etc.
    0 0
  43. The 0.1 C/decade trend fits any period since the 1800's other than 1976 to 1998. Thompson et al reach the same conclusion on the underlying trend ~0.1 K/decade from 1950. Ilustrative example???? Magnetism???? There is no point of any significance.
    0 0
  44. Robbo (or Robert, if you prefer), re: #37. I note you've taken another step back from the Arctic cooling to a greater extent than the rest of the planet to, now, "My exact position is no warming for 20-30 years from 1998". Uhuh. Why not be more exact right away? I'm going to need you to be more exact if we're to find a bet, but for the purposes of discussion... See here: http://www.arctic.noaa.gov/reportcard/atmosphere.html Sorry for the low resolution Figure A1, but it looks like all years to 2007 (except maybe one) from 1998 have higher Arctic surface air temperatures than 1998. Hmmm. Maybe you define "Arctic" differently, or maybe you define "warming" differently than I do. Perhaps you think that the 10 years since 1998 are just noise. (But if so, then why pick 1998 rather than an average of a range of years?). Or maybe you'd prefer to look at sea ice extent instead of surface air temperatures -- oops, that doesn't support your assertion of cooling (er, not warming) from 1998, either. Well, you can see why your claim doesn't make much sense to me. But if you think that Arctic air temperatures or sea ice will show no evidence of warming relative to 1998, then please put up some money. My wife wants to renovate our apartment. Oh, also note Figure A5 in the above url and read the description: the early 1990s had strongly positive AO. This is incongruent with your claim that it was positive in the late 1970s and peaked in the late 1990s.
    0 0
  45. Riccardo, Since you mentioned electricity, I cant help comparing the idea of greenhouse gas heat capture to a circuit analog. A very simple RC circuit with a pulsed voltage source. That is, a resistor (representing CO2) in parallel with a capacitor (Earth). The voltage, a rounded square wave whose voltage changes on each pulse. The voltage would represent the heat left on the Earth in course of a day. Pulse off means night. Anyway, the output voltage would tend to zero during the off part of the pulse, but if R is too big, the voltage would not reach zero before the next pulse (sunrise). If you simulated Winter as many low voltage pulses, and Summer as many pulses with a higher voltage, you would see periods in which the output voltage would rise as heat is supposedly accumulating on the Earth. The point is to illustrate that just because the extra CO2 heat trapping vector has been added to "the GW mix", it does not necessarily mean that the overall heat of the Earth has to increase. Referring to the circuit model, the condition for this to occur requires that the voltage never gets to zero during the entire year (365 pulses later). In this analog, the values of R and C are critical. In the same way, the concentration of CO2 would also be critical to affect global warming, but up till now the only thing I have heard is that "more" is simply enough to raise the Earths temperature because it is causing an imbalance, when instead there might actually be a real critical value to trigger the real thing.
    0 0
  46. RSVP, "Ilustrative example???? Magnetism???? There is no point of any significance." What you do not understand or is poorly explained does not mean it has no significance. First, the electricity and magnetism analogy was not about global warming itself; read the original post on real climate to better understand. Second, i explained why it was an illustrative example. The shift is in 1970 but the fit in the figure starts in 1950; this was clearly done intentionally to amplificate the divergence between the fit and the data in the last decade. Again, look at the post on realclimate and try a fit yourself. The RC analogy is a good one. Although "it does not necessarily mean that the overall heat of the Earth has to increase", this is exactly what is being obeserved. If for example less heat is irradiated to space at night due to CO2 (increase of the RC constant), it certainly will warm. I'll say it explicitly one more time. Nowhere in the AGW theory it is excluded the very existence of fluctuation (more or less or not at all periodic). But they cancel out in the long run leaving a clear, detectable, measurable etc. upward trend.
    0 0
  47. amplificate=amplify :P
    0 0
  48. Steve, The conclusions depend a great deal on whether you use monthly or annual averages. I always use monthly data because the annual data averages out the interesting peaks. Compare the 2 at Professor Ole Humlum's page. http://www.climate4you.com/ - polar temperature page. So really you are absolutely right about Arctic temperature - but everything needs to be seen in the appropriate context. The difference is a small example of claim and counter claim in a highly polarised debate - or non debate depending on your perspective. Are the differences scientifically meaningful? The answer to that is no. ‘Over most of the past century, the Arctic Oscillation alternated between its positive and negative phases. Starting in the 1970s, however, the oscillation has tended to stay in the positive phase, causing lower than normal arctic air pressure and higher than normal temperatures in much of the United States and northern Eurasia.’ http://nsidc.org/arcticmet/patterns/arctic_oscillation.html Yes I know I said that eyeballing was OK – but you need more context. These are very complex issues - you can’t do a quick Google and cheery pick items that seem to support some sort point or other. But look carefully at your Arctic temperature graph – the peak in the 1940’s is the result of multidecadal modulation of temperature in the Arctic. I am morally constrained from gambling with you on this – I think it is a sucker bet. Cheers Robert
    0 0
  49. Robbo, I'm afraid I've let you waste my time (which I assume is your goal -- otherwise, why not link directly to the page you reference instead of to home pages?). You require monthly data to show that multidecadal cycles are responsible for long term trends? You deem my focus on the higher Arctic temperatures after 2000 (in response to your claim that post-1998 should be cooling) as being cherry picking, but you can go back and pick a couple of (less) warm years around 1940 and pretend those provide the proper context for our discussion of your claim? You fib and misrepresent things but say that you are morally constrained from betting? (Good one!) We haven't discussed odds, yet you're already to call it a sucker bet? (Goodbye.)
    0 0
  50. The OP claims that the if "Humans are raising CO2 levels" and "CO2 traps heat" and "our planet is accumulating heat" then the conclusion "human are causing global warming" must be taken under seriously considerations. The OP proves the premises, and then states the conclusion. But does that mean the conclusion is true? Not necessarily. Why? Because it is also equal true to that the conclusion from "If apples are fruits and there is no air on the moon and Mondays comes after Sunday then the moon is made of cheese" is true as well. That implication, plus an infinite many other implications of the same type, has exactly the same logical structure as the implication the OP has proven to be true. So what is wrong with the conclusion which the OP has present? First of all, the premises is only based on observational fact that are true, therefore the conclusion follow as a necessity but it doesn’t say anything about weather the conclusion is correct or not. Secondly the implication contains hidden assumptions, which turns out to be implications as well, which are assumed to be true – therefore unless this can be shown to be true the conclusion must be regarded as postulated by the OP. The hidden assumed condition is the strong statement "CO2 drive temperature changes". The question to ask is: did or did not the OP address this assumed statement? My answer to that question will be that the OP failed to address this assumed statement. The OP address a weaker a form of the strong statement that can be formulated as "CO2 level follows changes in temperature". The weaker form is very interesting because it makes us able to formulate testable hypothesis of the form "If CO2 level changes then temperature will change accordingly" which under certain condition is the same as the statement "CO2 drive temperature changes" as implication also are causal relation. Formulated this way we realize why the statement "CO2 drive temperature changes" is a much stronger statement than "CO2 level follows changes in temperature", this because the strong statement is in fact a law, while the weaker statement "CO2 level follows changes in temperature" is simply a matter of observing measurements. Now, if we can show this stronger statement, the law, to be true, then it will follow from the evidence that the conclusion ‘humans causes global warming’ according to empirical data (observations) is in fact correct. However the OP never shows this but stop at the weaker statement. Why the OP has decided to exclude the stronger statement from the article remains a mystery to me. But just because the OP has decided to exclude it, the OP is guilty of having jumped to the conclusion that human causes global warming
    0 0

1  2  Next

You need to be logged in to post a comment. Login via the left margin or if you're new, register here.


The Consensus Project Website

THE ESCALATOR

(free to republish)


© Copyright 2024 John Cook
Home | Translations | About Us | Privacy | Contact Us