Global Warming and Cold Winters
Posted on 15 January 2011 by D.Salmons
Guest post by D.Salmons
If you were to look out most windows as of this writing, there is a good chance that you would be presented with an image of winter. All around me, winter has sprung, dumping measurable inches of frozen precipitation and snarling the usual habits of work and school as we struggle to cope with its effects on modern life. And more than a few of you might be asking yourself, "What happened to global warming?"
Well, the effects of global warming are all around us. That harsh winter that we are experiencing, it is not proof that global warming is not happening, but rather serves as proof that it is indeed happening, and even a bit faster than we might like to think. It also shows why the phrase "Climate Change" is a better term to describe the effects of man on his environment.
Vladimir Petoukhov, a climate scientist at the Potsdam Institute for Climate Impact Research, has recently completed a study on the effect of climate change on winter. According to Petoukhov,
These anomalies could triple the probability of cold winter extremes in Europe and northern Asia. Recent severe winters like last year's or the one of 2005-06 do not conflict with the global warming picture, but rather supplement it.But how does a colder winter support the idea of a warming earth? It's really simple when you look at the evidence.
Radiative Force Creates Warming
If we look at the Nasa Map above, it shows that the Arctic has been heating up, and studies show that is happening at two to three times the global average. This rising temperature in the Arctic has served to reduce the region's floating ice layer by more than 20%. And as you would expect, when the reflective ice and snow layer is stripped away, it leaves a dark blue sea.
Now, what does the effect of the dark blue sea being exposed have on the Arctic area? Well, the ice and snow layer reflects the majority of the sun's rays harmlessly back into space. But the dark blue of the exposed sea absorbs the rays, aiding the heating process.
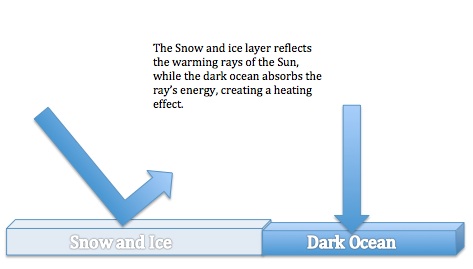
In short, as the ice shelf shrinks, the Arctic region becomes a better collector of the Sun's energy, speeding up the warming effect and creating an even wider solar collector from the exposed sea. It should be easy to see how the process accelerates itself.
Global Pressure creates Arctic Corridor
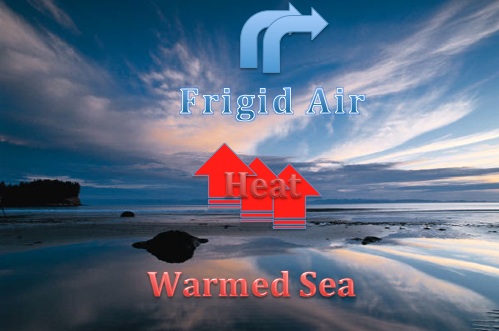
As the ocean gets warmer from the radiative force of the Sun's rays, it is in marked contrast with the polar air above it. The heat from the warmed ocean flows upward into the polar air, creating a high pressure system.
This high pressure forces the polar air to move, and soon we have a clockwise swirl that pushes frigid air downwards into Europe and across the globe.

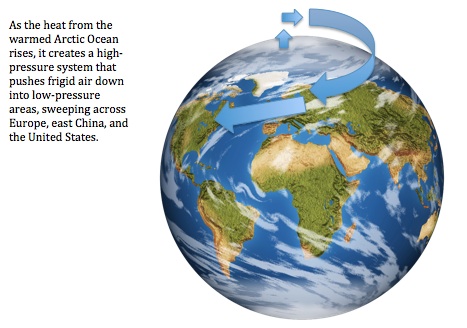
This newly formed "Arctic Corridor" pushes the frigid air from Europe into Eastern China and the Americas, dropping temperatures and making winter conditions more extreme than usual.
Records Support The Model
Record keeping by NASA and other institutes support the model of the artic corridor. If we look at the NASA's temperature graph by latitude, the temperature shift becomes much more pronounced as you approach the 90-degree mark. The effect, sometimes referred to in the Arctic Dipole Anomaly, explains the shift in weather patterns from established normals.
If the recent past is any indication, we can expect to see more wildly varied weather patterns and temperature shifts. In fact, we can look at the current weather season to see this shift in place. As we huddle in our abodes to avoid the effects of winter, consider that Greenland had temperatures above zero in December. Climate Change may be a very mild description indeed of what is happening to Planet Earth.
Author's bio: D. Salmons is a freelance writer and social media consultant for several companies, ranging from individuals to Fortune 500. She is a bit of a geek and enjoys writing about consumer electronics at Test Freak, a website that collects product information and reviews for the best GPS and other tech gadgets.

Arguments


The graphics make the topic understandable for most lay people as well.
Under "Global Pressure creates Arctic Corridor", isn't upward flowing air over a warm ocean a low pressure regime, rather than a high pressure regime?
I think this states a bit too much confidence though; The Honda et al paper from 2009 shows a good physical basis but it's also possible that there will be other ways to handle the high pressure and perhaps we won't see cold winters. Someone in my department found a link between low solar activity and cold European winters and perhaps that is the largest contributor...
...or we've just been unlucky recently!
On the other hand, it has been record heat in Greenland and much of Canada.
Similarly, the winter storms of late were under the influence of a counterclockwise flowing, north-south looping jet stream, as shown here for N Amer and below for the NH. Your globe makes it look clockwise.
--from the Jet Stream archives at SFSU GeoSciences/Meteorology
New Englanders call these winter storms nor'easters, as the low pressure loops over the Atlantic and wind comes from the northeast.
Very useful and a pretty funny.
http://www.youtube.com/watch?v=5nJuAslQPaY&feature=sub
By the outlines of the land masses in the 'Nasa Map' above it seems like a Mercator projection is used. This vastly exaggerates the area of the high latitudes.
The ominous dark red areas above the arctic circle (66.5N) in fact occupy about 4.5% of the Earth's surface, with the Arctic above 60N about 7% of the Earth's surface.
It would be interesting to see a map of recent large winter snow areas at lower latitudes to compare these areas with the Arctic.
The snow reflection effect would also seem larger at lower latitudes where there is higher incident solar radiation to reflect.
2010/2011 was off a cold start with December being the coldest in 40 years thanks to an exceptional negative NAO. January is already much warmer then usual, but it's ofcourse too early to tell if it will remain that way. I would not be amazed if turns out to be just a climatic winter afterall.
Perhaps you prefer the ominous dark red polar views?
Do you have a reference for the Petoukhov study?
When I put 'arctic dipole Petoukhov' into the Web of Science search engine I get nothing, 'arctic Petoukhov' is no better.
" I would not be amazed if turns out to be just a climatic winter afterall."
Which also wouldn't be inconsistent with climate change I guess.
See also here.
Try author: "Petoukhov V*"
address: "Potsdam"
and the paper referred to in the top article will pop up at the head of the list of papers by Petoukov:
Title: A link between reduced Barents-Kara sea ice and cold winter extremes over northern continents
Author(s): Petoukhov V, Semenov VA
Source: JOURNAL OF GEOPHYSICAL RESEARCH-ATMOSPHERES Volume: 115 Article Number: D21111 Published: NOV 5 2010
There is a fairly simple but incomplete test of the theory above which is that the polar warming effect will be stronger in December than later in the winter (e.g. February) since the ice fills in and warming effect ceases. Last year the AO became the most negative on record in February http://www.cpc.ncep.noaa.gov/products/precip/CWlink/daily_ao_index/monthly.ao.index.b50.current.ascii.table I personally believe the theory above is somewhat plausible as long as AO is negative from its other causes, and we will see a trend in negative AO enhancement in December (as is starting to show up in the table).
http://www.ncdc.noaa.gov/sotc/global/2010/13
mentions the negative Arctic Oscillation as one of the major events of the 2010 winter.
About the diagram "Records Support the Model": there is a very long link for it (not given) but does anyone know the site from which it can be found? Presumably a NASA site with a link to the diagram and an explanation.
C Eriksson - 2007
I was particularly taken by the description of MP7 (1707–50) (p5530) in respect to figure 12 (p5328).
".....showing that the warmest documented decade, apart
from the 1990s, was interrupted by the extraordinary
cold winter of 1740."
".....show that the major features of the “normal” pressure
maps (i.e., the Iceland low and the Azores high)
were much weaker. The dominant feature was instead a
continental or Scandinavian high, whose exact position
determined the coldness of each winter."
Somebody with more knowledge will have to tell us whether this matches the description of highs from the arctic dipole causing cold winters in the present warm period as described here.
What drives AO from positive to negative? Both Dec 2009 and 2010 had "strongly negative AO" per NSIDC news (cited below); both had anomalously low sea ice extents. In the model presented here, it is the heat first absorbed then released by an extended season of open Arctic sea that is the cause.
See NSIDC News for Jan 5, 2011:
The warm temperatures in December came from two sources: unfrozen areas of the ocean continued to release heat to the atmosphere, and an unusual circulation pattern brought warm air into the Arctic from the south. Although the air temperatures were still below freezing on average, the additional ocean and atmospheric heat slowed ice growth.
This was shown by Serreze et al 2009, in what we've loosely been calling Arctic Amplification:
Arctic amplification is largely driven by loss of the sea ice cover, allowing for strong heat transfers from the ocean to the atmosphere. ... Ice formation in autumn and winter, important for insulating the warm ocean from the cooling atmosphere, is delayed. This promotes enhanced upward heat fluxes, seen as strong warming at the surface and in the lower troposphere.
It seems tempting to point to a single effect: 'its negative AO' or 'its el Nino' or 'its la Nina' and leave it at that. But that thinking doesn't go far enough -- these are symptoms that must have causes; we need to be able to connect those dots.
Thanks
The winters of the mid 1930's through the mid 1940's in the US were much colder in the upper midwest region than present.
This would support the observation that a lower ice pack in the Arctic portends a colder winter season in the mid USA.
Regional observation, I know, but similiar to todays winter.
A link to heat and cold for the USA.
http://en.wikipedia.org/wiki/1936_North_American_heat_wave
http://en.wikipedia.org/wiki/1936_North_American_cold_wave
Climatic Change
Volume 101, Numbers 1-2, 257-280, DOI: 10.1007/s10584-009-9732-x
Atmospheric circulation and storminess derived from Royal Navy logbooks: 1685 to 1750
"Thus the log book-based daily set of observations supports the interpretations offered elsewhere (Kington 1995, 1997, 1999; Wanner et al. 1994, 1995) from documentary sources, that the closing years of the LIA witnessed abundant outbreaks of polar continental air across Western Europe"
There are obviously natural causes for this phenomenon as well.
The flip side is the recent suggestion that planetary waves are enhanced by Arctic warmth in particular local areas (e.g. NE Canada). That explanation was used for European cooling but could also allow temporary but significant polar stratospheric warming or at least high contrast.
My Grandmother remembered this one well.
A link to those of us who live in the upper MidWest of the USA consider normal:
http://climate.umn.edu/doc/historical/winter_storms.htm
Once again, regional, but the current winter is certainly not out of the ordinary in this area.
This statement is egregiously in error and does not reveal an understanding of meteorology.
http://www.sciencemag.org/content/294/5549/2130.abstract
http://www.sciencemag.org/content/294/5549/2149.abstract
There is a fly in what is otherwise a superb soup. That opening line unknowingly reinforces the solipsistic concept that what is going in our backyards or outside of our windows is a measure of reality.
Is it really "most windows" on Earth that this spectacle is visible from; especially in the November Anomaly image?
I would rephrase the perceptual bias in terms of media coverage versus global occurences. I would do so in a way that tells the reader in the first paragraph that what he sees outside of his window is a very limited portion of what's going on.
I would also delete the second paragraph's mention of phraseology as well as any mention of proof until the anomaly image is presented.
A better introduction would be:
If you were to look at your television as of this writing you would be presented with an image of a cold winter. More than a few of you might be asking yourself, "What happened to global warming?"
Would it surprise you to know that only 15%(?) of the Earth has experienced cooler than average temperatures while the other 90% was warmer than average? Greenland, most of the Arctic and east Siberia were up to 10C warmer than average.
This La Nina is unusually strong.
My point is look at all of the observation.
I do not understood how a polar blocking mechanism can explain what is observed. A polar blocking mechanism cannot cause a strong La Nina.
I agree with Camburn's comment. Solar cycle 24 is unusual. It should be considered as possible explanation.
If you are really interested in attribution, Gavin Smith's RC article On attribution is a very good one.
The article
Abstract:
We examine the climate response to solar irradiance changes between the late 17th-century Maunder Minimum and the late 18th century. Global average temperature changes are small (about 0.3° to 0.4°C) in both a climate model and empirical reconstructions. However, regional temperature changes are quite large. In the model, these occur primarily through a forced shift toward the low index state of the Arctic Oscillation/North Atlantic Oscillation as solar irradiance decreases. This leads to colder temperatures over the Northern Hemisphere continents, especially in winter (1° to 2°C), in agreement with historical records and proxy data for surface temperatures.
Science 7 December 2001:
Vol. 294 no. 5549 pp. 2149-2152
10.1126/science.1064363
and a few citations:
Both paleoclimate reconstructions and the GCM thus indicate in a remarkably consistent manner that solar forcing affects regional scales much more strongly than global or hemispheric scales through forcing of the AO/NAO.
and conclusion
These results provide evidence that relatively small solar forcing may play a significant role in century-scale NH winter climate change. This suggests that colder winter temperatures over the NH continents during portions of the 15th through the 17th centuries (sometimes called the Little Ice Age) and warmer temperatures during the 12th through 14th centuries (the putative Medieval Warm Period) may have been influenced by long-term solar variations.
Just wondering if we could get a look at where your observations are coming from:
-it's not anomalously warmer in the Arctic?
-low ice extent due to late freezing in only Hudson's Bay?
-Arctic ice thickness doubled?
If you have sources for these, please post them.
Camburn, oh Camburn:
The article you cite in #30 is from 2001, entitled Solar Forcing of Regional Climate Change During the Maunder Minimum, says nothing about either 'current happenings' or AGW.
After the December snows in Ireland and the UK, January has crept up to average, and now there is a definite hint of early spring as we enter its second half. Green is starting to show through fields that were a pale, wasted yellow a week ago.
The point is that the "coldest winter for 1,000 years" has turned into a pussycat. Well, ok, it is too soon to say, but the signs are good. Feb 1st (2 weeks away) is the first day of the Celtic Spring.
I know there are global warming theories that "explain" the weather phenomenon - but there are alternative theories also. There are the solar minimum theories, and there is natural variability. There is also solar minimum, natural variabiity and global warming all acting together.
While there may be more than one plausible explanation, we need a scientific evaluation ... and that is not quick and simple. Here is an article from today's Irish Times that tries make sense of it, by a UCD Professor of Meteorology.
Icy Winter
Conclusions from #30: lower TSI (although not relevant to today) and corresponding drops in SST (also not relevant) caused weather changes resulting in increased planetary wave propagation and polar stratospheric warming, thus negative AO/NAO. Useful part of those conclusions: AO sign is determined by factors that change planetary wave propagation into the Arctic and factors that vary stratospheric temperatures in the Arctic (and both of those effects are linked through some feedback).
AGHG warming cools the stratosphere and increases AO, but that is only a long term, broad effect. That may be offset in the short term by Arctic hot spots that force ripples in the polar jet and corresponding wave penetration, warming stratosphere (probably very uneven warming) and negative AO (cold winters, etc). Natural factors are also at work in both directions. The "solar" link is interesting and I've speculated on other threads about "solar" factors, but solar TSI factor from the paper in #30 is not relevant to today's situation (present TSI change is too small).
No, it is not cold in Europe. Temperatures in most areas well above average with major flooding as the result.
The Arctic above 80 degs is way above average:
http://ocean.dmi.dk/arctic/meant80n.uk.php
Please provide links for your other claims
"It is cold in North America as well as in Europe."
We're having a pineapple express here in OR/WA.
(hint: pineapples don't grow in cold climates)
This bit in the article needs rewriting. Warmed air rising creates a low pressure system. When that air comes back down again it then creates a high pressure system (in a different location).
Solar heating of the Arctic can't happen in winter. There is no sun. If the ocean is naked it gives up heat by convection bypassing the effect of CO2 in removing heat to space.
And once again another good graphic showing that CO2 is not as big a player as imagined.
@7. A good call on the distortion in area due to the projection used to depict a sphere. NASA should use an equal area projection.
Yes, that's the heat that the open ocean absorbed during that time when there wasn't as much ice as there used to be, what's it called? Oh, summer. Warmer water -> warmer air. And that says nothing about 'bypassing' CO2, whatever that means. Apparently there's something about the numbers attached to that ominous red that you're not seeing?
"once again another good graphic showing ... "
Graphic? Showing CO2 not a big player? Must be a verrrry tiny graphic, 'cause I don't see it.
http://theinconvenientskeptic.com/2011/01/snow-extent-for-2010/
and to clarify, i'm looking at trends from 1950 to 2010,
the following links show warming trends
here, here, here and here
the following links show cooling trends
here, here, here and here
the following links show flat trends
here, here, here, here, here and here
Cold caused by warmth is called a negative feedback. It slows down warming a bit more than you might like to think. Those red-hot areas in the Arctic are still well below freezing, therefore it cools any open water that may be there and transfers the heat to outer space as that's the only heat reservoir around which is colder than the currently "hot" Arctic. I guess Dr. Trenberth would miss this heat extracted from the ocean badly. Also, there's not much sunlight in the Arctic winter, but there is some in lower NH latitudes covered by record snow extent. Most of this light is simply reflected back to space without having a chance to get thermalized - another negative feedback.
On top of that this winter is not even particularly unusual, I can remember both much worse and better in the past.
Not all these red hot areas are below freezing. Parts of western greenland (north of the Arctic circle) were well above freezing until just a few weeks ago.
Same for areas in the Barents sea like Bjørnøya, at 75degs latitude thas has been above freezing for extended periods in December. Temps dropped in the first half of January, but are headed above freezing again.
http://www.yr.no/place/Norway/Svalbard/Bjørnøya_radio/
8 day forecast is not very chilly either:
http://www.yr.no/place/Norway/Svalbard/Bjørnøya_radio/long.html
Average temp for January is -8.1C.
Winter is DJF, so its hard to make such a statement without a crystal ball. But if your prediction does prove correct, that would make a very unusual summer with a no-big-deal winter. Where's that new ice age, or the much promised cooling trend that we hear so much about?
Not sure what your point is, but you might look here for a continent-wide warming trend.
"Cold caused by warmth is..."
I'm not a physics major but I know that cold is not caused by warmth. In the case of NAO the warmth is simply relocating the cold.
"Those red-hot areas in the Arctic are still well below freezing, therefore it cools any open water that may be there..."
Water is a thousand times thicker than air therefore it can absorb and release a lot more energy than thin air. Therefore it's the ocean that warms up the air, not the air cooling off those warm waters.
If the ocean water is at 0 Celsius it's going to be transferring heat to the air even if that air is -10C. Temperature is not the same as total energy.
The Yooper