Climate Science Glossary

Term Lookup

Enter a term in the search box to find its definition.

Settings

Use the controls in the far right panel to increase or decrease the number of terms automatically displayed (or to completely turn that feature off).

Term Lookup

Settings


All IPCC definitions taken from Climate Change 2007: The Physical Science Basis. Working Group I Contribution to the Fourth Assessment Report of the Intergovernmental Panel on Climate Change, Annex I, Glossary, pp. 941-954. Cambridge University Press.

Home Arguments Software Resources Comments The Consensus Project Translations About Support

Bluesky Facebook LinkedIn Mastodon MeWe

Twitter YouTube RSS Posts RSS Comments Email Subscribe


Climate's changed before
It's the sun
It's not bad
There is no consensus
It's cooling
Models are unreliable
Temp record is unreliable
Animals and plants can adapt
It hasn't warmed since 1998
Antarctica is gaining ice
View All Arguments...


Username
Password
New? Register here
Forgot your password?

Latest Posts

Archives

High CO2 in the past, Part 2

Posted on 1 November 2009 by John Cook

Earlier this week, we saw that when you combine the effects of solar levels and CO2, you find good agreement with climate. However, there is an obvious objection to this argument. I even began to write an answer to the objection in that post but decided to save it for later. What surprised me was noone spotted it. Perhaps everyone was distracted by the ad hominem attack on Arrhenius while ironically, there was a legitimate scientific objection to be made. But before proceeding, I'll issue a challenge now to the reader. Go back and read CO2 was higher in the past before reading this post. Any skeptic worth his salt should spot what I'm talking about.

For starters, I find an overview of geological time scales helpful. It's not crucial to understanding but I like this stuff so bear with me. No skipping ahead! As geological time scales cover billions of years, geologists like to divide and subdivide Earth history into tinier, manageable parcels. The last 550 million years is known as the Phanazeroic Eon. This is divided into 3 eras - the Paleozoic, Mesozoic and Cenozoic. These eras are then divied up into periods. Examples of periods are the Cambrian, Ordovician and Jurassic. And periods are divided into epochs. We're currently in the Holocene epoch, begun around 11,000 years ago when the last ice age ended.
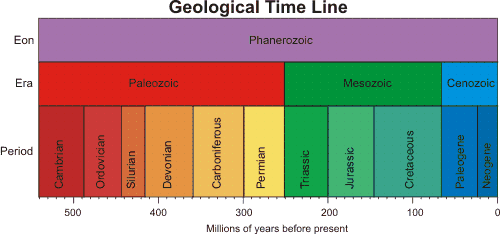
In case you didn't notice, scientists love to categorise, label and plot lots of charts and graphs. I'm not immune to this urge - just this week, I sorted skeptic arguments by taxonomy. But I digress. Royer 2005 takes a broad look at CO2 levels over the entire Phanerozoic Era. When combining the radiative forcing from CO2 and sun combined, he finds good agreement with climate. In Figure 2, the grey shaded areas are glacial periods. Generally, glacial periods coincide with times of low radiative forcing.
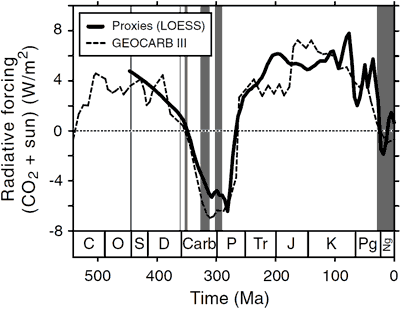

Figure 2: Combined radiative forcing from CO2 and sun through the Phanerozoic. The dark shaded bands correspond to glacial periods (Royer 2005)

However, there is one notable exception. Here is where the sharp eyed skeptic steps up to the plate. Late in the Ordovician period, the Earth experienced glacial conditions at a time of high CO2 levels. Observe the thin grey line around 443 to 445 million years ago. How could glacial conditions occur with such high CO2 values?

Royer 2005 assembled 490 proxy records of CO2 spanning the entire Phanerozoic period. The CO2 data covering the late Ordovician is sparse with one data point in the CO2 proxy record close to this period - it has a value of 5600 ppm. Given that solar output was around 4% lower than current levels, CO2 would need to fall to 3000 ppm to permit glacial conditions. Could CO2 levels have fallen this far? Given the low temporal resolution of the CO2 record, the data is not conclusive.

A newly released paper A major drop in seawater 87Sr/86Sr during the Middle Ordovician (Darriwilian): Links to volcanism and climate? (Young 2009) sheds more light on this question by examining strontium isotopes in the sediment record. Continental weathering removes CO2 from the atmosphere. The process also produces a particular isotope of strontium, washed down to the oceans via rivers. The ratio of strontium isotopes in sediment layers can be used to construct a proxy record of continental weathering activity.

What they found is that around the middle Ordovician, weatherability increased leading to an increased consumption of CO2. However, this was balanced by increased volcanic outgassing which added CO2 to the atmosphere. Around 446 million years ago, volcanic activity dropped while weathering remained high. This caused CO2 levels to fall below 3000 ppm which initiated cooling. What caused the late Ordovician glaciation? It turns out falling CO2 levels was the culprit.

To claim that "higher CO2 in the past disproves CO2 warming" is essentially a straw man argument. If climate scientists were claiming CO2 is the only driver of climate, then yes, high CO2 during glacial periods would be problematic. But any climate scientist will tell you CO2 is not the only driver of climate. When all forcings are considered, a close examination of past periods when CO2 was higher than today in fact confirm the influence of CO2 on climate.

UPDATE 6 Nov 2009: Science magazine have published an introductory summary to Young 2009: The Mountains That Froze the World (published 2 days after my post - I wish it had been 2 days earlier, would've saved me a lot of time!)

0 0

Printable Version  |  Link to this page

Comments

Comments 1 to 36:

  1. Elementary question: why was weathering high after volcanic activity declined? Is it that the new volcanic rock weathers quickly relative to other rock, but slowly enough such that there was plenty of volcanic rock around to weather (remove CO2) long after outgassing from volcanoes had slowed down?
    0 0
  2. I have to say that I don't understand figure 2 at all, nor do I follow the explanation.
    0 0
    Response: As Chris mentions in comment #3, I go into more detail on Figure 2 in the post CO2 has been higher in the past. Read that post, come back here and if there is still confusion, post a comment saying which part you don't understand and I'll try to clarify my language.
  3. Leisureguy, Figure 2: The aim in this figure is to determine the radiative forcing according to a very broad, low resolution understanding of the solar and greenhouse forcings exisiting throughout the last 500 million years. In general, on long time scales the earth surface temperature is a result of the solar output and greenhouse amplification. Variation of either will affect the surface temperature (on shorter timescales volcanic aerosolic forcing, ocean currents etc. will modulate this further). The long term variation in solar output is well understood (the sun is getting steadily "brighter" as time passes; 400-odd million years ago solar insolation was around 4% weaker than now). So if we know broadly what the CO2 concentrations in the deep past, we can determine the net forcing that determines variation in earth temperature on the million of year time scale. The CO2 concentrations have been estimated based on an understanding of weathering, continental positions, major catastrophic tectonic events that release high conscnetrations of CO2 etc. This has been modelled by Berner, and is the dotted line in the figure (labelled GEOCARBIII). It's broadly consistent (on the 10 million year timescale) with the CO2 levels determined by intermittent proxies (see Figure 1 here: http://www.skepticalscience.com/CO2-has-been-higher-in-the-past.html) The point is that low radiative forcing (weak sun; low CO2) results in cold/glacial periods, and we don't expect cold/glacial periods when the net radiative forcing is high (high CO2 even if the solar constant is lowish as in the Ordovician period). Thus the apparent short glacial period in the late Ordovician, 440ish MYA is potentially anomalous at first sight.
    0 0
  4. Quote: "This caused CO2 levels to fall below 3000 ppm which initiated cooling". So the 400 ppm that we are heading to is not a problem? That would solve our problems.So what are we going to do in Copenhagen? Anyway, it looks like we are heading to global cooling (due to an increase in earth's albedo - since 2000)
    0 0
    Response: Don't forget that in the late Ordovician, solar output was about 4 to 5% lower than current levels. So 400 ppm is indeed a problem. There is some argument to be made that 350 ppm is what we should be targeting (of course, that's a political impossibility, just a scientific ideal).

    Also, Earth's albedo has shown little to no trend in recent years.
  5. Your posts indicate an odd unwillingness to engage with fairly straightforward analysis and explanations Henry Pool. The answer to your question about "400 ppm that we are heading to..." is addressed in the top post. Why not read it before firing off! Likewise you've fired off some assertion about "Earth's albedo", without seemingly taken the time to consider this, or even to read the work that you are referring to. The Palle et al work on albedo you refer to is published here: E. Pallé et al (2006) Can Earth's Albedo and Surface Temperatures Increase Together? Eos Trans. AGU, 87(4), doi:10.1029/2006EO040002 and in fact the point of the paper is that an apparent increase in albedo (which is somewhat debatable anyhow), doesn't mean that the earth will cool. One needs to consider the source of the albedo change. In this case it seems to be associated with a cloud effect, and since clouds can also suppress radiative loss of the from the earth surface, an increased albedo from clouds doesn't necessarily mean cooling. So your assertion is based on a non-sequitur. Why not familiarize yourself with the work you use to attempt to make a point, before engaging here. It would save an awful lot of time!
    0 0
  6. Hi Chris: I refer to my posts 127 & 128 & 129 on "How do you know CO2 is causing warming". If you care, I would not mind hearing a few responses there!
    0 0
  7. I thought another of the things that a skeptic might target is the lack of temporal resolution in general. I wonder how much CO2 has changed naturally in the past on a short timescale (over a couple of hundred or 1000 years). This is an inelegant excuse for me to expand on John's digression. I find the taxonomy of skeptic arguments interesting for a couple of reasons. First, relating to what I just wrote, there's only one or two entries for anthropogenic CO2 being insignificant relative to other CO2. I would be curious to know more about periods of rapid CO2 change in the past (or maybe more information about how solidly we know CO2 hasn't changed as quickly as it is currently changing). The other thing I find interesting about the taxonomy is that there are three groups, but "Warming isn't bad" is very unpopulated relative to the others. And another category ("It's too late to stop it") doesn't exist at all. I am curious about the implications for both categories of argument of short- vs long-term contextual information from paleo studies. It seems to me that those skeptical of the need to act should be demanding short term temporal resolution in these and other historical reconstructions.
    0 0
    Response: Be aware that the skeptic arguments sorted by taxonomy is by no means comprehensive. There are probably around 100 skeptic arguments I have yet to add to the list. Time being the issue, I've prioritised them by popularity - next on my to-do list is always the skeptic argument that has been used the most. I also tend to focus on science based arguments - arguments like "people are making money from global warming" or "Al Gore is a hypocrite" add no real value to this website.

    If I get the time, I would like to expand on studies of CO2 in the past as they only serve to confirm the influence CO2 has on climate.
  8. Steve L, concerning time resolution, it should be noted that there are ice cores with annual or sub-annual resolution for the last 100 thousands years (GISP2 and NGRIP ice cores in Greenland). The resolution gets worst going back in time but at least from the onset of the ice ages cycles it stays below a few centuries or less, depending on the specific site. But anyway, the real problem with this skeptic argument is physics. What should be the plausible mechnism for a rapid emission of CO2 of the order of a few decades? And also, to not be detected the CO2 must be reabsorbed by the climate system in a few decades as well, while we know, instead, that it stays in the atmosphere much longer. Here we notice a general attitude of the skeptics, immagine a mechanism which can not be ruled out a priori but that is far from being plausible. The trick is that in this way the burden of the proof stays upon "AGW theorists". It's far easier to immagine a weird hypotesis than prove it's unplausible or plain wrong.
    0 0
  9. Riccardo, agreed -- that is the general approach taken.
    0 0
  10. "350 ppm is what we should be targeting (of course, that's a political impossibility" - if the good guys say this it helps to make it a self-fulfilling prophecy. Since the denialists don't believe any kind of target is necessary, it is incumbent on us to push for the "scientific ideal" which is now even lower than 350, in fact down to 280 or so. That way, if politics is the art of compromise, a compromise between no target and 280ppm might give a result of, say, 400ppm, which we might be able to live with. A compromise between "350 is politically impossible so let's accept, say, 450" and no target is, perhaps, 550ppm or worse which we certainly can't live with.
    0 0
  11. Comment 36 here has information relevant to my comment #7. Perhaps it's a preview to the post John says he may eventually do. I look forward to it!
    0 0
  12. I wonder about the relevance of this sort of analysis based on that sort of timescale. In the first paragraph you mention the last ice age was 11,000years ago. I don't know what that means in terms of mean global temp or change in radiative forcing but I'm going to speculate a noticable shift in terms on the vertical axis of the graph above. And I think we would agree some (I'd say most) of that shift has been due to natural causes. So the end of the carboniferous/start of the permian represents maybe +10million years of low radiative forcing, two periods of glaciation but obviously intermediate periods of non-glaciation. How did the earth come out of those glaciation periods when the radiative forcing remains low? Surely there is some lack of detail in these numbers particularly as you go further back in time. The relative smooth movement of the data early on and the more up/down in recent times suggests that. On a superficial level it tells a nice story but I'm not sure it really details the movement of earths climate over that period.
    0 0
  13. re #12 There's a huge amount that can be pointed out in relation to your comment HumanityRules. Here's a few relevant points: (i)The data in Figure 2 above is an extremely broad scale analysis from a model of atmospheric CO2 based on estimated weathering/continental positions etc with a 10 million year resolution, compared with a massively smoothed proxy record. The aim is to demonstrate at extremely low resolution, the broad change in radiative forcing resulting from a combination of progressively increasing solar constant and very broad range variations in atmospheric CO2. (ii) A realistic analysis of the relationship between atmospheric CO2 levels and climate can only be made by considering discrete proxy temperature and proxy CO2 data, and causal relationships can only be assessed where these temperature and CO2 proxies are contemporaneous. If this is done [see review by Royer (2005) – click on link in John Cook’s summary above ; this should actually be Royer (2006)!), there is a broad correspondence on a much tighter time resolution relevant to greenhouse gas-climate coupling. (iii) This analysis has been extended in recent years, and indicates a number of further examples where contemporaneous temperature proxies and CO2 proxies have been analyzed. In general where CO2 levels are high, temperature proxies are high, and onset of cold/glacial conditions are associated with reduced atmospheric CO2. I’ve dumped a number of more recent papers just below [*]. There is now also a wealth of papers defining the onset of glacial conditions in the Miocene associated with the drop of atmospheric CO2 levels below thresholds that allow build up of polar continental ice sheets. (iv) focussing on the Carboniferous and your specific comment. While it was thought previously that there was a single Carboniferous glaciations/cold period associated with a long slow and rather massive pull down of atmospheric CO2 into plants (and their deposition and eventual burial under conditions where oxidative decay was suppressed), this period seems to be separated into an early glacial period and a later cold period, separated by a warmer spell. Unfortunately there is only one atmospheric CO2 proxy contemporaneous with this warmer spell in between the two cold periods, but this proxy indicates a CO2 level around 1500 ppm. So it seems not only very likely that the cold Carboniferous periods were the result of massive pull down and sequestration of CO2 from the atmosphere, but that the intermediate “non-cold” interval was associated with a period of raised CO2. This is described in Royer’s review (click on John Cook’s link above and see section 3.4). [*] Since Royer’s compilation of proxy CO2 data and Phanerozoic estimates of earth temperature regimes, there has been a large amount of new data which supports a broad coupling of earth temperature and atmospheric CO2 levels: R.E. Came, J.M. Eiler, J. Veizer et al (2007) "Coupling of surface temperatures and atmospheric CO2 concentrations during the Palaeozoic era" Nature 449, 198-202 W. M. Kurschner et al (2008) “The impact of Miocene atmospheric carbon dioxide fluctuations on climate and the evolution of the terrestrial ecosystem” Proc. Natl. Acad. Sci. USA 105, 499-453. D. L. Royer (2008) “Linkages between CO2, climate, and evolution in deep time” Proc. Natl Acad. Sci. USA 105, 407-408 Zachos JC (2008) “An early Cenozoic perspective on greenhouse warming and carbon-cycle dynamics” Nature 451, 279-283. Doney SC et al (2007) “Carbon and climate system coupling on timescales from the Precambrian to the Anthropocene” Ann. Rev. Environ. Resources 32, 31-66. Horton DE et al (2007) “Orbital and CO2 forcing of late Paleozoic continental ice sheets” Geophys. Res. Lett. L19708 (Oct. 11 2007). B. J. Fletcher et al. (2008) “Atmospheric carbon dioxide linked with Mesozoic and early Cenozoic climate change” Nature Geoscience 1, 43-48. etc. etc.
    0 0
  14. There's another interesting study that relates to John Cook's "UPDATE" and Steve's post #1. Here's a summary: (i) Basalts from tectonic activity (volcanic eruptions or flood basalts), are highly weatherable and so are efficient in removing CO2 from the atmosphere (on very long timescales). As indicated in the link in John's "UPDATE", the formation of the Himalayas, as the Indian subcontinent crashed (and still crashes) remorselessly into sub-Asia, isn't considered a factor in the cooling associated with CO2 reduction that gave rise to the first Antarctic continental ice in the early Oligocene about 33 million years ago. The Himalayas are large knappe-based granitic structures and granite doesn't weather efficiently. (ii) Basaltic weathering is efficient in warm, moist environments, and can be considered a sort of “Gaia”-ish means of temperature regulation on the very long timescale. A hot, moist world resulting from high greenhouse gas levels promotes weathering, with a consequent reduction of atmospheric CO2, that generally “outcompetes” the release of CO2 into the atmosphere from volcanoes. In a low CO2, cold, dryish world, weathering is inefficient, and volcanic release of CO2 out-competes weathering-induced “draw-down” of CO2 from the atmosphere, keeping the earth from getting very cold. (iii) A recent paper in PNAS [*] suggests that the maintenance of high CO2 during the Paleo-Eocene was a result of the crunching of the Indian sub-continent into sub-Asia, and the subduction of carbonate-loaded plate above the Thethys sea; the carbonates were converted back into CO2 which was released back into the atmosphere. Around 65 MYA the Deccan Traps were formed by a massive flood basalt event associated with the end-Cretaceous extinctions. (iv) As India squeezed-out the Tethys sea around 50 MYA, the CO2-“factory” came to an end, and was overtaken by enhanced weathering from the Deccan Traps as these moved into the warm, moist tropical humid belt. CO2 withdrawl from weathering began to outcompete tectonic release of CO2 into the atmosphere, and by around 33 MYA CO2 levels had dropped to the threshold for polar continental ice sheet formation… [*] D. V. Kent and G. Muttoni (2008) Equatorial convergence of India and early Cenozoic climate trends PNAS 105:16065-16070 http://www.pnas.org/content/105/42/16065.abstract?sid=4e6a6e83-8034-4eef-b0a2-865623be72e1 I can’t find a downloadable version of Kent and Muttoni (2008). However there is a “Commentary” accompanying their article that summarises their proposal quite nicely: users.unimi.it/paleomag/geo2/Irving2008.pdf
    0 0
  15. #13 thanks for changing the reference, I realized my mistake after posting. i) and ii) Fig 2 is from Royer 2006 it can't be simultaneously "....at extremely low resolution" (from your point i) and "....a much tighter time resolution" (from your point ii) iii) I'll try to look at them when I have time. iv) Its 'attractive' that the author can fit a couple or three ice ages into drips in the graph but there are also a couple of other ice ages there at periods of positive radiative forcing (not shown in the detailed graphs you talk about here) . The grey vertical lines indicating them are conviniently thin enough to be almost missed. and also high CO2 periods associated with cooler times in the more detailed graphs of fig3. Finally the mesozoic period, touched on in Fig3 and represented with "cooler?" periods has been shown by other authors while being generally a warmer period to also contain significant glaciation periods yet again Royer shows consistent positive radiative forcing. Can I add this to your list of papers Greenhouse crises of the past 300 million years Author(s): Retallack GJ Source: GEOLOGICAL SOCIETY OF AMERICA BULLETIN Volume: 121 Issue: 9-10 Pages: 1441-1455 My point would be that in reality a global temperature graph on that time scale would look more like a seismograph during an earth quake than the generally slow drops and rises shown on the radiative forcing graph above. I accept his attempt to get an overall general feel for climate change but think much, if not all, is lost in throwing away the detail.
    0 0
  16. re your points, HumanityRules: (i)& (ii) best to read the paper (click on the link in John Cook’s summary), and be careful in reading posts! Then it's obvious that: a. Figure 2 above from Royer 2006 is an "extremely low resolution" analysis (highly smoothed proxy record and a very coarsely-time resolved model) to assess the broad evolution of forcing from the slow solar constant increase in the light of a highly smoothed CO2 record/model b. the rest of the data in Royer 2006 presents data at "a much tighter time resolution". That's what I said in my post and that's quite obvious from Royer's review. Royer is addressing one point in his Figure 2, and another point in the rest of his article. (iii) good! (iv) That’s not right I think in two respects. First Royer shows the variations in CO2 and temperature/climate regimes throughout the Mesozoic (see Royer’s Figures 3 and 4). That's the relevant data. I don’t think there’s much evidence for significant Mesozoic glaciations, although there is evidence for cool spells in the Mesozoic (generally associated with low CO2 where contemporaneous proxies are available), with some warmer/hot periods associated with higher CO2. According to Retallack (2009) (the paper you cited, and many thanks for that), “The Mesozoic greenhouse was not hot with cool spells (Royer, 2006), but warm with hot flashes”, the hot flashes associated with raised CO2. An essential point though (and one that Retallack addresses) is that one can only make infererences about the relationships between temperature/climate regimes and CO2 levels where there are contemporaneous temp and CO2 proxies. So we should be careful not to assume that if temp (or CO2) was high at some point in time where we have a proxy, and high at some other time, that all the intermediate periods are defined. That’s likely to be wrong. I think in general we agree that the temperature/climate and CO2 records are bound to be spiky. That’s the conclusion to be drawn from the data in Royer 2006 and Retallack 2009. The other conclusion is that generally where there are contemporaneous CO2 and climate/temperature proxies the two are associated (high CO2 warm/low CO2 cold). That’s also the conclusion that Retallack (2009) draws. Here’s the abstract of Retallack, GJ (2009) cited in post #15: http://gsabulletin.gsapubs.org/content/121/9-10/1441.abstract
    0 0
  17. I have a question about the basic CO2 forcing, as I would guess basic forcing may have been relatively more important as compared to the feedbacks at those high CO2 concentrations. As I have understood it, we have, as first order approximations and ignoring interactions, the two basic relations (C1 and C0 initial and final CO2 concentrations, respectively, 5.35 the coefficient used in IPCC AR3) forcing: F = 5.35 * ln(C1/C0) and temperature change: DT = lambda*F where lambda = 0.27 W(Km^-2)^-1. approx Giving about 1.1 degree K per doubling of CO2 as equilibrium effect of pure forcing. Is this the right way to do it? At CO2 concentrations of 5600 ppm, it would produce a (non-feedback) forcing of about 4.3 deg K, compared to recent pre-industrial levels, right? And, if it is, how, then can Roy Spencer write on his website (http://www.drroyspencer.com/global-warming-101/): "Now, you might be surprised to learn that the amount of warming directly caused by the extra CO2 is, by itself, relatively weak. It has been calculated theoretically that, if there are no other changes in the climate system, a doubling of the atmospheric CO2 concentration would cause less than 1 deg C of surface warming (about 1 deg. F). This is NOT a controversial statement…it is well understood by climate scientists. (As of 2008, we were about 40% to 45% of the way toward a doubling of atmospheric CO2.)" What have I (or, possibly, Roy Spencer) missed here?
    0 0
    Response:

    The warming from doubling of CO2 is around 1.2°C (Lorius 1990) so you're not that far off. How does Roy Spencer arrive at "less than 1 deg C"? Unfortunately he doesn't cite how he arrives at that figure so I wouldn't know.

  18. Just a correction to the units in the last post: F of course is in W/m^2, and lambda in K/(W/m^2). Sorry for the typo!
    0 0
  19. Just a correction to the units in the last post: F of course is in W/m^2, and lambda in K/(W/m^2). Sorry for the typo!
    0 0
  20. Actually, I think we are in agreement, as I have been using the coefficients calculated by Myhre et al (1998 and later papers) and used by the IPCC in 2001. Those are slightly lower that previously used figures. One possible explanation for Spencer's figure may be that he uses surface temperature instead of "effective temperature" for the calculation of his version of "Planck-lambda" to arrive at 0.18 instead of 0.27. But, in any case, he seems to be flatly wrong in asserting that it is not a controversial statement. And, as a climate scientist, is it possible not to know that.. For me, the most interesting about Royer's data is that the maximum basic net forcings hundreds of millions of years ago seem to be comparable to what we may be entering into now.
    0 0
  21. Of all the discussions on this website, I think this one deserves the most attention. I think it is the thinnest defense for the climate guys, and the most powerful argument for the skeptics. What I mean to say is that if there were no explanation for why CO2 could be in the thousands of PPM with no concomitant substantial temperature rise, it would be game over for the climate guys. My initial inclination when I look at the plot in Figure 2 is to sarcastically say "How Convenient" it is that the radiative forcing numbers work out to be what is presented. I'll hold that jab for a moment though. The burden of proof is clearly on the climate guys on this one. I have some questions. 1. Why do glaciations initiate at both ends of the radiative forcing timeline(+4 at the end of the Paleogene, and -4 in the middle of the caroniferous timeframes)? 2. Why is there no glaciation at the minimum in the forcing timeline (middle permian)? As far as I can tell, the concept of radiative forcing is really just a mathematical fit of the correlation between T and CO2, without substantive quantitative causal evidence. There is certainly reason to believe in a qualitative causal relationship between CO2 and T, but to quantify the causal relationship based on a correlation and physical inference is a leap.
    0 0
  22. #21 DrMike, you may want to read up on the basic physics here, as the problem you perceive completely disappears upon analysis. Chris Colose has an excellent introduction: http://chriscolose.wordpress.com/2009/10/08/re-visiting-cff/ Maybe you can come back here after having penetrated the subject a bit. The paleoclimatic record seems to confirm that the basic physics concepts are, basically, correct. If you can show that the theory does not fit with the data, that would be very interesting - but you have to apply the theory correctly to do that. Just a hint: CO2 radiative forcing goes with the logarithm of the concentration ratios, so ln(5600/280)=ln(20)=3. With no positive feedback, the first order approximation to the temperature rise from 56 vs 280 ppm CO2 is 3*5.35*0.27=4.3 deg C. Feedbacks will in most circumstances make the effects larger, but that is counterbalanced by a far weaker sun than today.
    0 0
  23. Thanks, I'll take a look. However, could someone address the specific questions I ask about the seemingly inconsistent forcing numbers at which glaciation initiates. If the forcing numbers are correct (I'll look deeper at the basic idea), then how does one explain the initiation of glaciation at both high and low forcing values. Also, no glaciation at the minimum of the forcing value? If the forcing calculations were reliable, It don't think anyone would have to explain away 10s of thousands of years in the permian period, where the forcing clearly strikes a minimum value, without coincident glaciation. Also no explanation regarding "thresholds" would be required for the initiation and perpetuation of a glaciation near the end of the Paleogene period, when the estimated forcing was near a local maximum above +4. Threshold reasoning often creates a thin argument, in my experience. My doubt in the basis of the forcing argument clearly does not come from my skepticism of basic physics, in which I have faith, rather my doubt stems from the lack of clear and consistent evidence showing that the estimated forcing numbers lead to glaciation and de-glaciation (or melting). Thanks for the response.
    0 0
  24. #23 drmike I'm no expert in this, but as far as I can see, the low temporal resolution in the CO2 record may hide "shorter time" changes, like the ordovician episode mentioned in the posting. Such changes may also account for de-glaciations. There are a number of references cited in the above comments, I guess they may be a good place to look for (partial) explanations. I also wonder if the feedbacks have been constant over time. Changing feedbacks may explain a lot - remember that the actual warming effect is forcing + feedback, with feedbacks seemingly much larger than forcings, but variable. There's where the correlation you mentioned kicks in, the relationship between CO2 and temperature is "non-deterministic". And while we may estimate the forcings with some certainty, actual feedbacks depend on a lot of factors that we may never know for the distant past. Without knowing more about details, I think it may be difficult to use the known record for refutations of the type: "X amount of forcing did not result in Y amount of glaciation, therefore the theory is disproved". We may have rather delicate balances here, think of a dynamic system with more than one attractor. Just my speculation :-)
    0 0
  25. Thanks for the response. While I have no issue with the idea that hidden complexities in the climate feedback systems may explain apparent inconsistencies, I don't think that one needs to establish the refutation you outlined: "X amount...". On the contrary, it seems that the burden of proof relative to this skeptic argument lies with with the climate change advocates. I don't think the forcing argument alone works, considering the presence of the aforementioned hidden complexities in the feedback systems. Since the forcing argument is primary to explaining away very high CO2 levels in the past, I don't see how one can walk away from this issue satisfied. I'm not. And, I think it is the most powerful argument the skeptics have posed to date. I hope I interpreted your answer correctly. Thanks again.
    0 0
  26. #23 drmike I'm no expert in this, but as far as I can see, the low temporal resolution in the CO2 record may hide "shorter time" changes, like the ordovician episode mentioned in the posting. Such changes may also account for de-glaciations. There are a number of references cited in the above comments, I guess they may be a good place to look for (partial) explanations. I also wonder if the feedbacks have been constant over time. Changing feedbacks may explain a lot - remember that the actual warming effect is forcing + feedback, with feedbacks seemingly much larger than forcings, but variable. There's where the correlation you mentioned kicks in, the relationship between CO2 and temperature is "non-deterministic". And while we may estimate the forcings with some certainty, actual feedbacks depend on a lot of factors that we may never know for the distant past. Without knowing more about details, I think it may be difficult to use the known record for refutations of the type: "X amount of forcing did not result in Y amount of glaciation, therefore the theory is disproved". We may have rather delicate balances here, think of a dynamic system with more than one attractor. Just my speculation :-)
    0 0
  27. #25 DrMike I think you may have misinterpreted the physics a little here: Forcing doesn't "explain away", anything - the basic forcing is relatively well established, and the sum of solar + C02 forcing is comparable to what we are entering into now. Not very much more, not very much less. The feedbacks are not entirely independent of the forcings, but as a first approximation we can assume they are. Therefore, very much higher CO2 in the past is, roughly, balanced by a somewhat weaker sun. The general picture strongly supports the mainstream theory here. Because we lack the necessary data, we can't, now, in any conclusive way use perceived anomalies in the distant past, like the glaciation/lack thereof at a given level of forcing, to refute current theories. And as long as those theories involve feedbacks as the dominating mechanism, we may face principal limitations in what we may prove with some rigor, because of the complexities. On the other hand, we can obtain crude estimates of long-term averages, and, if I am not quite mistaken, these estimates indicate, in general, significant positive feedback. I think this is a reason why the paleoclimatic record is little brought up by people denying AGW: Their claims are not well supported by the available data, and this tends to get worse over time.. I can well understand that you are not convinced, but you have to make a detailed argument building on best available estimates to get much further. As for the main AGW issues, they will be settled, conclusively, over a few decades from now by the large-scale experiment mankind performs on earth, regardless of any unexplained anomalies of the past. I also find your categorization "climate change advocates" a little funny, as long as climate, as defined by long-time trends, (periods longer than combined sun and ocean cycle lengths) is clearly changing. It will, in fact, take quite a lot of cooling to even out the long-time trends so much as to be able to speak of "no change". Because short-time fluctuations of most parameters are, mostly, several times larger than changes by trend, statistics calculated from observations over shorter periods are, generally, unstable and therefore of little value. There is, at present, no question about climate change. The main questions are, how fast, and is it transient or more stable? What are the reasons? How big is the anthropogenic component, and what constitutes it?
    0 0
  28. Thanks for the discussion. Sorry for the term climate change advocates. I'm just trying to make sense of the issues at hand. I really only have one question. Will higher anthropogenic CO2 substantially contribute to warming, or are we all just spectators to forces bigger than us? I think we have a disconnect in our discussion because I think you have already made that determination. Or maybe I'm confused about the nature and details of the skeptic's argument here. How exactly do you interpret the argument of the skeptics as it pertains to higher CO2 in the past? I thought they were arguing that the data is the data. We had lots of CO2 in the atmosphere in the past, and no runaway greenhouse effect. In fact, we even had glaciations. The counter argument (which is explaining away the high CO2 levels) is that we can't compare the past to the present because the solar conditions were different. The idea of forcing is applied and forcing approximations are calculated to support the counter argument. Furthermore, glaciations as very rough proxies for global temperature extremes are superimposed over the calculated forcing to give these approximations some empirical support. Presumably, if the forcing approximations are accurate (even to a first order), the global temperature conditions will reflect the "state of forcing" at any given time. What I am saying is that I don't think the glaciations provide empirical support to the forcing calculations. The time periods in which the glaciations take place don't correlate well enough to draw any reliable conclusions. Now, if you and everone else have already decided that we don't even need to look at empirical support for the forcing numbers, then this discussion is pointless. I have not misinterpreted the physics of forcing, I'm just questioning the application of those physics since there seems to be an absence of convincing empirical support for the calculated approximations. The application of the calculated forcing factors as the primary driver of global temperatures would be much more convincing if we had a permafrost through the minimum calculated forcing periods, and no glaciations before or after. It didn't work out that way, so there seems to be a lot of splainin' to do. That's all. Thanks again, I'm not trying to be disrespectful. Just skeptical (which I think just makes me "uninformed" on this website.")
    0 0
  29. Sure I'm willing to adjust everything in the estimations - provided we get good reasons for it. That was, for example, why I asked about Roy Spencer's basic CO2 forcing figure here. But as it is not documented, and there are theoretical as well as empirical reasons to use the ordinary figure, I use that one for now. You should also note that if Roy Spencer (qualifies as a skeptic, dosn't he?) is right, the problem of explanation of the distant past is quite small - then we are down to a temperature rise of about 2.7 oC at 5600 ppm CO2. I have not looked into the details, but I _suspect_ this may be an indication that his multiplier is too small. OR that climate sensitivity is/was very high - something I think is a very strong assumption. I think we should be careful to talk about splainin' as long as we would need 450000 qualified estimates for solar activity and CO2 just to get a time series with 1000 years resolution. The error margins (temporally) for the present estimates are huge, and typically they found the ordovician CO2 depression to account for glaciation when they had a zero hypothesis to test: That of high CO2 in spite of glaciation. There may also be huge variations in the past that we will never be able to find in any records. I see problems, both pricipally and practically, with assuming that the temperatures reflect the forcing conditions, but using it as a first, crude approximation is probably the best we have got. And it has been very useful so far, I think. By this principle, we should have had a significant cooling during the last 10 years if the CO2/GHG effects are so small as, e.g Lord Monckton asserts. For the solar activity is at a minimum, ocean circulations have been negative for temperature, and new economic activity has led to a lot of aerosols. Methane increase has halted, too. You may assume that the earth automagically adapts its albedo to such changes.. something like Lindzen's iris hypothesis - but please check the theoretical and empirical support for it before you use it for anything. You may explain what has happened in many ways, all of which may be compatible with physics and the observations, but you can't disregard that the increase in CO2 is a very plausible explanation for the lack of cooling. The feedbacks just seem to be a bit smaller than the global models would like to have it. Which could, for example, be because feedbacks decrease a bit with increasing CO2 forcing, but we don't really know. With the combination of high CH4, very high CO2 and relatively strong sun, we have entered what seems to be new territory for the planet. But still, we are talking about forcings just around 1% of incoming solar radiation, so you may safely say that effects of changes in CO2 are small in the big picture. It's just that when everything else is held constant, these changes may play out. And when everything else is not held constant, you may not be quite sure what is playing out. That's the problem with refutations based on the paleoclimatic record.
    0 0
  30. DrMike, a lot of the uncertainty you've expressed about the relationships between paleoCO2 levels and paleotemperature/paleo evidence for glaciations, would be resolved if you were to read the paper from which Figure 2 above was taken (click on the link "Royer 2005" in the legend to Figure 2 above). I think you'll find that Figure 2 in the top article of this thread was prepared to illustrate the broad effect of the slow relentless increase in the solar comstant over geological time, and that the temporal detail you need to answer the questions you raise are described in detail throughout the rest of the article.
    0 0
  31. Thanks guys. I've read the paper carefully 2 times. I still have reservations regarding the conclusions when I look at the data at face value. I appreciate the efforts and tone on this site. I'll maintain an objective view, and as I learn more, maybe it will all become as obvious to me as it is to you guys. I'll read the paper again, maybe I missed something.
    0 0
    Response: Your approach is much appreciated. Your question "Will higher anthropogenic CO2 substantially contribute to warming, or are we all just spectators to forces bigger than us?" is answered at CO2 is not the only driver of climate. It explains that there are many drivers of climate - basically anything that causes an energy imbalance. This can be the sun getting hotter, volcanic eruptions increasing the planet's albedo or more greenhouse gases trapping outgoing infrared radiation. Climate scientists have calculated the energy imbalance (otherwise known as radiative forcing) from many different causes and found that the effect from increasing CO2 is not only the most dominant forcing, it also is increasing faster than any other forcing.

    We are not just spectators - we are having an impact that is greater than the natural drivers of climate. This is why climate scientists talk about CO2 so much. It's not because CO2 is the only driver of climate. It's because CO2 is increasing so quickly, it's having a greater impact than other effects.

    That CO2 is not the only driver of climate is important to keep in mind when considering past climate change when CO2 was much greater than current levels. You need to take into account other factors like changing solar levels. When you add up the various factors to calculate the net energy imbalance, what we observe in the past is consistent with our understanding of the CO2 greenhouse effect.
  32. Fair enough. One last question on this topic. Royer's forcing calculations assume the solar constant to be 5.5% lower than today at the beginning of the Phanerozoic, and that it increased linearly until now. I was not able to find a citation for this assumption. Is this number just so broadly accepted that no citation is necessary? Where did the number come from. The site mentions 4%. Is the 5.5% assumed by Royer, and the 4% mentioned by the site author relevant?
    0 0
    Response: A good question. I actually wondered this myself back when I first wrote this post and emailed Dr Royer asking the same question. He clarified that the solar levels were calculated in Crowley, T.J., 2000a. Carbon dioxide and Phanerozoic climate. In: Huber, B.T., MacLeod, K.G., Wing, S.L. (Eds.), Warm Climates in Earth History. Cambridge University Press, Cambridge, pp. 425–444.

    The ~4% value applies to the late Ordovician, the 5.5% to the beginning of the Phanerozoic. The article above gives an overview of geological time scales.
  33. @DrMike I really appreciate your questioning of all assumptions - that's important part of what good science is about. Somewhat on a tangent, I would like to comment on the principle of "early falsification", i.e. an apparent lack of fit between theory and data, in a situation where either theory or data, or both, is not very comprehensive. It may make good tactics, but bad strategy. Imagine a "data-driven" response to Copernicus: "You maintain those planets move in circles, but the data clearly shows they don't! That simplistic circular hypothesis could make a good heuristic, but to get at the real science, you have to resort on the computation machinery dating back to Apollonius, which describes this with as much precision as you like. If it doesn't fit, you must aquit!" Which is, factually, quite correct. But enter Kepler and Newton. For may of us, it's not about believing in it. We would rather be thrilled at getting better theories. To work with, that's what it's about. Working.
    0 0
  34. >>>> Late in the Ordovician period, the Earth experienced glacial conditions at a time of high CO2 levels. Observe the thin grey line around 443 to 445 million years ago. How could glacial conditions occur with such high CO2 values?<<<< Answer is really quite simple. During that period of time, the earth was almost entirely covered with ice. This extremely high albedo of white ice reflected nearly all Short Wave solar energy back into space. Since no (very, very little) SW energy was being absorbed, there was virtually NO long wave IR energy being radiated from the eath. Also realize that CO2 can only absorb energy from an (8% to 20%)portion of the IR (long wave) energy spectrum. If there is no (little) LW IR energy being radiated into the atmosphere, atmospheric CO2 would have very little impact on global warming. Also think about the reality that the extremely cold air ducring this period would have also been extremely dry air. Therefore, the normal greenhouse gas impact from H2O would have been close to Zero during this period of extensive glaciation. Geological evidence indicates that what shocked the earth out of this "snowball" state was almost certainly a period of hyperactive volcanic activity. The volcanic activity served to darken the earth's surface which reduced the albedo affect and allowed the sun to warm the earth a bit. This hyperactive volcanism also put a lot of subterranian heat into the atmosphere and oceans, along with vast quantities of ash and CO2 and other gases. As the albedo effect of snowball earth was diminished over 10s of million years, the atmosphere slowly began to heat up because CO2 was there to trap some of the newly available IR energy. Also, as the earth reheated, the amount of H20 om the atmosphere increased which served to accelerate the warming process. In this instance, we can say "thank you Co2, for being there when we needed you the most!" End
    0 0
  35. http://en.wikipedia.org/wiki/Ordovician#End_of_the_period More detail. The Ordovician is a geologic period and system, the second of six of the Paleozoic era, and covers the time between 488.3±1.7 to 443.7±1.5 million. It ended with the Ordovician–Silurian extinction event, about 443.7 ± 1.5 Ma (ICS, 2004) that wiped out 60% of marine genera." Also of note and very relevant is the fact that dry land during the end of this period consisted of one great continent known as Gondwana. And, of most importance, these land masses were sitting over the during the time of this glacial period. Just imagine what impact on climate earth we would see if Antarctica with a current mean temperature of -57degC, was 10 times its current size. I think this glacial period was started, mostly as a byproduct of the location of Gondawana! The amount of snow which would have resulted from a land mass the size of Gondwana being located at the South Pole, both in the sea and on land, would have had a truly enormous impact on the amount of solar radiation which was being reflected back into space! In addition, sea water acts as an enormous heat reservoir. During this period of extreme glaciation, as much as 1/3 of the ocean could have been removed and deposited atop of Gondwana. The result would be less heat in the oceanic reservoirs.
    0 0
  36. Got time to add Breecker? All I have seen is Hrynshyn's blog mention http://scienceblogs.com/islandofdoubt/2010/01/is_the_earth_even_more_sensiti.php Hrynshyn's good, but can only give a pointer to the abstract, as the paper is paywalled, so he's getting lots of questions that need the paper to answer.
    0 0

You need to be logged in to post a comment. Login via the left margin or if you're new, register here.


The Consensus Project Website

THE ESCALATOR

(free to republish)


© Copyright 2024 John Cook
Home | Translations | About Us | Privacy | Contact Us