Climate Science Glossary

Term Lookup

Enter a term in the search box to find its definition.

Settings

Use the controls in the far right panel to increase or decrease the number of terms automatically displayed (or to completely turn that feature off).

Term Lookup

Settings


All IPCC definitions taken from Climate Change 2007: The Physical Science Basis. Working Group I Contribution to the Fourth Assessment Report of the Intergovernmental Panel on Climate Change, Annex I, Glossary, pp. 941-954. Cambridge University Press.

Home Arguments Software Resources Comments The Consensus Project Translations About Support

Bluesky Facebook LinkedIn Mastodon MeWe

Twitter YouTube RSS Posts RSS Comments Email Subscribe


Climate's changed before
It's the sun
It's not bad
There is no consensus
It's cooling
Models are unreliable
Temp record is unreliable
Animals and plants can adapt
It hasn't warmed since 1998
Antarctica is gaining ice
View All Arguments...


Username
Password
New? Register here
Forgot your password?

Latest Posts

Archives

Ice data made cooler

Posted on 9 December 2010 by jg

Guest post by John Garrett

I am an illustrator who started studying the primary scientific literature to better understand what I thought was a controversy over global warming. I quickly learned that climate science was not an island surrounded by controversy, but a well-founded continent, and most critics I met were merely poor navigators. To point them toward land, I created an interactive Vostok viewer, a Flash program that provides simultaneous displays of temperature, greenhouse gases, incident solar radiation (insolation), and Earth's eccentricity, tilt, and climatic precession for the span of the Vostok ice core.
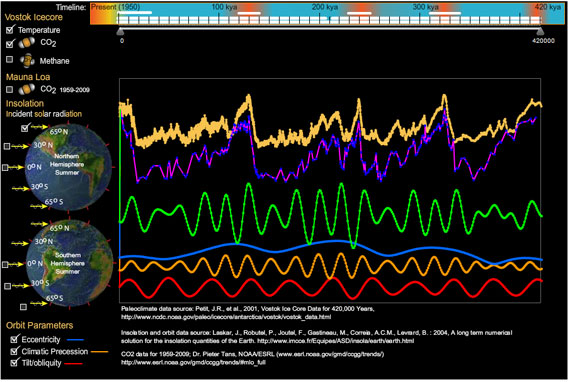
  

My Vostok viewer uses data from these sources, which deserve the primary credit:

  • Petit, J.R., et al., 2001,  Vostok Ice Core Data for 420,000 Years, IGBP PAGES/World Data Center for Paleoclimatology Data Contribution Series #2001-076. NOAA/NGDC Paleoclimatology Program, Boulder CO, USA.
  • Astronomical Solutions for Earth Paleoclimates. A&A 428, 261-285 (2004), DOI: 10.1051/0004-6361:20041335; Laskar, J., Robutel, P., Joutel, F., Gastineau, M., Correia, A.C.M., Levrard, B. : 2004, A long term numerical solution for the insolation quantities of the Earth.
  • CO2 data for 1959-2009; Dr Pieter Tans, NOAA/ESRL

My viewer is a supplement to Earth, Orbit and Climate, an illustrated presentation I created for my astronomy club, which I drew (literally) from Ray Pierrehumbert's Principles of Planetary Climate* (I credit Pierrehumbert but claim no endorsement).

I recently became interested in learning more about the Eemian interglacial and added this to my Earth, Orbit and Climate presentation. I created a variety of graphs and paired them with diagrams of the Earth's changing orbit. For example:
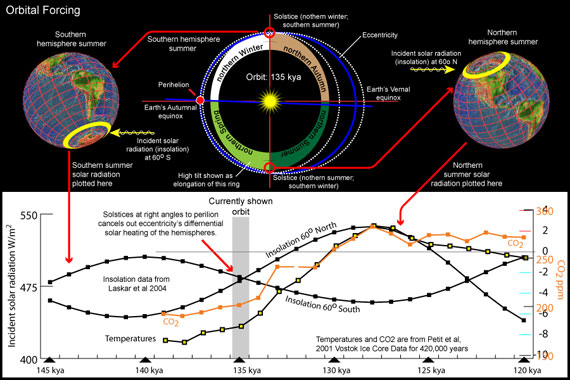
My original goal was to recontruct past orbits (top of this diagram), but seeing the correlation between insolation, CO2, and temperature evoked more curiousity: What about insolation at other latitudes? And at different time periods?

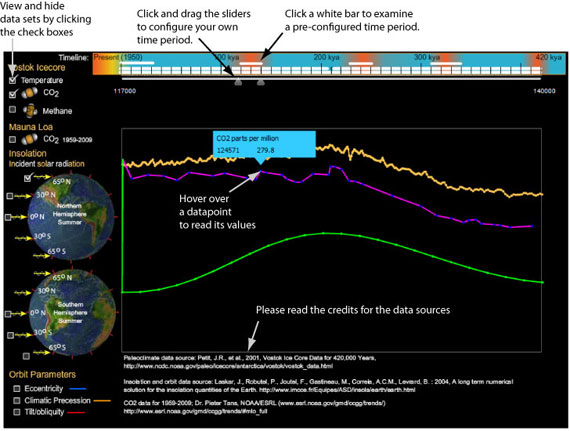
To examine similar correlations for other interglacials, I had to re-export the data, convert it to a table, and then to an illustration. In this process, I was concerned that I would make errors: for example, it would be easy for me to shift one of the graphs left or right, accidentally pairing data from different times (a mistake I made at least once). So in designing my viewer I decided it had to 1) preserve the data for easy verification against my sources, 2) zoom in on any span of time, 3) bring in any dataset that is indexed by date, and 4) fit in 900x600 pixel screen to ensure I can use it in my astronomy presentations. Using the viewer is described below:
Since creating this program I made another personal discovery (that climatologists already knew). Compare northern summer and southern summer insolation at 0 degrees latitude to the same for 65 degrees north and south. Change in insolation at 0 latitude is symmetrical between north and south, but as you approach the poles, this change becomes asymmetrical, hinting at the profound influence in global climate from northern insolation.
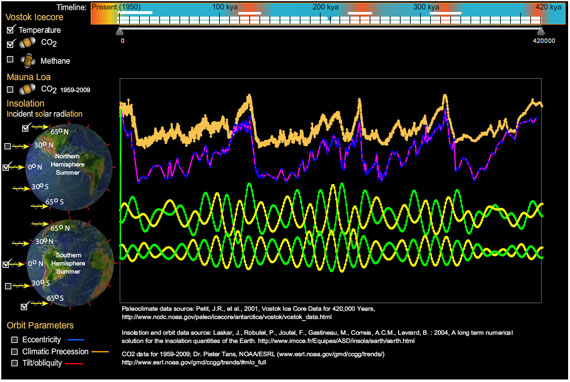
Equally profound is the latest addition of the Mauna Loa CO2 measurements. It challenges the hard-coded vertical scaling I used for the graphs. I will make the scaling more flexible in following versions. I'll also accept requests on features to add.

John Garrett, Wildomar, CA

* Principles of Planetary Climate will be released on Dec 31, 2010 (per Amazon books). I just ordered my copy.

0 0

Printable Version  |  Link to this page

Comments

1  2  Next

Comments 1 to 50 out of 57:

  1. Very nifty. Thanks John.
    0 0
  2. So correct me if I'm wrong-as I understand it, as Earth's orbit brought it closer to the sun, temperatures began to rise. This, in turn, caused a release of CO2 into the atmosphere, which continued to drive temperatures upward long after the orbit had reached its nearest approach. Of course this time there is *no* orbital shift towards the sun (If anything, we should start moving *away* from the sun sometime in the next 20,000 years or so), so how do those contrarians explain the rise in CO2 & the accompanying rise in global temperatures? ;)
    0 0
  3. The higher the eccentricity, the larger the difference in time (days) across the equinox line. The model should account for this. It should also account for the increase in release of other gases from oceans with temperature (such as oxygen), which would tend to temper the relative CO2 ppm values.
    0 0
  4. Hi John just noted that the page displaying tghe triple point of water is showing it as 273K at 101kPa. It's actually 273K at 611Pa (right down just above the temperature axis line with that pressure scaling). CO2 is also 216K at 517kPa, so slightly lower than shown. Very good presentation though, and very timely as I'm involve in a discussion about this very subject.
    0 0
  5. Good stuff, John G. The power and impact of the visual presentation reveals itself time and again. This bit also was powerful:
    "I quickly learned that climate science was not an island surrounded by controversy, but a well-founded continent, and most critics I met were merely poor navigators."
    Great visuals and great word smithying! The Yooper
    0 0
  6. John Nice piece of flash programming. I offer to you and others a project I designed a few years ago, funded by NSF, an interactive Flash-based game on global warming. It, too, is a work in progress but it is available at no cost "as is" online. www.globalwarminginteractive.com Feel free to use and distribute. Mike Hillinger
    0 0
  7. Thanks, this is pretty cool, but this isn't my field so my questions might seem simplistic. I see the asymetry in insolation you are talking about (although I don't understand how you infer (or know?) that from 400,000 years ago); there is also an asymetry at ~350-400kya and I don't see that correlating with increased temperature or CO2 levels. Can you explain this? Not arguing against this, just trying to understand it. I teach Biology at a community college and am trying to cover this better in my classes. Jeff
    0 0
  8. Thank you for your comments. I have a full day ahead of me, and I'm doing an astronomy presentation for 5th graders tonight, so I have to be at my best. I'll respond now, and if necessary, I'll be more thorough 12 hours from now: Jeff: your question is my question too. I'm an amateur trying to figure this stuff out. When I built the viewer I was able to see for the first time that the correlation between northern hemisphere insolation and temperatures was visually striking for the Holocene and Eemian deglaciations, but not for the earlier two deglaciations in this data set. There are many areas to explore: e.g., see-saw effects that may delay warming in Antarctica? another Younger-Dryas like event? or perhaps there are errors in dating that magnify as you look at older ice. When I was studying the ice core data, I saw information on varying dating methods. I'll be exploring these. Mike: I'm eager to try out your program. I think it may be a great link to offer the kids I give astronomy presentations too. (I'm noticing an increase in kids asking what I think of global warming.) Mikemcc: thanks for the correction. I'll fix it. Marcus: I think the current theory is that orbital variations create differential heating of the high latitudes (north and south) that is more of a disturbance (rather than a change in over all heating) that can put more fresh water into the North Atlantic, changing ocean currents, which can release CO2 sequestered in the southern ocean (or reduce it's uptake of CO2); and then there are land changes such is deglaciation and lowered albedo, release of methane and carbon from northern tundra, permnafrost and bogs. One of my next steps is to get the average insolation values and see if they change much or if its mostly differential heating at work. RSVP: I will study your comment. My Earth, Orbit and Climate presentation includes mention of eccentricity affecting the time in season and that this was an earlier hypothesis superceded by Milankovitch. I think my reference for this is a Nature review article that I should cite as source. The release of oxygen tempering the effect of CO2 releases is new to me. I welcome more information on this. All: thanks for the time looking at my project and for your comments. jg
    0 0
  9. John Garrett, A fantastic tool, a job well done. Thanks for this. If I might make one request at this time. Would it be possible to display horizontal scale lines and have the scale adjustable by the user? I realize the mouse-over function allows one to examine each data point-- but it would be nice to get an idea of the values without having to do that. Wish I had your skills John;)
    0 0
  10. Albatross, Thank you, and yes. I'll add the features you request. I'll probably have a new version released by the end of the holiday break. jg
    0 0
  11. Great stuff. How difficult would it be to ad two windows so you can inspect two period at the same scale....
    0 0
  12. Marcus The influence of Miankovic Orbital variations on Earth Climate are well understand and are robust. This was resolved with the publication of a paper in the 1970's by Hays and Imbrie. You can read about this in Imrie's book and in a book by William Ruddiman. I'm at work so can't provide details but this is enough if you hit amazon. Orbital variations do not change the solar radiation incident on the Earth over the year. They only change the distribution of that energy in time, depending on which season the Earth happens to be close to the sun (it is an eliptical orbit) and the tilt of the Earth relative the the plane of the Earth orbit. It turns out that when the solar insolation (look this word up) is weakest in the summer at about 65 degrees North Lat, then the winter snow accumulation will not melt very well and thus the ice sheet grows. Croll had the idea that orbital variations caused the ice ages but he thought that cold winters would do the trick. Milankovic's great insight was that it was cold summers which did the deed. All very fascinating and Imbrie has all the history of this discovery as well as being one of the discoverers Tony
    0 0
  13. Hi Mike, this is a very interesting and fascinating program. Thank you. Can I get a copy of it? Just for teaching astronomy and climate physics. However I do not understand the following: When you - only - click insolation on 0º NH and simultaneously on 0º SH - I would expect equal plots. However they have a "phase shift" of - say it simple - 180º .. Could you explain that please? kind regards JK PS: I made a screenshot of this phenomenon - how could I provide that to you?
    0 0
  14. paulm, Good suggestion. I'll add that feature to the list. There some enjoyable irony in that I built this program so that I wouldn't accidently mix up time periods. JK: The insolation values are for June (northern hemisphere) and December(southern hemisphere). So though both plots are of the same latitude, one is what you would measure at one point in Earth's orbit, and the other, six months later. So as long as there is some eccentricity, these values would be different, that is, except for times when the equinoxes are at right angles to the semi-major axis, e.g., at 135kyr (second diagram). When I first collected the data, I included plots that could compare +65 June to -65 June, and quickly decided this wasn't as valuble of a comparison as N. Summer (Jun) to S. Summer (Dec); However, I may add these graphs. Your request for a copy of the program--that was for Mike's global warming game, correct? jg
    0 0
  15. Anyone wanting to exchange files can contact me at my blog. Go to http://www.brightstarswildomar.blogspot.com/.
    0 0
  16. jg #8 "The release of oxygen tempering the effect of CO2 releases is new to me." To me too, since I made it up on the fly. I am referring to the fact that all components of the atmosphere dissolve in water, so when CO2 is released as a function of warming so is everything else, thereby increasing partial pressures of all gases. If all partial pressures increase in unision, its not clear why the ppm of any one component should go up. In fact, you would expect the partial pressure of the more abundant gas to go up higher in proportion to its overall percentage, so that in fact ppm of CO2 being so small should go down. But I am no expert, so this is pure conjecture bases solely on skeptical logic.
    0 0
  17. @RSVP: you seem to be ignoring the gigatons of anthropogenic CO2 being released in the atmosphere each year...
    0 0
  18. RSVP: Thank you for elaborating. I'm not qualified to give you an answer. I can only make a comparison. Forgive my not looking the name up, but there are a couple lakes in West Africa notorious for their sudden outgassing of CO2 that has sufficated nearby inhabitants. Somehow it was possible for thsese bodies of water to build up CO2 in ratios not typical of the atmosphere and then release it, also in ratios not typical. I have a few articles that describe the role of outgasing and the ocean's biological pump. One mentioned that a mechanism building up CO2 could be the reduction of ocean's biologoical pump. As I understand the biological pump, it's the growth of phytoplankton that take up CO2 die and sink to the bottom. A lot of recycling of nutrients happens in the 100 meters before the dead plankton sink, but the net sum of what gets through and buried can change, and this process is selective. In fact the scientific literature is full of processes that selectively operate on different chemicals and elements. Thank you for encouraging me to ponder this. jg
    0 0
  19. jp Excellent work! Don't worry about comment #3. I don't have the exact numbers at the moment but the same release from the oceans that makes CO2 raise from 250 to 400 ppmv as a product of the warming process makes oxygen, for instance, to rise from some 209,000 to 209,030 ppmv, so the conclusion is pretty obvious: much below other error margins. About eccentricity, Laskar et al have taken care of it, so the conclusion is: done. There are a few things that ""should"" be considered along the content of comment #3, but I'll better comment in your blog as many "eager skeptics" use to hang raw comments in sites like this just to have them corrected so they can publish them in other sites as arguments (the "throw everything at the wall and see what sticks" strategy described here by dana1981)
    0 0
  20. Hi Tony, thanks for the reply. Yes, having done a fair bit of reading on Milankovitch Cycles, I can honestly agree that it is *extremely* robust-& fits extremely well into the climate cycles of at least the last 1 million years. My question was more seeking clarification of exactly how Milankovitch cycles work. Judging from John's reply, I was close, but not quite on the mark ;). Certainly the uniformity of recent warming events is yet more proof that Milankovitch cycles cannot be blamed this time around ;)!
    0 0
  21. The relative important of various feedbacks the magnify the NH milankovic cycle is still significant area of research as far as I know. The lack of land in SH temperature zone has to involved to explain why there global glacial cycle isnt a seesaw between NH and SH. Beside ocean feedbacks, there is of course albedo (limited in SH because little land available to cover with ice. Australia is too low and too far north) but also note the biogenic methane is clearly a feedback. Swamp methane,(increases with warm, decrease with cold) which then oxidises to CO2. The effect of vegetative change on the CO2 feedback also appears to be significant(see Kohler et al
    0 0
  22. RSVP, Oxygen is not very soluble in water while carbon dioxide is very soluble in sea water. Therefor the ocean can outgas a lot of CO2 but not much O2. In addition, since the amount of CO2 in the atmosphere is small relative to oxygen, releasing the same amount of both gases would substantially raise CO2 while leaving O2 essentially unaffected. A person with your level of understanding of science should refrain from speculating about changes in the climate and atmosphere on a science blog.
    0 0
  23. JG: thanks for the comment. of course now everything is clear. The programme I was requesting is the one which generates the graph ... (is it in Java or Javascript or C++ or fortran?)
    0 0
  24. JK: the application file is Flash (.swf) which can be run by any browser that supports a flash player plugin. The code is written in Flash's scripting language called ActionScript. Contact me at my blog (http://www.brightstarswildomar.blogspot.com/) and we can figure out how to exchange files. jg
    0 0
  25. JG I would like to see units. Just something my profs drove into me from day one. There is insolation and there is albedo. Where the albedo is extremely low the energy will be retained at the surface and not re-radiated. Where the albedo is moderate to high the insolation energy will try to get back out by radiation. Is there some way you can show albedo at various latitudes over time?
    0 0
  26. TOP: Yes. Units are not optional. My next version will address a variety of needed display features that you and others have pointed out. Great suggestion on albedo. When I was adding the Methane graph, I thought I should scale it according to it's added greenhouse effect, and then do the same with CO2. I didn't get around to it, but your suggestion on albedo brings the issue to the front. I should try to show a variety of feedbacks. Any one know of a data set with this type of information? One clarification: Do you mean, where albedo is low, more solar radiation is absorbed and reradiated at infrared; and with high albedo, more solar radiation is reflected back into space? jg
    0 0
  27. Michael sweet #22 "releasing the same amount of both gases would substantially raise CO2 while leaving O2 essentially unaffected." CO2 solubility is around 4x that of O2. O2 in the atmosphere percentage-wise is around 500x that of CO2. For a 1 degree increase in water temperature you should have 125x the amount of O2 released. This means for every CO2 molecule you have 125 O2 molecules, which means the ppm CO2 goes down, not up.
    0 0
  28. @RSVP As you were told, refrain for speculating if you don't know the subject. The figures were already given. If you want to have it correct you must research partial pressures and revise the simple arithmetic chain behind, as your "which means the ppm CO2 goes down, not up" shows you lost it at some point. Reading your paragraphs suggests that you suppressed some important information needed in the arithmetic chain and jumped to a conclusion. Research the web looking for that info, I won't offer that. @rest of the members I suggest not to provide basic information to those who, lacking the fundamental background and discipline, go fishing fundamental concepts using made-up assertions as bait. Please answer "you have ABC wrong, I suggest you revise DEF". It will suffice.
    0 0
  29. Alec Cowan #28 Its not about "knowing the subject" as simply going to the table. You can check the data for yourself. http://www.engineeringtoolbox.com/gases-solubility-water-d_1148.html The same kind of thing holds for N2, where CO2 solubility at 20 degrees (say) is 8x, but since N2 in the atmosphere is 2000x the amount of CO2, for every C02 molecule coming out of the water you will get 250 N2 molecules. That makes 375 O2 and N2 vs 1 CO2. As the ratio of CO2 is higher than 2500:1 you are right, it looks like CO2 ppm will increase. How much? It should increase in the order of 1:375 or 0.26% per degree increase in ocean's waters. Since CO2 is currenly around 0.04 percent, it would therefore go up to around 0.0401% for a one degree change. This doesnt seem very significant.
    0 0
  30. @RSVP (#29) You keep changing your numbers, but no, you still have partial pressures out and even though you now have roughly included the important factor you left out before (atmosphere composition), you still have severe problems with your arithmetics (+,-,x,/ and %), as they became worse. Check that out. As you should make a total rebuilt of your background here, I suggest you to include detecting a difference when speaking of carbonate and dioxygen, dinitrogen and any di- form of a gas. And as a matter of epistemology, I think that trial and error should be strictly prohibited in the Comments Policy.
    0 0
  31. @RSVP: you suck at math. "O2 in the atmosphere percentage-wise is around 500x that of CO2. For a 1 degree increase in water temperature you should have 125x the amount of O2 released. This means for every CO2 molecule you have 125 O2 molecules, which means the ppm CO2 goes down, not up." Let's say you have 1 CO2 molecule for every 500 O2 molecule. That's a relative concentration of 1/500. Now, we add 500 O2 molecules more. According to your ration, that means that 4 CO2 molecules are added (1 per 125 O2 molecule). The new relative concentration is thus 5 CO2 molecules (1+4) for 1000 O2 molecules (500+500), for a value of 5/1000, or 1/200. This means that relative concentration has more than doubled, and not decreased as you suggested. Why would anyone trust anything you say about science when you make such basic mistakes. Oh, right: nobody dose anyway. Please keep wasting your time trying to challenge good science with your very approximate knowledge.
    0 0
  32. RSVP, solubility of CO2 in water is not a factor 4, but 40 higher than that of oxygen. Similarly, for nitrogen it is not a factor 8, but 100. Data from the same link you provided. If you cannot even read a simple graph... Also note that there is a question whether the oceans are saturated with oxygen, nitrogen, and carbon dioxide (go ahead, do the calculation).
    0 0
  33. Marco #32 Thanks for pointing that out. Therefore the decimal point needs to be moved over. Instead of 0.0401%, it should be .041%. archisteel #31 "Why would anyone trust anything you say " No one should. Everyone needs to think for themselves.
    0 0
  34. If I may derail the discussion around RSVP for a moment, I made a small update to the Vostok viewer. Prompted by comments, I added mean yearly insolation, which is nearly a flat line. You can now see that (according to Laskar et al) total yearly insolation intercepted by Earth over the Vostok timespan changes little. Other updates on labels and usability will take more time. jg
    0 0
  35. RSCP, When you do not know what you are doing you look stupid when you tell me I am wrong. According to your data, for a change of temperature from 0C to 10C there is approximately 100 times as much CO2 released as O2. The amount of gas released relates to the change in the solubility of the gas, not its concentration in the atmosphere. If you do not understand this basic fact you need to stop posting nonsense. Is your "skeptical logic" (from 16) to do the math incorrectly and then berate others for trying to show you the correct math? Making up absurd stories and than claiming scientists might be wrong since they have not addressed them does not amount to "logic", it just wastes everyone elses time.
    0 0
  36. Hi jg: Great work! Thanks very much. On one of the Energy Budget pages it says "Internal heat loss is negligible. Crust is a good insulator, keeping the core hot for 4.5 billion years." I don't think that is correct. Heat released by radioactive isotopes decaying keeps the Earth's interior hot. Stephen Jay Gould wrote an essay "False Premise, Good Science" in his book "The Flamingo's Smile" that discusses this issue. (http://tinyurl.com/28utjjx)
    0 0
  37. jimvj: I meant to say that crust is a very good insulator, and I shouldn't have implied that it was solely responsible for Earth's internal heat. I'll fix that. I'll look at the link too. Thank you, jg
    0 0
  38. michael sweet #35 "The amount of gas released relates to the change in the solubility of the gas, not its concentration in the atmosphere. " Solubility is the propensity of absorption, not an amount. If I put a dry sponge on a dry surface, it isnt going to absorb a whole lot of water. The water needs to actually be there first. So concentration or partial pressure of gases determines the amount. I suggest you go here and see what it says about "Henry´s Law". http://en.wikipedia.org/wiki/Partial_pressure "Gases will dissolve in liquids to an extent that is determined by the equilibrium between the undissolved gas and the gas that has dissolved in the liquid (called the solvent)....The form of the equilibrium constant shows that the concentration of a solute gas in a solution is directly proportional to the partial pressure of that gas above the solution."
    0 0
  39. RSVP: You do not need to tell me about the solubility of gases. I teach chemistry, including Henry's Law. The solubility of CO2 is a complicated function related to the pH, atmospheric pressure, salinity, temperature and the ambient pressure, which changes at depth. You have no idea how to calculate the solubility of CO2 in the ocean and are using "skeptic logic" to make absurd claims. Scientists have measured the changes of CO2 and oxygen in the ocean. Your claim in 3 that O2 would be outgassed in significant amounts by a warming ocean is absurd. Provide a link to a peer reviewed paper (or even a skeptic web site) to support your wild, unscientific claims. Moderator: CO2 and O2 solubility should be declared off topic on this thread to prevent another "waste heat" thread.
    0 0
  40. michael sweet #39 It's not clear where you are trying to go with this. Is it just all about negating anything I could possibly post? I assume some oxygen would be released. Why dont you simply quantify the amount or explain how oxygen and nitrogen are somehow exceptions to Henrys Law, or in which ways CO2 is special etc. Wouldnt this be good for everyone to know?
    0 0
  41. @RSVP: I accept your admission that you have indeed no credibility on the matter, and have lost the argument. The question is, after being shown wrong so many times, why are you still here re-hashing the same old debunked arguments? Unlike wine, bad science does not get better with age...
    0 0
  42. archiesteel #41 When you say "bad science", are you referring to badly intended ideas, or simply ideas containing error? Considering how many people died for "bad science", whether it had to do with test pilots crashing, rockets that blew up on the launch pad, bridges that colapsed etc., it appears that trial and error makes up an important part of the scientific process. All this is getting way off topic, so to brings things back on track, I believe the issue had to do with some minor details surrounding a climate model. Even if the model never incorporates them, it isnt a bad idea to know whether some variables should or should not be ignored. This can only provide more confidence in the model, not less. On the otherhand, there is nothing to stop someone from extending the investigation (behind the scene if deem necessary) and when this issue is clear, take the steps necessary to make the appropriate modifications. I am not sure what is "bad" about that.
    0 0
  43. @RSVP: by "bad science" I mean science that does not follow the empirical method, or that contains glaring errors. It also includes basic math errors, like the one you made earlier. Perhaps you should stop criticizing for a while, and start learning with an open mind free of politically-motivated preconceptions.
    0 0
  44. @RSVP #40 It's not negating anything you could posibly post, as you could post things that are right. For instance, you took my advice to look at partial pressures and quoted Henry's Law (You see, nobody is telling you that is wrong) but still you don't catch the difference between an ion and a di-gas. But it remains, among other things, the set of problems related with arithmetics that your post #29 shows (it is still there for everyone to see). As I say, I won't give the solution nor point the several mistakes for you, and I think everybody else are of the same opinion. I'm only going to point your mistakes and give you some hints as suggesting you to reconstruct the reasoning in post #29 on paper with simple diagrams and paying attention to what you take and what you add here or there, understand the % you are talking about, and then get the data and apply it to your now carefully weighted formulas. I'm sure you agree that we all -including you- must avoid giving answers to people who don't want to ask directly what they clearly ignore and pretend instead pull out information by promoting dialogues like: "-Water boils at 500° - No, it boils at 100°C - Yes, as water boils at 100°C, the sky is brown - No, the sky is blue ... "
    0 0
  45. Alec Cowan #44 "you don't catch the difference between an ion and a di-gas." I have referred to O2 assuming oxygen occurs this way in nature. If I am wrong about this, please exlain. As far as the "calculation", I have simply applied laws of proportion to the problem (and yes, made a mistake by reading a value incorrectly from a table), but the idea here is what matters not the the result. The idea simply that as CO2 outgasses so do a lot of other things. Since this fact doesnt seem to seat well with some people, there has been an attempt to discover flaws in my calculation, and ignore post 33. Ironically, I am being accused of being politically motivated. Since when have you heard of a politician admitting a mistake? Again, if this last value is off by some astounding amount due to a huge blunder, no one has yet pointed it out. As I said, we could all learn something. Yes, water "boils" at 100 degrees C, however that would be pure water, and at sea level. Beyond that, I dont think much more accuracy is needed. However, there will always be someone who will take issue with something like this, and spin their poster miles looking for technical inaccuracies that ultimately have no practical significance to the vast majority. Yet this thread is filled with remarks of this sort. Not sure who they think they are fooling.
    0 0
  46. RSVP: Your calculation is riddled with additional errors that you have not noticed. See my post 39. The calculation is too difficult to do on a blog. The longer you go on the clearer it is that you do not know what you are talking about. You are legendary for the "waste heat" thread and continue to raise the issue of waste heat even though the site has dedicated over 400 posts to explaining heat to you. Stop doing the same thing here. My post 22 sums up the situation about outgasing of O2. Read it again. A qualitative answer is the best you will be able to get. Read the posts that we give you. O2 and N2 are different from CO2 because of their chemical properties, which you do not understand. Archiesteel @41 x2. Alan: your post 28 was useful to me.
    0 0
  47. @ RSVP #45 Departing from 250ppmv CO2 and 209000ppmv O2 I arrive to 400ppmv CO2 and 209042ppmv O2 by making some reasonable assumptions (the conclusion won't change for making a more precise calculation). You have been said once and again your calculations are wrong -nobody would point each value and provide the valid one-. Any person doing reality checks and using common sense would have departed from CO2 being much more soluble than O2 and N2 and deducted that there would be a much higher volume of CO2 outgassed from warming oceans than the volume of every other di-gases. Said that and as the part of the atmosphere that is CO2 is so small when compared to nitrogen and oxygen the conclusion is obvious: the ppmv of CO2 raises while the change in the other two remains negligible. No calculation is needed to reach this conclusion, just the perception of someone with discipline and no preconceived conclusions to ascertain.
    0 0
  48. michael sweet #46 "The longer you go on the clearer it is that you do not know what you are talking about. You are legendary for the "waste heat" This sounds like an ad hominem to me. (i.e. since I didnt consider atomic mass, moles etc., to do my calculation, everything I could have possibly said about waste heat is completely untrue.) ... and not being able to substantiate your argument because the blog medium is a cop out. I could understand if you were complaining about not getting paid for it. Here we go again... http://www.engineeringtoolbox.com/gases-solubility-water-d_1148.html @20 degrees solubility N2 in water = 0.0158 g/ kl solubility O2 in water = 0.045 g/ kl solubility CO2 in water= 1.5 g/ kl considering... N2 79%, atomic mass 28 O2 20%, atmoci mass 32 CO2 .04%, atomic mass 44 this yields... @20 degrees solubility N2 in water = 5.64e-4 mol/ kl solubility O2 in water = 0.0014 mol/ kl solubility CO2 in water= 0.0341 mol/ kl Normalizing this for CO2, you get @20 degrees solubility N2 in water = 0.017 solubility O2 in water = 0.041 solubility CO2 in water= 1 again, taking into account the ratio of atm. comp... N2 roughly 80% O2 20% CO2 .04 % normalizing this to CO2 you get N2 2000 O2 500 CO2 1 taking these results, you would expect to find the following ratio of gases dissolved in seawater at 20 N2 2000 x 0.017 = 34 O2 500 x 0.041 = 20 CO2 1 x 1 = 1 However, I just checked this link... http://www.seafriends.org.nz/oceano/seawater.htm which contains a beautiful table in about the middle of the webpage that just happens to contain information on this. As you can see, according to the data, my ratios are off by a factor of ten. Not sure if this is due to bacteria or what, but even still, you have more O2 and N2 than CO2 in the water.
    0 0
  49. @ RSVP "Not sure if this is due to bacteria or what, ..." Your ratios are off due to bacteria !? Please, elaborate.
    0 0
  50. #48: Excellent link, RSVP. But well off-topic for this thread, which is about ice data. Look down the page for the two graphics showing how much both the oceanic concentration of CO2 and ocean water pH have changed, according to measured values. Followup discussion on that subject should go here.
    0 0

1  2  Next

You need to be logged in to post a comment. Login via the left margin or if you're new, register here.


The Consensus Project Website

THE ESCALATOR

(free to republish)


© Copyright 2024 John Cook
Home | Translations | About Us | Privacy | Contact Us