Climate Science Glossary

Term Lookup

Enter a term in the search box to find its definition.

Settings

Use the controls in the far right panel to increase or decrease the number of terms automatically displayed (or to completely turn that feature off).

Term Lookup

Settings


All IPCC definitions taken from Climate Change 2007: The Physical Science Basis. Working Group I Contribution to the Fourth Assessment Report of the Intergovernmental Panel on Climate Change, Annex I, Glossary, pp. 941-954. Cambridge University Press.

Home Arguments Software Resources Comments The Consensus Project Translations About Support

Twitter Facebook YouTube Mastodon MeWe

RSS Posts RSS Comments Email Subscribe


Climate's changed before
It's the sun
It's not bad
There is no consensus
It's cooling
Models are unreliable
Temp record is unreliable
Animals and plants can adapt
It hasn't warmed since 1998
Antarctica is gaining ice
View All Arguments...


Username
Password
New? Register here
Forgot your password?

Latest Posts

Archives

La Nina watch: March update

Posted on 9 April 2008 by John Cook

I confess to checking the NASA website like a true data geek the last few days, waiting for them to update the Land Ocean Temperature Index with March's figures. We saw last month how the La Nina cooling experienced through 2007 may have already started to reverse when February showed distinct warming compared to January. But what would March tell us? I must admit, even I was surprised.
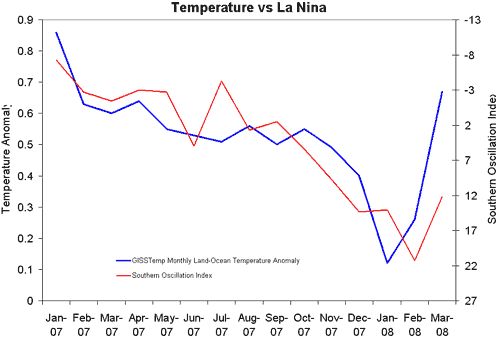

Figure 1: Land Ocean monthly Temperature Anomaly (blue line - NASA GISS) compared with Southern Oscillation Index (red line - Australian Bureau of Meteorology). Note - SOI axis is reversed as positive SOI corresponds to La Nina conditions.

The temperature jump over the last two months is surprisingly high. John Cross predicted 0.45°C for February (which I thought was an overestimation). March's 0.67°C blows that out of the water. What is the significance? Probably the danger of reading too much significance in short term temperature change. Daily Tech proclaimed 2007 wiped out a century of warming. By that logic, you could say the last two months reinstated 75 years worth of warming.

At best, we can surmise the La Nina cooling may have subsided. The Southern Oscillation Index, a measure of La Nina activity, shows a reversal but only over the last month. We'll have to watch and see how the next few months progress. Anyone care to go on record with an April prediction? Crossy?

UPDATE 10 Apr 2008: Atmoz gives an insightful analysis of global temperature maps and finds a significant contributor to March's temperature spike is a large temperature anomaly over Asia plus missing data over a cooling Africa. La Nina's reversal doesn't seem to be the main driver of the recent warming.

0 0

Printable Version  |  Link to this page

Comments

Comments 1 to 13:

  1. I hope the cold can hang on a couple more months. Our salmon are going to sea during this time and warm temperatures are bad for those little guys. Being an optimist, I'm going to say this recent return to warmth is an anomalous blip and April will be back to 0.5. Too bad my prediction is worthless. I hope someone has a reason to expect good news.
    0 0
  2. Well, you see my prediction was actually for a time period that was two weeks from February and two weeks from March. So if we do the math for this time frame you get a contribution of 13 from February and a contribution of 14/30 * 67 = 31.3 from March so together you get an anomaly of 44.3! So in fact my prediction is amazingly good. I am expecting NASA to be calling on me any time now if the psychic hotline doesn't hire me first! John PS in regards to April, I do know the value of the anomaly, but I am not sure of the time frame for it yet ;-)
    0 0
  3. http://www.woodfortrees.org/plot/uah/... Live graph of 4 data sets
    0 0
    Response: That is one nifty little webpage! Doesn't just plot live graphs, does annual means, detrending, Fourier analysis. I've added it to my Resources Links. Here's the graph you linked to:


    Atmoz's analysis of global temperature maps looks at how GISS includes areas over China and Mongolia with high temperature anomaly that RSS does not. Similarly, RSS includes cooler South Africa which GISS doesn't. So GISS is probably too high and RSS is too low. Will be interesting to see if GISS update their data with South African data down the track (if they do, someone let me know).
  4. Look closely at the 3 similar maps in the Atmoz link (Jan, Feb, March) specifically in the area of southern Peru and northern Chile where they meet the coast.
    0 0
  5. Somewhat unrelated, but since I linked to it from here... I went to Atomz reference listed. the Map for March shows a Huge temperature spike across Northern and Central Asia. this doesn't fit at all well with all the news reports of huge snow events in China etc. Is the resolution on the map really bad or is the GISS temperature data wrong? I see the hot spot there quietman what are you saying about it?
    0 0
  6. That is the area of welling up that I mentioned, where El Nino originates. The heated area is full of very active volcanos and the subduction zone is just off shore. The maps show the increase in activity and signal that La Nina is ending soon. This is currently the most active area in "the ring of fire". There are similar but weaker events all around the ring and they have been more active since the late 1970s (strong El Ninos, not as strong La Ninas, but this one is fairly strong).
    0 0
  7. Also, on the northern part of the March map you mentioned, Mackey had predicted that when enough ice melted covering ocean surfaces, the additional moisture picked up off the water would cause very heavy snowfall in Asia due to the path of the air currents over the pole. He was obviously correct. The march warming is most likely due to aerosol pollutants and particulates that collect over the pole from all over the northern hemisphere. It is being investigated right now.
    0 0
  8. WA I have posted additional comments on why this area of the map is relavent on the Volcanos thread because the El Nino / La Nina cycle is caused by vulcanism.
    0 0
  9. WA In the April Update You can see the correlation between those maps and the change in La Nina. Like I pointed out, it's nearly over.
    0 0
  10. What about this news bulletin from NASA which indicates that we may have a significant cooling effect for the next 20-30 years? La Nina and Pacific Decadal Oscillation Cool the Pacific http://earthobservatory.nasa.gov/Newsroom/NewImages/images.php3?img_id=18012
    0 0
  11. Yeah looks like it is ending but, we can still hope, April temp was down and I just love making everyone fuss. I did after all predict a double dip.
    0 0
  12. I would be curious to find out how this played out for the rest of the year. If I understand it correctly, since La Nina fizzeled out in MArch, we should start seeing an above average temps for the rest of the year. Has this been the case? Will someone update the date?
    0 0
  13. The answer to both your questions is yes... Here's the UK Hadcrut3 global temperature analysis, for example: http://www.cru.uea.ac.uk/cru/data/temperature/crutem3gl.txt
    0 0

You need to be logged in to post a comment. Login via the left margin or if you're new, register here.


The Consensus Project Website

THE ESCALATOR

(free to republish)


© Copyright 2024 John Cook
Home | Translations | About Us | Privacy | Contact Us