Keep those PJs on: a La Niña cannot erase decades of warming
Posted on 8 November 2010 by John Bruno
Former TV weather guy Art Horn has a post up at Pajamas Media about the current La Niña. He mixes some reasonable and accurate observations with several important misconceptions and misstatements about weather, oceanography and climate change.
Mr. Horn correctly points out that we are in the midst of a strong La Niña phase of the El Niño Southern Oscillation (ENSO) cycle. We entered the current La Niña when the last El Niño ended in April/May (or a month or so later based on NOAA's Multivariate ENSO Index). As a result, equatorial Pacific Sea Surface Temperatures (SSTs) are currently about 1.4 C cooler than average.
As Art says, the switch from El Niño to La Niña was abrupt, as can be seen in the rapid change from negative to a positive Southern Oscillation Index (SOI):

Fig 2. The Southern Oscillation Index (as plotted by the Australian Government Bureau of Meteorology above) is based on the measured air pressure difference between Tahiti and Darwin. Sustained positive values are associated with stronger Pacific trade winds and are indicative of La Niña.
Record high temperatures during La Niña
Art then goes on to make a number of errors in his analysis of the relevance of this La Niña, and ENSO in general, for anthropogenic climate change. Although his wording is a bit vague, he seems to suggest that a La Niña can somehow erase anthropogenic heat accumulation:
"strong La Nina events drop the Earth’s average temperature around one degree Fahrenheit" "The most recent La Nina developed in the spring of 2007, and persisted until the early summer of 2008. The global average temperature fell one degree Fahrenheit in that period of time, equal to all of the warming of the last 100 years!"
Two points of correction:
- Global temperatures during La Niña tend to be about 0.1 C cooler than average (not 0.6 C as Art states; just look at the global temperature graph below).
- Global warming over the last 100 years was more like 0.8 C (not 0.55 C).
To state the obvious, the ENSO cycle is a primary driver of inter-annual climate variability, particularly global surface temperatures. I think the source of Art's confusion is that he doesn't understand the difference between instantaneous global temperature averages and longer term temperature trends (which is what climate change is all about). As I explained above, the observed cooling during a La Niña does not equal the warming over the last century (it doesn't even equal the warming over the last few decades). But that point is largely immaterial since when this La Niña phase ends, the instantaneous average will go back up to where the long term trend (or running average) lies, i.e., the cooling effect is temporary.

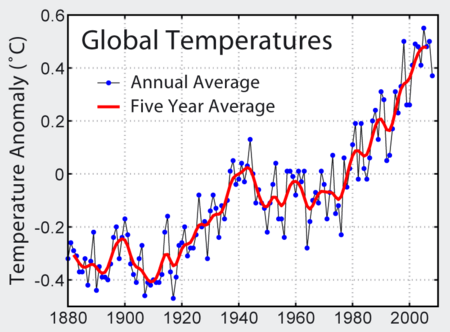
Fig 3. Instrumental record of global average temperatures as compiled by the NASA's Goddard Institute for Space Studies, from Global Warming Art.
Furthermore, this is all just quibbling about terrestrial surface temperatures, when all the action is in the ocean, which are absorbing >90% of the excess heat being retained by the greenhouse gas blanket (Fig 4). Only about 2% of the excess heat is going into warming the surface air.

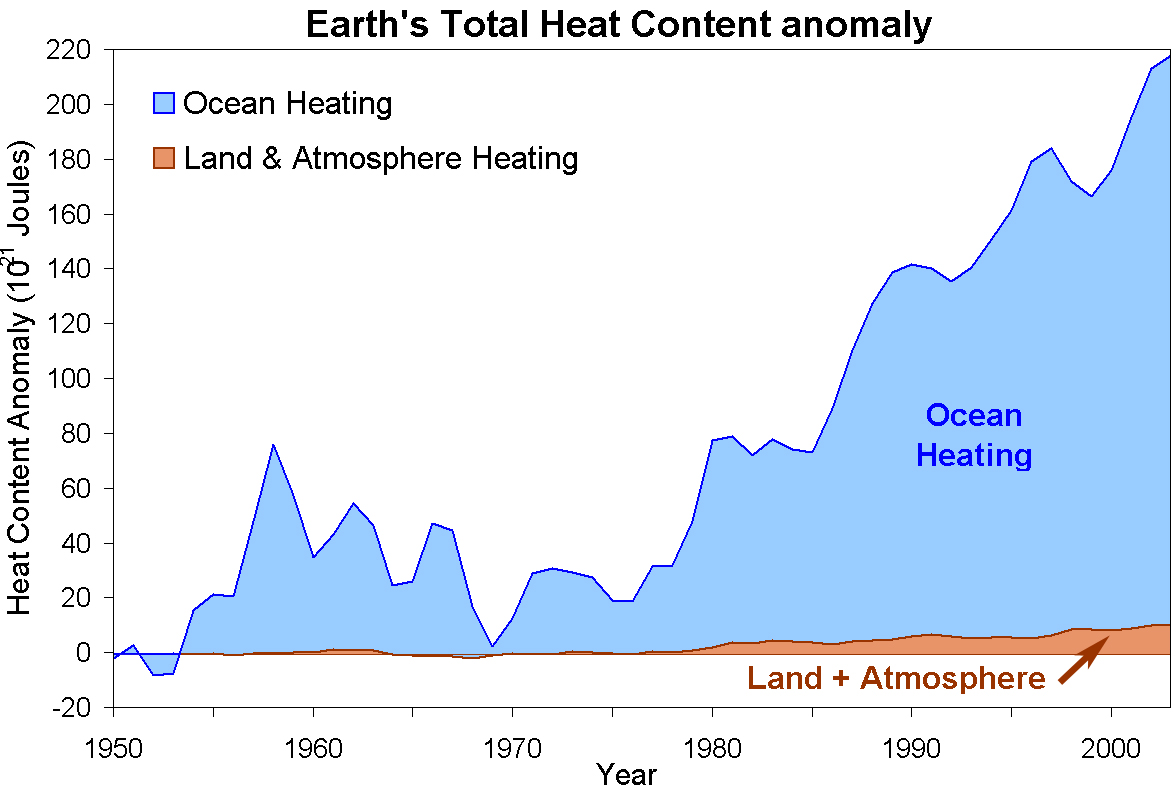
Fig 4. Redrawn by John Cook with data from Murphy et al 2009.
Mr. Horn also states "Many parts of the southern United States had record heat this summer" and "For the last year, the world has been dealing with the warming effects of a strong El Nino." Like the New York Times did in labeling 2010 "an El Niño year", Mr. Horn mistakenly asserts, albeit indirectly, that El Niño has dominated our weather this year. Lets take a look at what the global climate has been doing during the first six months of Art's "super" La Niña. The recent NASA GISS report "2010-How warm was this summer" states:
• June-July-August 2010 was the 4th warmest in the 131 year GISS analysis [for the northern hemisphere it was the second warmest]
• 2010 was a bit cooler than 2009 mainly because a moderate El Niño in the equatorial Pacific Ocean during late 2009 and early 2010 has been replaced by a moderate La Niña
• 8 of the last 10 summers were warmer than the 1951-1980 mean in the United States and Japan, and 10 of 10 in Europe. So if you are perceptive and old enough, you should be able to notice a trend toward warmer seasons.
• The global seasonal temperature anomaly for March-April-May in 2010 was the warmest in the 131 year GISS temperature data set
Furthermore, coral reefs are bleaching worldwide this year due to the anomalously high ocean surface temperatures. The result is extensive coral mortality in the Caribbean and SE Asia over the last two months.
NOAA's Global Climate Analysis for September 2010 states, quite remarkably, that:
"The global average ocean surface temperature for the period January–September was also the second warmest on record, behind 1998"
That is despite the facts that the El Niño that dominated the early months of 2010 was quite mild, the current La Niña is strong and this period of 1998 was warmed by the strongest El Niño of the last 100 years.
There is generally a 2-3 month lag before land surface temperatures respond to changes in ENSO, so it is reasonable to argue that the last El Niño could be in part responsible for the high global temperatures in May-July 2010. However, as Dr. Simon Donnor points out at Maribu, it is highly unlikely that the record breaking global temperatures of 2010 would have occurred in the absence of greenhouse gas emissions. This is especially true given the weakness of the last El Niño and the abruptness of the switch to a strong La Niña. (See the great discussion of this issue in relation to Moscow's 2010 record high summer temperatures on Open Mind here.)
No net warming since yesterday
Art Horn: "there has been no net warming or cooling since around 1999. Interestingly, the amount of carbon dioxide in the atmosphere has risen from 369 parts per million to 387 ppm (parts per million) during this time. This amount is above the level of 302 ppm in 1910, when 20th century global temperature started to rise. Despite this significant rise in carbon dioxide since 1999, there has been no “global warming” during this period."
Despite being thoroughly debunked, the "It hasn't warmed since 1998" meme is still alive and well in the denial-o-sphere. This argument is flawed in at least four ways: (1) it isn't true, (2) it is a great example of climate cherry picking, (3) it ignores the well-known role of ENSO in driving year-to-year climate variability and (4) it is a classic straw man fallacy in that it seeks to counter an argument that nobody is making: the (false) expectation of progressive annual warming, i.e., even if true, it wouldn't be relevant to the argument at hand.
Tomorrow we will see the sun with a chance of rain
Mr. Horn closes with a prediction: "Right now El Nino’s colder sister is on the fast track to generate more temperature extremes and a very cold winter in some parts of the world." At least about this, he is correct (but only partially, e.g., much of the US is actually typically warmer than usual during La Niña, Fig. 5). There will surely be record highs and lows over the next six months and a very cold winter somewhere on earth, possibly due to La Niña.
In fact, I'll up the ante and predict that this will be the case for the next 100 years. Anthropogenic climate change does not mean (or predict) progressive, homogenous warming everywhere. Some places are going have cold winters even a century from now. Cold records will continue to be broken (although with reduced frequency). There will likely be regions that cool, especially if ocean currents are altered, and we could see cool decades. Yet none of that will negate the warming effect of greenhouse gases on the atmosphere and oceans. So keep your PJs on Mr. Horn. A La Niña, no matter how strong, is just a natural cycle that is riding atop of a warming planet, and it certainly cannot erase decades of heat accumulation.

Fig. 5. Seasonal mean temperature trends for the United States during Strong La Niñas.
PS. Take a look at the comments to Art's piece and try to count the number of skeptic arguments. A quick scan revealed "It's freaking cold!" "It's cooling" "Al Gore got it wrong" "It's methane" "It isn't warming" "Warming ended" "It's the sun" "The Medieval warm period and those vikings" and "Ice age predicted in the 70s"

Arguments


The only difference is that those 3 consecutive La-Nina years came to mark the end of 3 decades of generally cooler and wetter weather where there were 25% more La-Nina years than El-Nino years and the IPO was continually in a negative phase, whilst now is being forecast as marking the beginning of another 3 decades pattern of similar conditions.
Still not the nicest I know but it does more accurately show how much ENSO affects global temp. You can see the 1998 El Nino introduced 0.7oC of heating. From the peak in 2007 to the low point in 2008 we can see ~0.6oC of cooling in a year.
ENSO seems to have a larger short term affect on temp than you are suggesting here. It's worth considering how much the recent El Nino has contributed to the possible record temperatures for 2010.
Also, the GISS temp data has become the outlier of all data sets. The 1200K radius is not effective at extrapolating air temperatures.
One of the reasons that the GISS is showing so high is it incorporates Arctic temps that are extrapolated rather then measured.
And also according to NOAA, this La Nina has recorded the fastest temperature drop of SST since records have been established. This is actually to be expected as Solar Cycle 24 seems to be sleeping.
Sure, if your'e interested in looking at the peak monthly low, then yes, the monthly data might be better. And why not look at daily temps? Or daily temperature in Jupiter FL? (my home town). The finer the spatio-temporal grain of the measurement, the greater the range of the values. Looking at monthly extremes isn't "more accurate". It is just a finer-grained comparison and inevitably yields a greater extreme value.
In an older version of the post I had a section speculating Art was doing exactly what you suggested: start at the peak and measure the difference to the following low. To me, this seems a stretch to use this measurement to quantify how much cooler temp is during La Nina. But I suppose it is important to clarify "how much cooler than what?" My relative value was the baseline/neutral point in the cycle/running average, i.e., I suggest using the cycle amplitude, while you are suggesting a peak to valley measure. Your suggestion is always going to be biased by the strength of the preceding cycle peak: a really strong El Nino high followed by a weak La Nina low, would, by your method, be misleading in suggesting the La Nina was very cold or greatly reduced global temperature. Seems like climate cherry picking to me.
Keep in mind though, it doesn't matter how great the amplitude of the cycle is, since it just sits atop of an increasing baseline. -JB
"Yes, the El Nino of 2009-2010 was the 2nd strongest according to NOAA." - Camburn at 12:34
Sorry, your'e both wrong. The 09/10 El Nino was "mild" according to NASA and was not even among the top 7 strongest of the last 50 years. Take a look at the NOAA MEI graph below and then tell me you want to argue the 09/10 El Nino was anything but mild-to-average:
Hate to quible, but the 2009-10 El Nino IS the second strongest since 1998. Your graph shows this.
Read the Murphy etal paper. The answer to your question is contained within the paper.
As far as GISS, it is the outlier amongst the big 4. RSS/UAH and CRU. The Arctic temps that GISS showed the summer of 2010 in the Arctic were approx 4.0C different than DMI temps. GISSTEMP uses one sensor, DMI uses hundreds.
The MEI plotted above can be hard to interpret. Eastern Pacific SS temperature anomolies were typically in the 0.5-1.5 C range (El Nino conditions hold when three consecutive 3 month running averages exceed 0.5). For comparison, anomalies in 1998 were >4.0 C over large at times.
I don't know where this notion that it was a strong El Nino comes from. Maybe its a misintrepretation of the phrase "strongest since 1998." Since El Nino's have a 4-7 year frequency, all that phrase boils down to is "it was the strongest since the one before last." Not as impressive.
This La Nina looks a whopper though. Wish I was out taking samples (though I'd probably get sea sick!).
Climate scientists plan campaign against global-warming skeptics
The American Geophysical Union plans to announce Monday that 700 researchers have agreed to speak out on the issue. The effort is a pushback against congressional conservatives who have vowed to kill regulations on greenhouse gas emissions.
http://www.chicagotribune.com/news/nationworld/la-na-climate-scientists-20101108,0,3784003.story
Evidence, please. The GISSTEMP trend (1979-present) is virtually indistinguishable from those in other temperature reconstructions. When I wrote this, it was actually identical to most other land/ocean temperature reconstructions (to within the nearest 0.01 C/decade). It's true that they all do bounce up and down from month to month, and right now GISSTEMP happens to show a microscopically larger trend than the other major temperature reconstructions:
NOAA NCDC: +0.163 C/decade
NASA GISS: +0.166 C/decade
UEA CRU: +0.158 C/decade
RSS LT: +0.164 C/decade
UAH LT: +0.140 C/decade
Insofar as there is any "outlier", it's obviously UAH. In any case, the 1200km smoothing radius used by GISS is just fine. Again, see here for a debunking of many myths about the surface temperature record.
1972-1973
1982-1983
1987-1988
1991-1992
1997-1998
That aside, Camburn should think hard about this comment by scaddenp:
More interesting is that La Nina temperatures are now warmer than El Nino temperatures of similar magnitudes in previous decades.
Yes, exactly. What is now considered a "cold" year (say, 2008) would have been a record warm year any time before 1998.
I do get fed up with this stuff about 'there was record cold somewhere'. Climate change is not like a key change in a piece of piano music - you don't just shift everything up a tone or a third so that everything is the same just with each note played a bit further up the keyboard.
Great point, I totally agree. And perhaps why we are seeing coral bleaching during a La Nina. (although there are alternative explanations)
I think adelady's point with her music analogy was the common misconception that everything will continue as usual in a warming world with no ill consequences, just warmer. I.e., no synergistic or systemic issues worsening things, no tipping points, no population collapses, etc. And at some point you run out of keys...
But what do I know, I'm basically tone deaf. :)
PS: Thanks for the excellent post!
The Yooper
Impacts of recent El Nin˜o Modoki on dry/wet conditions
in the Pacific rim during boreal summer
Abstract
Present work uses 1979–2005 monthly observational
data to study the impacts of El Nin˜o Modoki on
dry/wet conditions in the Pacific rim during boreal summer.
The El Nin˜o Modoki phenomenon is characterized by the
anomalously warm central equatorial Pacific flanked by
anomalously cool regions in both west and east. Such zonal SST gradients result in anomalous two-cell Walker Circulation over the tropical Pacific, with a wet region in the central Pacific. There are two mid-tropospheric wave trains passing over the extratropical and subtropical North Pacific.
They contain a positive phase of a Pacific-Japan
pattern in the northwestern Pacific, and a positive phase of a summertime Pacific-North American pattern in the northeastern Pacific/North America region. The western North Pacific summer monsoon is enhanced, while the East Asian summer monsoon is weakened. In the South Pacific, there is a basin-wide low in the mid-latitude with enhanced Australian high and the eastern South Pacific subtropical high. Such an atmospheric circulation pattern favors a dry rim surrounding the wet central tropical Pacific. The El
Nin˜o Modoki and its climate impacts are very different from those of El Nin˜o. Possible geographical regions for dry/wet conditions influenced by El Nin˜o Modoki and El Nin˜o are compared. The two phenomena also have very different temporal features. El Nin˜o Modoki has a large
decadal background while El Nin˜o is predominated by
interannual variability. Mixing-up the two different phenomena may increase the difficulty in understanding their mechanisms, climate impacts, and uncertainty in their predictions.
So in a way it's correct, I think your post should clarify the difference. In annual terms it's far smaller, but from an El Nino peak the difference can be 0.6 ° C.
As mentioned above, when the next big El Nino hits, and the solar cycle has gained some momentum, it will get warm. Quickly.
We all know that next year will see a drop in global temperatures, but that is meaningless by itself. Many Skeptics will rejoice and the AGW crowd will talk about 2010 being the warmest year ever.
The real effect of the ocean cycles is to confuse the data and allow either side to take advantage of the current phase. That is not helpful to anyone.
The real focus of both sides should be to ignore the understood variations and determine what the climate is doing. Triumphing understood anomalies because the results are what is desired ends up discrediting the significant results.
Already my location in the US is far ahead of normal precipitation for this time of year. 25% of the monthly rainfall happened yesterday. That is a La Nina effect for my location. I do not triumph the cooler, wetter weather as proof that no global warming is happening, but accept that it as part of a natural cycle.
John Kehr
The Inconvenient Skeptic
(As you probably know), more precipitation is not quite a disproof of AGW, rather the opposite as a warming atmosphere can hold more moisture.
ENSO and AMO are not _causes_ of heating and cooling, just as seasonal cycles and nightfall / sunrise aren't. They are cycles, they are just longer as well as less regular than seasonal or overnight or tidal cycles.
It's what happens within those cycles that matters.
Before we "all" can agree on next year, what do you mean by "drop in global temperature" ? Compared to this year ? Last year ? The average, of some form ? Please explain.
As for the "Skeptics", they rejoice at any poorly-understood figure, whether it be temperature, ice extent, ocean heat, etc., so no change there. As usual, it will be best to ignore them.
Who can tell whether 2010 will be the warmest year ? If it is, at least it will stop the so-called skeptics from using one of their zombie arguments - "global warming stopped in 1998" - although, I suppose, they will then move on to "global warming stopped in 2010"...
Fair enough. I am willing to, although doesn't the comments section sufficiently clarify that? I am starting to view the comments section on SS and on many other sites including skeptic sites as a form of post publication review, like PLoS One does formally and the scientific community does informally.
Another example is adelady's point that El Nino and La Nina are not causes of warming/cooling per se, they are defined as warming/cooling as driven by a natural cycle, i.e., they don't cause the phenomena, they are the phenomena, and the proximate causal mechanism is trade winds, etc.
Back to broader question: should such (valid) points from any perspective be incorporated into the formal post? Or would that be redundant? (it would also make the comments section confusing, since they would no longer be relevant to the post)
Yes, it's part of a natural cycle that is superimposed on top of a long-term anthropogenic warming trend. Consider the most recent La Nina episode (2008) -- it was the second strongest since the 1970s. One would normally think of La Nina years as "cold", and indeed 2008 was the coldest year of the past decade ... but it was still warmer than any year before 1997-1998.
That is precisely the pattern that you would expect to see with a natural cycle (ENSO) superimposed on a long term rising trend. The troughs of the cycle are now higher than the peaks were previously.
In 2050, with the trend firmly upwards until then, there will be guys saying "it stopped warming in 2048".
That way the original post isn't rewritten and the comments can still be tracked back to the text, but any major issues raised in the comments are covered so people don't have to read the entire comment stream to find out whether they should raise it themselves. Obviously this would only apply to somewhat involved concepts... spelling errors and the like can always just be corrected in the text.
On those temperatures, a question... as Ned pointed out, the UAH temps appear to be an outlier at +0.14C per decade, but I believe that value is for tropospheric, not surface, temperatures, so to compare them is apples to oranges.
I also believe that I've read that the conversion factor is roughly 1.2, so +0.14C/decade troposphere equates to a surface change of +0.168C (pretty close to NASA GISS at +0.166C).
Which gets to my question. I believe I've read that the conversion factor is 1.2, but when I run my own regression on the data from AMSU (which only runs from 2002 to the present), depending on the smoothing period, then I get a factor anywhere from 1.53 to 1.56, with a pretty good R2 of anywhere from .95 to .96. That would turn the UAH +0.14C into +0.217C surface anomaly, making it an extreme outlier on the high end.
The question: What is the appropriate conversion factor, and if it is 1.2, where did it come from? And does the higher conversion factor that I'm finding in the last decade point to another change in the system, where a warmer world sees a higher discrepancy between the surface and the troposphere?
Excellent observations. The unusually high AMSU channel 5 temps., given the circumstances, are for obvious reasons proving to be somewhat of a headache for "skeptics".
As for the conversion factor, that is not my field of expertise. But Dr. Gavin Schmidt might be able to help you out. Were you regressing the Channel 5 data against the surface GISTEMP data, or all surface data (i.e., including over the oceans)?
Please let us know if Dr. Schmidt gets back to you.
Perhaps the difference lies in what the AMSU near surface data actually represents. I'm not well informed on that particular detail.
Thanks. I'm no expert on this either, but if I were using the RSS data (which, as you know, is much more reliable) I'd use their TMT data. The RSS page has a nice figure showing how the weighting works for different channels,I am not aware of such a figure for UAH.
For UAH, one could regress the AMSU ch 5 or ch 6 against the near-surface surface data. But Spencer had something up on his page a while ago about problems they are experiencing with splicing/comparing the near-surface layer data because of orbital changes.
I could be remembering incorrectly, but I recall that the conversion factor in the past has been calculated between the SAT record and mid-tropospheric temperatures (i.e., using independent data)...but Drs. Schmidt, Santer or Sherwood would likely be the go to persons on this.
This comes from analysis of the results from GISS's GCM. Basically, Gavin Schmidt says that the model results show amplification of warming trends in the lower troposphere -- in the model, the LT generally warms at a rate 1.2 times faster than the surface. (That's the global average -- over the oceans, the LT warms 1.4 times faster than the surface, but over land it's 0.95, meaning that the surface warms faster than the LT).
Thus, Sphaerica, if you assumed that the UAH LT trend of +0.14 C/decade is actually correct, and if you assume that the amplification shown in GCMs is correct, then the surface ought to be warming at only +0.12 C/decade (0.14 divided by 1.2).
However, there are some obvious problems with this. First, and foremost, the land needs to be warming faster than the ocean, and the sea surface temperature trend itself is at least +0.12 C/decade. (Note that SST is measured by satellite -- no UHI there -- and is very well validated, so this number should be considered reliable).
This is a real puzzle, IMHO. Either the satellite LT trends are erroneously too low, or the surface (incl ocean) trends are too high, or there isn't as much tropospheric amplification as GCM results suggest. Or some combination of all of the above ...
It's worth noting that RSS is a substantially better fit than UAH in this respect. The RSS Lower Troposphere trends are as follows:
Land+Ocean: 0.16 C/decade
Land: 0.20C/decade
Ocean: 0.15 C/decade
Dividing those by the amplification factors of 1.2, 0.95, and 1.4 respectively, gives the following predicted surface trends:
Land+Ocean: 0.14 C/decade
Land: 0.21C/decade
Ocean: 0.10 C/decade
These are just a bit lower than the observed surface trends of
Land+Ocean: 0.15 - 0.17 C/decade
Land: 0.20 - 0.30 C/decade
Ocean: 0.12 - 0.14 C/decade
In other words, assuming the LT amplification factors behave as Gavin thinks they should, then either the RSS LT record is just a little too low, or else the various met station and sea surface temperature records are all just slightly too high.
Thanks for the info.
I'll have to look at the RSS data. I actually think that part of the problem is that I misinterpreted the 1.2. My factor of 1.54 (or 1.55) is used to convert the LT temp into a corresponding surface temp, e.g. Ts = (1.54 * Tlt) - 134.16 for 30 day smoothing, and it does so with a fairly high correlation.
But the two numbers aren't the same thing. My 1.54 factor converts a tropospheric temperature to a near surface temperature. The 1.2 (in the other direction) converts a tropospheric anomaly to a near surface anomaly, a completely different animal.
The flaw lies in my misunderstanding, and my erroneous assumption that if LT temp (over a short timespan, only 2002 to 2010, or 8 years, for with UAH data was available) closely ties to surface temps, then the anomaly would as well, and to the same degree, but that assumption is clearly false, and unwarranted.
On balance, the observations are reasonably consistent with the modeled amplification factors, but it's not absolutely nailed down either. Whatever minor corrections may or may not occur from further observation, climate sensitivity will still be roundabout 3.
"The science shows that there has been no warming for ten years. All data show this. We are in the eighth year of cooling, however carbon dioxide levels continue to rise. There has been no correlation between the two for ten years nor was there any correlation with temperature from the mid 1940's to the late 1970's when the global temperature data show decades of cooling. "
Horn then goes on...
"Climate modelers are not forecasters. They have no real world experience in makeing predictions. They have never known what it is like to fail because their predictions won't verify for 50 to 100 years. If there is no fear of failure there is not limit to what you will forecast. Computer models have many flaws that even the modelers will admit but they also create and maintain careers and funding. A climate model can be tweaked to give you the result you want or need."
In another post, he talks about his program for high school students that he's trying to sell.
"The program I have for high school students is called "Understanding Global Warming" This hour long powerpoint show gives the students a look at the science of this issue. Newpapers, magazine, television shows, news programs and movies have their own point of view of global warming with the intent of increasing their audience. My program cuts to the heart of the matter with real world data and observations. Powerful forces of nature have controlled the climate in the past and are continuing to do so today. Computer models are the only evidence that humans affect the climate and computer models are not evidence. I will demostrate clearly with vivid graphics how computer model foreasts are not able to predict the climate 50 to 100 years in the future. In fact they can't even "predict" the climate of the past. The warming of the climate is nothing new nor is the current warming unusual or unprecedented. In fact the earth has been warming for some 300 years since we began coming out of the "Little Ice Age" that dominated the earth from about 1400 to 1850. The melting of glaciers is used by some to say "See the glaciers are melting and we are doing it!" but the melting of glaciers is nothing new, they have been melting and at time advancing for 250 years. Long term changes in solar activity have a strong relationship to global temperature and in this program you will come to understand this. All five data centers that track global temperature show no global warming for 12 years. The earth is now in it's eighth year of global cooling. Changes in the sun and the oceans are causing this. Today's students will soon be tomorrow 's voters and they will need to know the science, not the politics of this major issue to make educated choices. My program will give them that.
Please feel free to email me for availibility and cost."
http://arthorn.theartofweather.com/
The line that begins "Today's students will soon be tomorrow's voters" is especially amusing.
John i think your being silly in the first paragraph, I'm not sure what point you're making with it other than sarcasm.
Fig 3 still remains an extraordinarily poor choice when trying to look at the variation in global temp introduced by ENSO. I'm not really interested in peaks and troughs and cycle averages it's much simpler than that. Global mean temp is the favoured metric in climate science, I'm interested in what sort of variability the ENSO sytem introduces into that metric, It seems fair to say that if we take 1998 as an example ENSO can introduce upto 0.7oC change to the global mean surface temp in a very short time period, that seems like a fairly solid fact, I don't really understand your objection to it.
I don't get your cherry pickings suggestion, other than to think it's just a knee jerk response from an alarmist who thinks he's trying to put down a denier. Maybe you should write to CRU and NASA GISS to let them know their mean monthly global temperature records are not acceptable.
I'm happy to agree with you for now that ENSO doesn't have any affect on long term trends but it does impact in the short term in a big way (potentially as big as whatever is driving the longer term trend). So any short term descriptions of the global temp need to be seen in this light. So those descriptions from the NASA GISS report "2010-How warm was this summer" should all have explanations of how El Nini is influencing them. Obviously they don't because any description of natural variability would confuse the message. Whether 2010 turns out to be the hottest year on record is now largely going to depend on whether the present La Nina will start impacting on global temp enough before the end of the year. The fact that 2010 is is in line for hottest year ever is in part due to the lingering effect of the most recent El Nino.
"Gosh, will these guys draw the "it's cooling" argument at every La Nina? Even in the middle of a record-braking 2010?"
Erm Alexandre heres the ENSO index for the past 5 years.
and here's the mean monthly global temperature.
It looks like La Nina do introduce short term period of cooling it seems wrong to suggest otherwise. Did you read Art's article? It seems like a fair description of La Nina. In the bit were he strays into global warming territory what he actually says is there has been no nett warming or cooling since 1999, you are mis-representing him. I guess it makes your eye rolling dismissal of him much easier that way.
http://wattsupwiththat.com/2010/11/09/david-whitehouse-the-climate-coincidence-why-is-the-temperature-unchanging/#more-27622 ?
I know it's been written by a chap from a think tank with a particular view but he does seem to be writing from a perspective of knowledge. Is he right, wrong or spinning the facts?
The post you mention is just a lot of handwaving. There aren't really any facts in the post. His argument is as follows:
(1) He claims that temperature has been "flat" for the past 15 years.
(2) He then suggests that it would be implausible for natural coolings to have exactly counteracted the supposed anthropogenic warming trend.
(3) Therefore, he implies that there's something "suspicious" going on (presumably, that AGW is a hoax).
But that argument is wrong from the very start. Temperatures haven't been flat for the past 15 years -- in fact, they've risen faster during this period than they were before.
Here's a plot of satellite-measured temperatures from RSS:
Note that during the period when Whitehouse claims that temperatures have been "flat", they actually rose at exactly twice the previous rate (0.131 vs 0.065 C/decade).
Basically, Whitehouse's post over at WUWT is just spin. There's no substantive content at all, except for a false claim about the global temperature trend.
Frankly, as WUWT posts go, that one isn't even especially interesting. Most of the nonsense that Anthony's site propagates is at least much more "creative" than that!
Short answer: he's full of crap. Selling snake oil.
1. Whitehouse cites no specific sources for any of his claims about temps...argument by assertion.
2. He executes a standard display of the Gish Gallop. One could spend days countering the myriad ways of the litany of errors he introduces.
Louise, you can trust someone writing a column on a blog who speaks calmly and rationally, but whose point is that everything the experts in the field are saying is wrong, just trust him.
Or, you could trust the experts. Who show their data and their work publicly. NASA, NOAA, GISS, etc. It's all there, for the world to see and evaluate.
Don't trust the details to blogs - even this one. Go to the source, the experts themselves (whatever the field) for expert opinion.
Blogs such as the one you cite exist to tell you what to think. Think for yourself. You already do, that's why you came here with your question. That's the beauty of the Internet generation: we no longer need to take someone's word on anything. We can find out the details and the truths ourselves, if we are inclined.
I spent several years digging into the field, reading all of the core literature and studies before making my own mind up on what to belief. I chose verifiable science. And to help others learn for themselves.
Aw, crap. Ned beat me to it. Must type faster then me.
Anyway, hope this helps,
The Yooper
Louise, I should add that most of the comments following that WUWT post are, as usual, remarkably confused and misinformed. Anthony Watts is doing a terrible disservice by promoting and encouraging all that nonsense.