Measuring Earth's energy imbalance
Posted on 20 September 2009 by John Cook
When the Earth is in energy imbalance, with more energy coming in than radiating back out into space, we experience global warming. How do we know if there's an energy imbalance? This can be determined empirically in two ways. Firstly, by using satellites to directly measure the difference between incoming energy from the sun and outgoing radiation from the earth. Secondly, by adding up the energy content of the atmosphere and ocean over time. The newly published paper An observationally based energy balance for the Earth since 1950 (Murphy 2009) does both.
Adding up the Earth's energy content
To calculate the Earth's total heat content, the authors took data of ocean heat content from the upper 700 metres. They included heat content from deeper waters down to 3000 metres depth. This is not insignificant - the heat increase in waters deeper than 700 metres is around 40% of the heat increase in waters from 0 to 700 metres. They computed atmospheric heat content using the surface temperature record and the heat capacity of the troposphere. Land and ice heat content were also thrown into the mix.
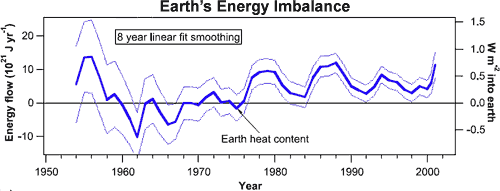
A time history of the energy going to heat the Earth requires differentiating the heat content. As the heat content data was too noisy for single year differences, successive linear fits were performed to running 8-year segments of data. Eight years was chosen as it's the longest period that still separates the dips due to the El Chichon and Mt. Pinatubo volcanic eruptions. The resultant energy imbalance time series is seen in Figure 1:

Figure 1: Time history of energy flow into Earth's climate, calculated from the derivative of the Earth's heat content using Domingues 2008 for upper ocean heat (Murphy et al. 2009).
We see that since the mid 1970's, the planet has been in positive energy imbalance. This is consistent with satellite measurements which also find more energy coming in than radiating back into space. This energy imbalance is what is causing global warming.
Empirically calculating climate sensitivity
Climate sensitivity is an expression of how much global temperature changes for a given radiative forcing. The general consensus of peer reviewed estimates of climate sensitivity (both modelled and empirically determined) tend to cluster around a global warming of 3 ± 1°C for doubled CO2.
As the ERBE and CERES satellites measure the net energy imbalance, this data can be combined with temperature records to place constraints on climate sensitivity. Because the ERBE satellite record covers only 15 years, it doesn't encompass slower feedback processes such as receding Arctic sea ice. Hence the data provides only a weak upper bound of climate sensitivity (a maximum of around 10°C warming for doubled CO2). However, the analysis rules out climate sensitivities lower than 2°C. This finding is consistent with the general consensus estimate of climate sensitivity (in addition, the author Dan Murphy informs me he's currently doing follow-up work to calculate a more precise lower bound).
Cumulative energy budget
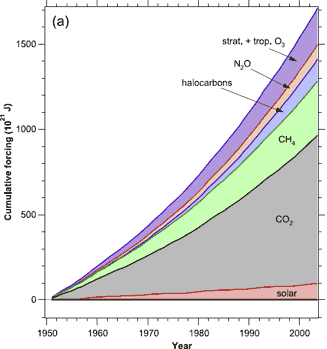
Possibly the most interesting section of the paper (at least to me) is analysing the various contributors to the energy imbalance and where the energy is going. Figure 2 shows the sum of positive, long-term climate forcings.

Figure 2: Cumulative energy budget for the Earth since 1950, showing mostly positive and mostly long-lived forcing agents from 1950 through 2004.
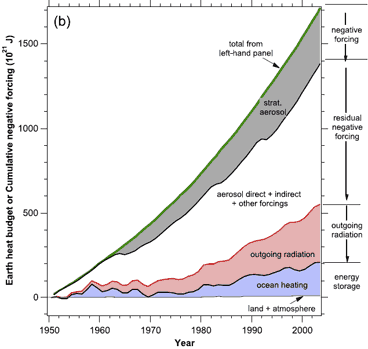
To close the energy budget, the authors also calculated how the positive forcings have been balanced by various negative forcings, as seen in Figure 3. Note that outgoing radiation is on the increase - another indication that the planet is indeed warming and consequently radiating more energy back into space.

Figure 3: Cumulative negative forcings such as stratospheric aerosols, direct and indirect aerosol forcing, increased outgoing radiation from a warming Earth, and the amount remaining to heat the Earth.
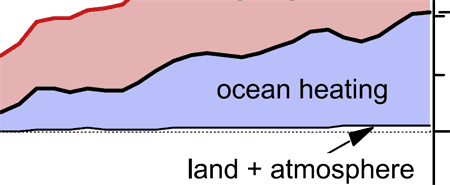
Of particular note is comparing the heat capacities of the land and atmosphere to the heat capacity of the ocean. The land and atmosphere contribution is not even visible in Figure 3 so here is a magnified look at the bottom corner of the graph:

Figure 4: cumulative energy storage of the ocean compared to land + atmosphere.
It's worth remembering that global warming occurs over the entire globe - land, atmosphere and oceans. Consequently, to focus on one very small piece of the puzzle (eg - surface temperatures) while ignoring the larger picture can lead to misguided conclusions.
Internal variability is apparent in the surface temperature record - a measure of atmospheric heat content. This is no surprise from an energy budget point of view. Small changes in heat transfer into or from the ocean into the atmosphere can create significant changes in surface temperature. But when you look at the entire planet's heat content, a clearer picture emerges. The planet is steadily accumulating heat due to its energy imbalance.


 Arguments


No, the energy coming in isn't increasing. In fact, that's another important point to make. We have satellite measurements of incoming solar radiation and it shows little to no long trend over the past 50 years. What is happening is the energy coming in is relatively constant but the energy radiating back out into space is being partially trapped by increasing greenhouse gases. Hence less energy going back out = energy imbalance.
In fact, the paper explains some of the basics of this process by imagining what would happen to global temperatures if there was a sudden increase in greenhouse gases (a hypothetical simplified situation for the purpose of understanding the physics involved):
If greenhouse gases suddenly increased to a new level, the planet would suddenly be in energy imbalance. The energy out would be less than the energy in and the planet would start accumulating heat. Hotter objects radiate more energy. Therefore, as the planet gets hotter, it radiates more energy so the energy imbalance lessens. Eventually the planet will have accumulated enough energy so that the energy out approaches the energy in. Eg - the system approaches equilibrium.
This is why we talk about there being 'warming in the pipeline'. Even if we completely stopped all our CO2 emissions right this moment, we would still be left with a significant energy imbalance. It would take several decades of warming before the planet reached equilibrium. And that's a best case scenario. Of course we're not going to immediately stop CO2 emissions so the energy imbalance will only increase in the years to come.
I tried explaining this process in the Climate Time Lag post but people seemed confused there too - I might have to rework my explanation of the whole process :-)
Aerosol forcings are one of the major areas of uncertainty with climate models. So what this paper does is place empirical constraints on aerosol forcing by working out the total energy imbalance, then pruning away other forcings that we know with greater certainty. What is left is "aerosol direct + indirect + other forcings".
If you'd like the full paper, contact me and I'll email it to you.
1. I intentionally don't go into much detail on what's causing the energy imbalance (apart from touching on it briefly in Figure 2). That's a topic for a future post or two (or more). I'm taking baby steps here - just to accept that there's an energy imbalance is a big step for some :-)
2a. The increasing energy imbalance since the 1950's cannot be a lag effect. In my response to Comment #1 and the climate time lag post, we see that if there's a change to the planet's energy imbalance (eg - increase in solar activity, increase in greenhouse gases), the planet will gradually approach equilibrium. This is not the case here - we're seeing the energy imbalance actually increasing in time since the 1950's.
2b. Figure 1 is based on direct empirical observations of heat content. Narry a model is seen or used. Figure 2 is based on radiative line-by-line calculations, not climate models - nevertheless I only touch on this in passing as my main point is the overall energy imbalance, not the individual contributors. The various factors of Figure 3 are all calculated from empirical observations apart from stratospheric aerosol forcing which again is calculated from radiative line-by-line calculations. Nevertheless, my main point from Figure 3 is to compare the heat capacity of ocean to atmosphere which is hardly a controversial point to make.
3a. Ocean/land/atmosphere heat content is based on empirical measurements. Modelling or greenhouse gas assumptions are completely irrelevant. We're talking about direct observations here. With all due respect, thingadonta, you need to switch off the cognitive dissonance here.
3b. Sorry, I've been unable to find a link to the paper online yet, it was emailed to me. If anyone would like to read the full paper, contact me and I'll email it to you.
Question 1. The correlation between CO2 and temperature is not meaningless. It's not a mathematical abstraction but grounded in physical reality. The earth radiates infrared (or longwave) energy back out to space. Atmospheric CO2 absorbs the longwave radiation, some is turned into heat and some of the longwave radiation is radiated back down towards earth. So this will have a direct effect on atmospheric temperatures hence the correlation.
I'm not trying to downplay surface temperature record, just put it in it's proper context. It's important to realise that atmosphere is just one small piece of the climate puzzle. Much of that longwave radiation that gets radiated back down to earth is absorbed by the ocean. Figure 3 reminds us that the ocean has a much great heat capacity than the atmosphere. Then you have internal variation from phenomena like El Nino where the ocean exchanges heat with the atmosphere. This internal variation is superimposed on the long term warming trend caused by the energy imbalance. Internal variation doesn't add any extra energy to the planet - it just moves the energy around. This is the point I make in my post on short term CO2 correlations.
In my post on long term CO2 correlations, I make the point that CO2 is not the only forcing that affects climate. You have solar variations, stratospheric aerosols (from volcanoes), methane, ozone, etc. Figures 2 and 3 are good reminders of this, even breaking down the various components based on empirical measurements.
Question 2. Not sure about this, still wrapping my head around that part of the paper but in the part of the paper I think you're looking at (Section 3. Surface temperature and radiation), I don't think he's talking about outgoing radiation but net radiation balance. I could ask the author about it but I've nagged him enough asking questions and requesting data (to be used in an upcoming post), I don't want to push the friendship! Feel free to follow up with the author yourself :-)