Climate Science Glossary

Term Lookup

Enter a term in the search box to find its definition.

Settings

Use the controls in the far right panel to increase or decrease the number of terms automatically displayed (or to completely turn that feature off).

Term Lookup

Settings


All IPCC definitions taken from Climate Change 2007: The Physical Science Basis. Working Group I Contribution to the Fourth Assessment Report of the Intergovernmental Panel on Climate Change, Annex I, Glossary, pp. 941-954. Cambridge University Press.

Home Arguments Software Resources Comments The Consensus Project Translations About Support

Twitter Facebook YouTube Mastodon MeWe

RSS Posts RSS Comments Email Subscribe


Climate's changed before
It's the sun
It's not bad
There is no consensus
It's cooling
Models are unreliable
Temp record is unreliable
Animals and plants can adapt
It hasn't warmed since 1998
Antarctica is gaining ice
View All Arguments...


Username
Password
New? Register here
Forgot your password?

Latest Posts

Archives

Putting a new finger on climate change

Posted on 4 March 2011 by Daniel Bailey

It's a settled fact that the world is warming and is generally accepted that humans have contributed to the majority of the warming, especially since about 1980.

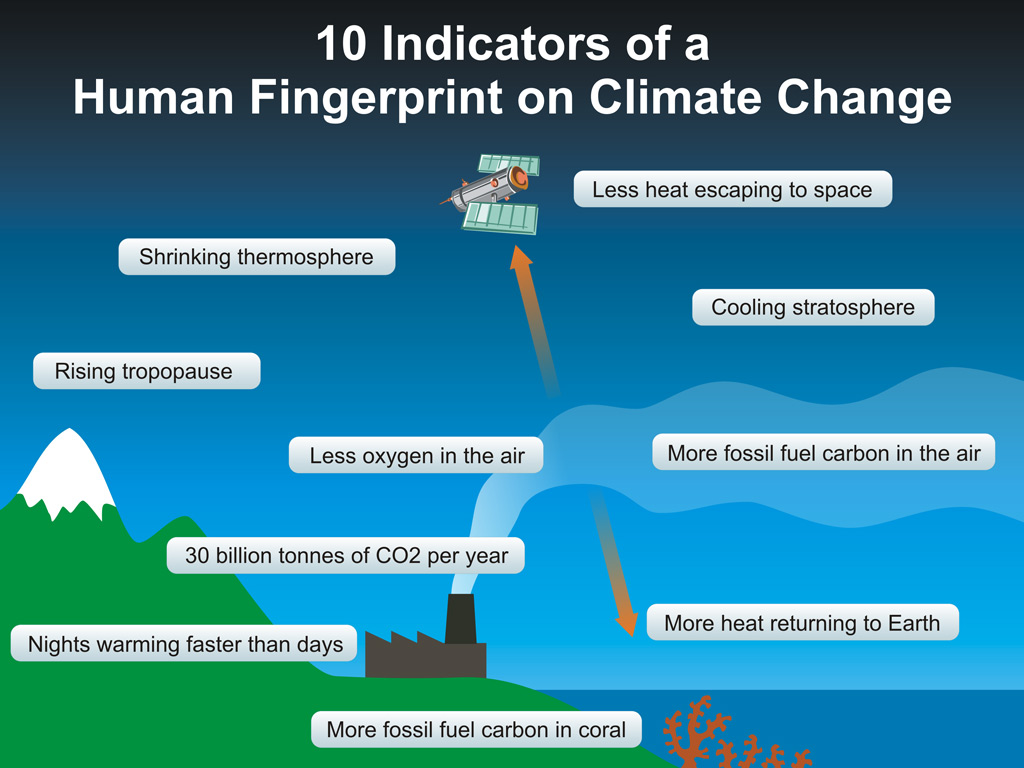
Previously here at Skeptical Science we've looked at 10 Human Fingerprints on Climate Change.

Now a new report from the Weizmann Institute of Science establishes another: Paper.

Paper Archives Reveal Pollution's History

Some of the history preserved in old books and newspapers may be hiding in between the lines of print. A Weizmann Institute scientist has found that the paper in such collections contains a record of atmospheric conditions at the time the trees that went into making it were growing.
 
 Gutenberg BibleBy analyzing the carbon isotopes in bits of paper clipped from old magazines, Prof. Dan Yakir of the Environmental Sciences and Energy Research Department in the Faculty of Chemistry has traced the rising effects of atmospheric pollution from burning fossil fuel going back to beginnings of the industrial revolution.
Declaration of Independence
 
Scientists generally reconstruct the record of past climate change from such sources as ice cores or tree rings. But a reliable tree ring history, says Yakir, requires an analysis of quite a few trees.
“Rather than going to forests all over the world to sample trees,” says Yakir, “we went to the local library.”
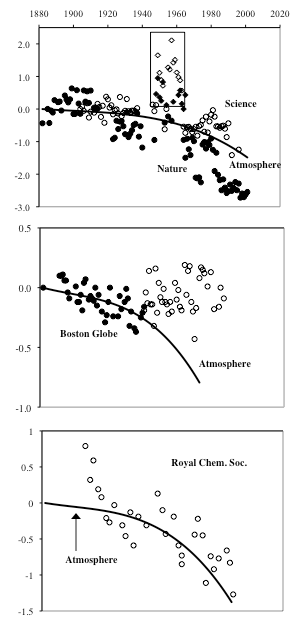
In the Weizmann library’s archives, Yakir found issues of the scientific journals Science, Nature and the Journal of the Royal Chemical Society going back over 100 years to the late 19th century. Removing small samples from the margins of successive volumes, he took them back to the lab for analysis.
 
The analysis was based on a finding that the proportion of a carbon isotope – carbon 13 (13C) – to its lighter counterpart – carbon 12 (12C) – could provide information on the CO2 added to the atmosphere from burning fossil fuel. This is based on a cycle that begins with plants taking up CO2 in photosynthesis. All plants prefer to use CO2 made with the more common version of carbon, 12C, than the slightly heavier 13C. Plant biomass from millions of years ago was transformed into reservoirs of oil, gas and coal, and so these are naturally low in 13C, as well. When we started to burn those reservoirs following the industrial revolution, we began returning the 13C-poor CO2 to the atmosphere.
 
Keeling
 
Recent CO?2? concentrations and emissions (IPCC AR4 WG1). (a) CO?2? concentrations, (b) Annual global CO?2? emissions from fossil fuel burning and cement manufacture
Now the atmospheric 13C content has become increasingly diluted, and this is reflected in the carbon ratios in the trees milled for pulp and paper. Yakir’s work shows that this continuing dilution is, indeed, clearly recorded in the archival paper and, plotted over time, it demonstrates the increasing intensity of our fossil fuel burning in the past 150 years.
 
This project has been ongoing for about 14 years, with figures from new issues added over time. In the process, says Yakir, he has had to learn something about the paper industry. Some early issues, for instance, had been printed on rag paper (made of cotton, flax, etc.) rather than wood pulp, while blips in the data around the time of WWII led Yakir to suspect that the paper was either recycled, or again supplemented with rag content to make up for wartime shortages.
 
Anomalies aside, 13C levels in the paper, especially for two of the journals, were a good match for existing atmospheric records, and even revealed some local phenomena, including differences between American and European records. In addition to alerting climate scientists to a very well organized, untapped, source of global change records, says Yakir, the technique could be used to authenticate antique paper samples.
 
 
10 fingerprints: Make room for Number 11 (gonna need a bigger glove).
 

Suggested Resources For Beginners


Other Related Posts at Skeptical Science


Image Credits

  1. Gutenberg Bible (Wikimedia Commons)
  2. US Declaration of Independence (Wikimedia Commons)

0 0

Printable Version  |  Link to this page

Comments

Comments 1 to 20:

  1. At some point we'll probably want to differentiate between fingerprints like this one which indicate that humans are responsible for rising CO2 levels and fingerprints which indicate those rising CO2 levels are responsible for significant/observed global warming. At this point I think it is really only the completely clueless (though that is sadly not a small group) who question that humans are causing CO2 levels to rise. On the other hand, you still have people like Spencer denying that humans are responsible for much of the warming observed thus far... despite fingerprints (e.g. faster warming at night) directly contradicting his alternate explanations.
    0 0
  2. Daniel, Interesting, and a great study that seems approachable. I got lost though, in why there is more CO213 now than there was then? And what do the pink and blue lines in your top graph tell us? That we have less free O2 in the air because we are burning C and adding O to create C02?
    0 0
    Moderator Response: [DB] The pink & blue are from different locations, showing the decline of global oxygen levels as more fossil fuel CO2 is injected into the global carbon cycle, locking up oxygen atoms with the carbon atoms. A solid confirmation that "it is us". The study referenced above uses paper from dated issues to derive these ratios; see here for their results. Good questions. (Edit: Sorry for the screw-up; was bleary-eyed from 2 posts in 1 day; the portion of the graph in question concerned the O2 levels, not the Carbon isotopes as I previously wrote)
  3. Meant carbon13 vs carbon 12 above.
    0 0
  4. actually thoughtfull. I'm not 100% sure, but the reason I recall is that naturally occurring CO2 has roughly equal amounts of heavy & light CO2-which is then taken up by plants & trees. However, in the case where that CO2 was taken up *hundreds of millions of years ago*, all the heavy carbon will have decayed, leaving behind only the light CO2. So when you chop down & burn a tree which is only a few hundred years old, you'll get a relatively even mix of isotopes, but when you burn coal or oil, you'll get nothing but light CO2. Hope that explains things.
    0 0
  5. Marcus - thank you that explains that very well. And then when we tested nukes on the surface we messed up C12/C13 ratios again?
    0 0
  6. @actually thoughtful and Marcus, DB explains the carbon isotope ratio in the post, but some further clarification might help. C12 and C13 are the stable isotopes of carbon. The ratio C13/C12 is about 1% on earth (C14 is much less abundant. It is radioactive and is used for dating biological materials, but it is not the subject of the post.) Since plants have a preference for C12, biological materials are enriched in C12. Consequently, the ratio C13/C12 is smaller in fossil fuels than it is in the atmosphere and burning of fossil fuels ought to dilute C13 in the atmosphere. The figure confirms that expectation. (The red scale in the figure is inverted. Although the red curve goes up to the right, the ratio C13/C12 is decreasing with time.)
    0 0
  7. Ah thanks for that Jeff T. Though I was of the understanding that radioactive decay is also the reason for the increasingly "light" CO2 in the atmosphere-& how we can tell CO2 produced from burning coal over that produced by burning wood. Perhaps I'm thinking of C14, which has a longer half-life than C13 IIRC. I'm pretty sure that atmospheric testing of nukes screwed up the 14C levels, not the 13C levels-again, could be wrong though.
    0 0
  8. Marcus, C14 has a fairly short half life, but is generated by the interaction of cosmic rays with nitrogen. C12 and C13 are stable isotopes which means that they do not have a half life (or perhaps that their half life is several times the age of the universe). Because of the production of C14 in the upper atmosphere, Carbon dissolved in the ocean has a much lower CO2 content than does the atmosphere. Because of its low half life, fossil fuels contain almost no C14 (some trace amounts can be found due to ground water seepage in coal). Consequently a declining C14/C12 ratio in the atmosphere shows that CO2 is being introduced to the atmosphere from either the ocean or fossil fuels. C12 preferentially absorbed by plants in photosynthesis, so plants and anything that eats them or is produced from them (ie coal and oil) have lower C13/C12 ratios. Therefore declining C13/C12 ratios show the atmosphere is receiving CO2 from organic or fossil fuel (fossilized organic) sources. Finally, O2 is consumed in combustion. Consequently declining O2 levels in the atmosphere show the source of CO2 to be combustion. By comparing the decline of O2 to the declining C13/C12 ratio, it is also possible to determine what proportion of the CO2 comes from burning fossil fuels, and what portion comes from land use changes.
    0 0
  9. Thank you for that Tom Curtis. Seems my understanding of Carbon Isotopes is less than satisfactory. Lucky my job doesn't require knowledge of that ;-).
    0 0
  10. OK, according to Wikpedia, C-14 has a half-life of 5,730±40 years. So I'm still wondering if this wouldn't play at least some small part in our ability to detect CO2 from natural vs anthropogenic sources.
    0 0
  11. Nice summary Tom. However, this appears a little obscure to me: "Because of the production of C14 in the upper atmosphere, Carbon dissolved in the ocean has a much lower CO2 content than does the atmosphere." Did you actually mean "because C14 is produced in the upper atmoshere, CO2 dissolved in the ocean has a much lower concentration in C14 than does the atmosphere." I'm still not sure about the mechanism though. Am I understanding this totally wrong? And also on this one: "Therefore declining C13/C12 ratios show the atmosphere is receiving CO2 from organic or fossil fuel (fossilized organic) sources." That should probably go "receiving CO2 produced by combining C from organic material or fossil fuel with atmospheric O2."
    0 0
  12. Marcus, fossil fuels are millions of years old, way over a hundred millions for coal. No C14 left in there but from exterior sources. I'm not sure I understand your point in #10.
    0 0
  13. Marcus, google scholar for Etiope G and Lassey K R. Both researchers active on this. Short answer - C14 is useful but its not as easy as it sounds... (I'm trying to get no. for pre-industrial fossil methane emissions from sedimentary basins in day-job so having been looking at issue).
    0 0
  14. Philippe-the point I was trying to make (badly I confess) is that because fossil fuels have *zero* 14C, then changes in the ratio of C14 to C12 could serve as a useful secondary signal for the anthropogenic nature of the rising CO2 in the atmosphere. However, as scaddenp has pointed out, that might not be as easy as I first thought ;-). Hope that makes more sense.
    0 0
  15. Rather than a new, 11th fingerprint, isn't this really just another example, as in Fingerprint 4, of measurement of the C-13/C-12 ratio incorporated into living things? It's independent of coral C-13/C-12 ratio measurements, but not so different an indicator of fossil-fuel origin as to deserve separate listing, I think. I'd just add it to Fingerprint 4.
    0 0
  16. CH4 emitted from coalmining and decaying organic matter has residence of ~10 years during which it oxidizes to produce CO2. Am I right to assume that CO2 so produced is predominantly carbon isotope 12?
    0 0
  17. There is continued fractionation going on so that different sources having different degrees of C13 depletion.
    0 0
  18. Philippe Chantreau @11 With regard to C14 and the ocean: yes, you are correct. The ocean contains much more CO2 than does the atmosphere, but in equilibrium, an equal number of CO2 molecules flow each way at the surface. That means residence times in the ocean are much larger than residence times in the atmosphere. So for a given molecule in the ocean, it is probably a long time since it was in the atmosphere, and hence had a chance to form with a C14 atom. In contrast, a molecule in the atmosphere has (obviously) been very recently in the atmosphere, and has therefore a higher chance of having formed with a C14 atom. (I'm not sure that this is clear either, but I'm not sure I can make it clearer in a short space.) Regarding the C13/C12, you are tecnically correct, but I'm not sure your phrasing avoids any likely misunderstanding.
    0 0
  19. @Marcus CO2 poorer in 14C and 13C - may have come from fossil fuels, but also from the soil, or deep ocean. Nowinski et al., 2010.: “Radiocarbon ages of heterotrophically respired C ranged from <50 to 235 years BP in July mineral soil samples and from 1,525 to 8,300 years BP [!] in August samples, suggesting that old soil C in permafrost soils may be metabolized upon thawing.Upper-ocean-to-atmosphere radiocarbon offsets imply fast deglacial carbon dioxide release, Rose et al., 2010. : “The atmospheric decrease in the radiocarbon signal coincides with regionally intensified upwelling and marine biological productivity ... ..., suggesting that CO2 released by means of deep water upwelling in the Southern Ocean lost most of its original depleted-14C imprint as a result of exchange and isotopic equilibration with the atmosphere.” Oxygen ... - we can not be attributed strictly decrease atmospheric O2 of A. CO2. A conceptual model for the temporal spectrum of oceanic oxygen, Ito and Deutsch, 2010.: “Observed across the world oceans in recent decades have been interpreted as a response of marine biogeochemistry to climate change. Little is known however about the spectrum of oceanic O2 variability [...].” “We find a statistically significant spectral peak at a 15–20 year timescale in the subpolar North Pacific [background], but the mechanisms connecting to climate variability remain uncertain.” On evaluating ocean models with atmospheric potential oxygen, Naegler et al., 2006.: “We used observed and simulated atmospheric potential oxygen (APO) to evaluate simulated air-sea flux fields from 11 ocean global carbon cycle models. APO is defined in terms of atmospheric CO2 , O2 and N 2 so as not to depend on terrestrial photosynthesis and respiration. Hence, it is in principal suited to evaluate simulated air-sea fluxes of these gases.” “The simulated amplitude of the seasonal APO variability was generally less than observed. We conclude that it is difficult to validate ocean models based on APO because shortcomings in atmospheric transport models and problems with data representativity cannot be distinguished from ocean model deficiencies.”
    0 0
  20. “10 fingerprints: Make room for Number 11 (gonna need a bigger glove).” Actually, make that number 12. Climatologists have recently found a human fingerprint in intense rainfall: Two seminal Nature papers join growing body of evidence that human emissions fuel extreme weather, flooding that harm humans and the environment
    0 0

You need to be logged in to post a comment. Login via the left margin or if you're new, register here.


The Consensus Project Website

THE ESCALATOR

(free to republish)


© Copyright 2024 John Cook
Home | Translations | About Us | Privacy | Contact Us