


 Arguments


Past 150,000 Years of Sea Level History Suggests High Rates of Future Sea Level Rise
Posted on 7 December 2012 by Rob Painting
- An accurately dated, near-continuous, history of sea level variations for the last 150,000 years has been compiled.
- Comparison with ice core data reveals that major global ice volume loss, as implied by sea level rise, has followed relatively quickly after polar warming. The Greenland ice sheet responding virtually straight away (0-100 years lag time), and a 400-700 lag for the Antarctic ice sheet.
- These response times are much faster than was previously commonly suspected, and implies that once sufficient polar warming is underway, future ice sheet collapse may be unavoidable.
- During all episodes of major global ice loss, sea level rise has reached rates of at least 1.2 metres per century (equivalent to 12 mm per year). This is 4 times the current rate of sea level rise.
Figure 1 - Sea level reconstruction from 150,000 years ago to the present. Relative sea level (RSL) in grey-shaded area, with RSL data in blue crosses. The downward-pointing red arrows indicates peaks in sea level rise exceeding 1.2 metres per century (12mm per year). The break in the record is due to the absence of foraminifera (upon which the reconstruction is based) as a result of excessively salty seawater during the last ice age. Adapted from Grant (2012).
Relevant Sea Level Background
The last few million years of Earth's climate has been dominated by the ice age cycles. These consisted of long cool periods (glacials) where giant icesheets have grown on the continental land masses at, and near, the poles. With the water evaporated off the oceans being locked up as ice on land, this ice sheet build-up substantially lowered global sea level. During the shorter, warmer, intervals (interglacials) the ice sheets have disintegrated, and with their glacial meltwater draining back into the oceans, sea level has risen. From the coldest part of the last ice age (roughly 20,000 years ago) to present, global sea level has risen an astounding 120 metres.
Although all the details are not well understood, the driving force behind these glacial/interglacial cycles are slow variations in Earth's orbit as it circles the sun, which slightly decreased/increased the amount of sunlight reaching the planet's surface. For the current interglacial, the orbitally-driven warming eventually came to an end after the Holocene Climatic Optimum (HCO), and by 4-5000 years ago all the vulnerable land-based ice had disappeared. The volume of the global ocean was static until the arrival of the Industrial Revolution, and by the 19th Century global sea level had begun to rise again. Despite undergoing short-term accelerations, and decelerations, globally-averaged sea level has undergone long-term acceleration up to the present day (Church & White [2006] , Merrifield [2009]).
Figure 2 - Global mean sea level from 1870 to 2006 with one standard deviation error estimates (Church 2008).
With some 60-70 metres worth of global sea level equivalent locked up in the vast ice sheets of Greenland and Antarctica, and with global warming well underway, it raises the question of how much sea level rise we are likely to see this century (and beyond), and just how fast this might happen. Because the dynamics of ice sheet disintegration are only very crudely known, and ice sheet modelling is in its infancy, there is a large range of estimates of future sea level rise. Many now seem to converge on 1-2 metres of sea level rise by 2100 - much higher than current rates. But is this realistic? A recent paper, examining past ice sheet disintegrations, lends credence to these estimates.
Rapid Coupling Between Ice Volume and Polar Temperature
A peer-reviewed paper, Grant (2012), outlines how the authors created a well- dated, and near-continuous, record of sea level over the last 150,000 years, a period which spans the last interglacial (the Eemian), and the last glacial maximum. Of particular interest is the finding that, during all periods of major global ice volume loss, rates of sea level rise reached at least 1.2 metres per century. An arguably more important finding that the more finely resolved dating uncovered, was that major ice sheet reductions (as implied by sea level rise) followed polar warming much quicker than had previously been suspected.
The backbone of the sea level reconstruction are Foraminifera (forams), tiny shelled marine creatures which float in the water column (planktic), or live on the seafloor (benthic). Because they utilize minerals dissolved in the surrounding seawater to build their shells, forams incorporate elements into their shells which can provide information about the climate at the time in which they lived. Examination of oxygen-18 isotope ratios in the shells of forams, retrieved from Red Sea sediment cores, has revealed that they serve as a useful proxy for relative (i.e local) sea level in the Red Sea (see Siddall [2003] & Siddall [2004]). Although a near-continuous record of relative sea level for the Red Sea has been constructed (Rohling [2009]), accurate, and independent, dating for comparison with ice-core data has proven problematic. Grant (2012), however, came up with a clever way around this roadblock.
Constructing a Well-Resolved Chronological Record of Sea Level
Much like the Red Sea, the Eastern Mediterranean Sea is a basin with only one narrow natural opening (The Strait of Gibraltar) which connects it to the rest of the oceans. This "basin effect" was exploited to build a sea level history in the Red Sea, because the extremely slow exchange of seawater within the basin means long local seawater residence times. The raising or lowering of sea level therefore acts to either shorten, or prolong the residence time of local seawater, and also diminish or enhance the powerful rate of evaporation in the basin. In other words, changes in the oxygen-18 isotopes ratios, found in Red Sea foram fossils, are extremely sensitive to sea level variations. So the isotopes are, in effect, recorders of local sea level.
Grant (2012) likewise created a sea level history for the eastern Mediterranean Sea, with one distinct improvement; they were able to independently date the sea level variations by taking advantage of oxygen-18 isotopes stored in cave mineral deposits (speleothems) on land downwind of the eastern Mediterranean surface waters. With oxygen-18 isotopes in fossilized forams, and in the cave deposits (Soreq Cave), linked via the hydrological cycle, Uranium-Thorium dating of the cave deposits therefore gave an accurate date for both, and consequently the timing of sea level variations.
Because of the more complicated weather patterns in the Mediterranean however, the Mediterranean sea level history cannot be used to determine sea level variations with sufficient precision (Rohling 1999). To do that, the authors transferred their new Mediterranean chronology to the Red Sea sea level history. The basin isolation effect of both sea level records, gave sufficient oxygen isotope signal similarity for accurate transfer. The validity of this newly-dated sea level reconstruction was confirmed by comparison to other dated sea level benchmarks.
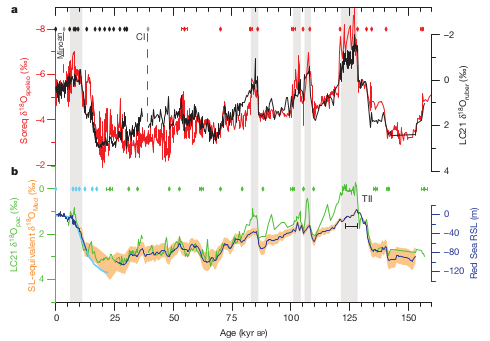
Figure 3a - Correlation of Soreq Cave (red line) and eastern Mediterranean (black line) oxygen-18 isotope signals. 3b - Eastern Mediterranean Sea oxygen-18 isotope record from another foram species (green line) and the highest probability sea level curve (blue line). The coloured dots and grey-shaded columns denote other paleodata used to validate and synchronize the reconstructions. From Grant (2012).
Sea Level Rise Closely Follows Polar Warming
With an accurately dated sea level reconstruction now available, the authors were able to compare these sea level variations in time with that of polar temperature, as ascertained by ice cores extracted from the Greenland and Antarctic ice sheets. Within the sea level reconstruction there are 6 periods where sea level rose rapidly, reaching rates of at least 1.2 metres per century - around 4 times the current rate of sea level rise (see Figure 1).
Considering that humans have been warming the climate for several centuries, a more significant finding was the short time lag between warming at the poles (as shown in the ice cores), and the response of sea level rise - which implies the disintegration of the ice sheets. In the case of Antarctica, large ice reductions occur within 400-700 years, and for Greenland, ice reductions occur very quickly - within 100 years.
Learning From (Sea Level) History
Despite glacial periods having much more vulnerable ice at lower elevation, and closer to the equator than interglacials, the orbitally-driven warming which eventually disintegrated the ice sheets was a leisurely affair. Ice sheet collapse came quickly due to the greater proportion of vulnerable ice. By comparison; today there is far less vulnerable ice, but the warming has been virtually instantaneous, in geological terms. In fact, in the last 300 million years, the Earth has not experienced (as far as we know) such a rapid rise in atmospheric carbon dioxide (Hönisch [2012]).
The altered characteristics of the background climate state, from glacial to interglacial, makes a direct comparison for modern-day difficult. But current sea level rise estimates, and the rates of rise shown in the reconstruction, are in the same ballpark. With global warming having been underway for several centuries now, and with the Antarctic and Greenland ice sheets undergoing accelerated ice mass loss due to polar warming, the past 150,000 years of sea level history suggests we should expect much higher rates of sea level rise in the future.


I don't pretend to have any depth of knowledge around climate change, but I do know technology and human nature. For all of you who believe that civilization will collapse, let's walk through a worst case scenario. All of the ice in the world melts. Temperatures go up 10C. We will still have cities. Technology will still advance. It will not happen in a year or a decade. We will not need to move out of the coastal cities suddenly, we will just stop building in them or near the ocean. As older people die, young people will move inland. Yes it is bad, people will starve and be displaced, but it is not the end of civilization. There will still be a few billion well-fed educated people on the planet. We will make it through this with flying colors.
Bill,
Your story is sadly oversimplified.
What shocks me is the way people think that an 80 year old period of technological stability means that it can never end. Countless powerful human civilizations have fallen over the course of history, many of them as a result of climate change, and yet some people seem to think that imagining such a thing in our case is impossible -- and yet our current society is so precariously positioned that it is frightening.
We are so specialized and interconnected that many people are utterly incapable of surviving in anything but our interconnected society. Imagine what would happen just as the result of something like the outbreak of a Spanish flu, something that wipes out even a small percentage of the population. We do not run a society with much in the way of wiggle room for major industries, jobs and tasks.
Our society and civilization is very, very far from safely grounded. Something as huge as climate change is guaranteed to knock the foundation out from underneath, if we wait too long to address the problem.
I think it's really funny (in a sad way) that Dismissives deny climate change, shouting alarmingly, "Alarmist! What you ask would destroy our economy!" when in fact acting now would incur a small price (10 years ago would have been way better), while delaying any further virtually guarantees the outcome that they use to scare people away from effective and reasonable action.
Bob,
I am in no way a denialist or a dismissive. My position is that we should transition to energy and fuels that reduce the impact as quickly as possible. But the most likely reality is that we will not do it until it is economically advantageous to do so. Given the new oil supplies and natural gas coming on line from fracking, we will continue having an economical oil supply for decades to come. I hope that we can produce cleaner sources of energy sooner than that to quicken that transition time. Ultimately people will make decisions based on their pocket books and oil is here for a while. As a species we collectively do not worry about the future. That is reality.
Your Spanish Flu comparison doesn't really hold water. I agree that if we had a pandemic situation that wiped out say 90% of the world, it would takes a few decades to get society back to the functional level where we are now. But we will not lose our technical knowledge. The difference here is that this is a slow moving danger. It is not a tsunami. We will have time to adapt. We will move our cities, our industries, our farms. So there is not NYC, SF, or LA? THe loss of all our coastal cities is a tragedy, but not the end of the world. Of course there will be wars and famine. In my post I never said that we have nothing to worry about. I said that civilization will survive this and prosper.
My position is not in conflict with working to achieve sustainable energy capabilities. On the contrary, realizing that the solution has to be about economics more so than awareness should focus our efforts on where it will do the most good. When people post that in the future we will be living in a Stone Age, it detracts from the validity of the problem and how to solve it by alienating realistic and hopeful people.
Bill... What's the old saying? "A little knowledge can be a dangerous thing."
As Bob points out, you're missing the big picture. And Bob is only pointing out a few of the complicating factors. You also have to consider that human population is going to be approaching 10B right about the same time things start to get bad. We already see social unrest when grain prices rise and bread becomes unaffordable to those in poverty. Amplify that and you've got some serious global problems. It's horrendous to see people starving in parts of Africa. Imagine that but with numbers approaching a billion or more. This is not something that technology is going to solve.
Sea level rise is also not just a matter of moving coastlines. The worse problem is the amplification of storm surges. We already see this with a small amount of sea level rise and larger storms. Make that a meter of SLR and storm surges are going to extend much further inland, also making habitation anywhere near a coastline influence by tropical storms impossible. Think, the entire US eastern seaboard. Think, Hong Kong, Taipei, Shanghai... this is not in the least insignificant.
When you say worst case of 10C, that's probably as close as one could get to a complete collapse of the world's current ecosystem. That would mean that a good portion of the lower latitudes would be unihabitable due to temperature extremes at various times during a year. With Arctic amplification, that would be much greater in the north. So, it's not just a matter of everyone migrating further north because you're going to have a large number of days during the summer that are also going to be unihabitable due to temperature extremes.
Another element you're ignoring is that, at that level (10C) we'd possibly see the ocean surface go anoxic. Richard Alley explains it here at minute 20:00.
Would humans survive this? Maybe, probably, but nothing like we know today. Likely a tiny fraction of the current human population. And the worst part would be the utterly immense amount of human suffering that would occur in the process.
And the even worse part (worse than worst) would be... it would have been entirely avoidable, at a cost today of 2% of global GDP.
Bill said... "We will have time to adapt."
I beg to differ. If you look at the ice core record, the climate system can make very abrupt changes with far less purturbation than we're currently imposing on the system. Look at the Younger-Dryas. A climate shift equal about to moving from Atlanta to New York in a decade or so.
The problem is, we don't know what causes those abrupt shifts and we don't know when they might occur.
At risk of dogpiling. Photosynthesis dramatically drops in efficiency at around 32C and basically shuts down at 37C. And then there is the problem of water see Dai 2010. (seriously, look at the map from Dai). Both add up to considerable less food available than today - triggers for previous collapse of civilizations. No amount of technology beats thermodynamics. I strongly doubt all civilizations everywhere would completely collapse but extremely bad things would happen needlessly if we let climate change too quickly.
You say you know technology and human nature. How well do you know those civilizations that did collapse? A lot of technology is concentrated in skills of very few - how much disruption would it take to fracture that skill base?
What economic studies exist show that is economically advantageous to transition now. The costs of mitigation are less than costs of adaption but we dont do so. Why? Because voters will believe any sort of comfortable lie rather than accept the need (as Milton Friedman pushed) to pay for externalities. We are not paying the full cost of coal. We are leaving that to future generations to pay. We need pricing on coal so that it stays in the ground.
An ounce of prevention is worth a pound of cure."
From the SkS Comments Policy:
No dogpiling. In the interests of civility and to enable people to properly express their opinions, we discourage 'piling on'. If a comment already has a response, consider carefully whether you are adding anything interesting before also responding. If a participant appears to be being 'dog piled', the moderator may designate one or two people from each side of the debate as the primary disputants and require that no other people respond until further notified. On topic comments on other matters not being discussed by the primary disputants will still be welcome.
Bill, you missed my point.
If you actually think the world can recover from the loss of 90% of the population, you need to re-evaluate things. I don't think we could recover from the loss of 20%, maybe even 10%.
Modern society is like a hive mind. Very intricate knowledge is squirrelled away in various people, and passed on in a stuttering variation on an oral tradition. Through schooling, apprenticing, trial and error, and experience, people get to understand one minute facet of how our society works, from international finance to aerospace engineering to oncology.
If you remove too much of that at once, basic services, like power, food production, processing and transport, and other things will devolve, and people won't be able to handle it. I think that far, far less than a 90% population loss will be needed to cripple civilization because of how very complex our society and its use of technology has become.
But even if you don't agree with that... you are a dismissive, even if you don't think that you are. If you have no sense of fear or urgency, because you beleive that we can overcome everything, simply because history shows that for the past 100 years we have done so, then... you are a dismissive. You dismiss the problem, not because you don't believe it exists, but because you believe it isn't large enough to worry you.
That is a serious problem that is facing us all, because there is a time limit, and there is a point after which it will be too late to take relevant action. More importantly, every year's delay makes the action that we will ultimately have to take than much more painful.
It just astounds me that dismissives are guaranteeing the one outcome that frightens them most, and are avoiding the path of rewarding (both economically and socially) growth that renewables and a say-no-to-fossil-fuels would bring.
Bob Lacatena @29, you are correct about the balkanization of knowledge which is characteristic of our age, and that it makes us more vulnerable to a breakdown in society. I think you are incorrect in your estimate of the population loss that would be required to bring about that catastrophe. Except in areas of cutting edge research, the knowledge base is duplicated across several major nations, or groups of nations. Specifically, the US, Europe, Russia, Japan, and now China and India all now have sufficient knowledge to allow for the recovery of civilization without much loss of current knowledge if any of them survive largely intact. What is more, as casualties from global warming will be predominantly in poor, underdeveloped nations, they are also the nations (or groups of nations) most likely to survive with few casualties. If 10 or 20% of the world's population is lost, most of the losses will be in Africa with least in the most developed nations. Further, the missing knowledge, if any, following a 10% populatin loss, will be highly specialized, and consequently have marginal impact on world economic production.
The same cannot be said for a 90% loss, which of necissity must hit all nations very hard. Therefore, a 90% loss - ignoring the other impacts - does have the potential to end our civilization. Never-the-less I think sufficient knowledge would remain even then to survive as a civilization, if not at the advanced levels previously achieved, then at least at a technological level equivalent to that of the 1950s.
I think the far greater threat actually comes from the risk of sustained economic decline; and the end of substantial trade. Our civilization is critically dependent on complex trade networks. If these collapse, so will also the high standard of living that allows so many of us to devote so much time to learning. If all must grub for food in subsistence, or near subsistence farms, there will be no engineers or scientists to sustain the knowledge. Any event, particularly an ongoing even such as OA, ocean anoxia, and sustained very high temperatures which can knock out >20% of the population is also likely to knock us into sustained (multidecadal) negative economic growth, and potentially knock out the majority of the trade network, forcing each region to sustain its own population. The problem will not just be in the population loss, but in the ongoing conditions that caused that loss in the first place.
The end product may well be a fall back to a medieval level of technology, with a few advanced holdouts. Whether that counts as the end of our civilization or not, I think, is academic.
Further, I think that any event that can so stress the worlds nations is also a substantial risk of triggering major wars and potentially an all out nuclear exchange. In that respect, economic stress without population decline presents a greater risk. An all out nuclear exchange represents, of course, and a very high threat of extinction for our species.
Finally, although I regard Bill's comments as panglossian, I do not think it is fair to characterize him as a dissmissive. There are a range of rational views on climate change, from those that consider it a major problem but not a threat to our civilization or species, to those that consider it a threat to both. The threats to the later are, given the present state of knowledge, risks - not certainties.
At no point before Bill chimed in, did anyone suggest climate would end civilization. He begins by attacking a strawman argument. It is a bizarre position to suggest that we should only take action on climate change if it was a threat to civilization (which his scenario over say 100 years would be, but still...). We should take action because it is the rational thing to do from point of view of both cost and risk. It is also the appropriate moral action from the point that those most affected by change are not the ones who are causing it.
To take scaddenp's comment and elaborate it a bit, in no way do we need to view global warming as civilization-threatening to be motivated, even strongly motivated, to take action to mitigate it at a global level.
All we need is to have the following convictions:
I do not think either of these are in any way radical notions.
(Not to say that global warming could not be civilization-threatening if left unchecked; it very well could. My point is that you don't have to see it that way in order to support taking action on a society-wide scale.)
One of the problems with "correlations" especially serial (time related) correlations is that they do not prove cause and effect. A large amount of effort goes into "proving" a causation using correlation, multiple regression, etc., but consider that when the rooster crows, the sun comes up, but that certainly does not mean that he rooster causes the sun to rise.
Also, other factors are raising sea levels, including Plate Tectonics, the continental shift that is impacting the depth of the ocean floor where one plate moves under another. It causes earthquakes, it releases heat into the ocean that cause frozen methane to become gaseous and rise to the surface (a far more potent greenhouse gas than CO2), but most important, it raises the ocean floor.
Imagine the same amount of water in the oceans, and the sea floor rising, it clearly would raise the level of the surface of the water.
There is also Solar output, the orbital radius from the sun, the "tilt" of the axis that changes over thousands of years, all impact climate (the weather).
Be very careful about assuming that scientists have "proven" anything if they rely on correlations of any kind, and ignore some clear and obvious geological issues that have a large impact on ocean levels, and the release of methane into the atmosphere.
Dr. T — A scientist interested in factual analysis, not correlations that are not proof of cause and effect.
[PS] You appear to be engaging in a straw man. Nowhere is correlation being used to imply a cause and effect. However, if your model predicts a correlation (and the physical models most certainly do make these predictions), then an important test of your model is see that such correlations do in fact exist. If they dont, this is evidence against a model. If they do exist, then it strengthens the model. In science, nothing is ever "proven" (you can only do that in maths) and noone has suggested it has. The other factors you mention are already part of standard climate theory, and taken into account in models. Eustatic changes in sealevel have been known and accounted for since the 1980s eg (http://www.earth.ox.ac.uk/~tony/watts/downloads/WattsThorne84.pdf)
"A large amount of effort goes into "proving" a causation using correlation, multiple regression, etc., but consider that when the rooster crows, the sun comes up, but that certainly does not mean that he rooster causes the sun to rise."
Yes, I am certain that none of the authors have suggested that evaporation in either the Red or Mediterranean Sea caused global sea level to fall.
Your comments don't make a great deal of sense. How could the ocean basins shallow and deepen in concert with Milankovitch forcing? And where did the water locked up as ice in the vast Laurentide and Fennoscandian ice sheets disappear to if not into the ocean?
[PS] Dr T comments suggest that he/she hasnt actually read the Grant (2012) paper.
For perspective, 7 billion people standing in close formation would fit within the boundries of Los Angeles. A very, very small space compared with the occupiable land area on the earth.
Hello, I know this topic isn't very active, but I just have a question. Why have people not incorporated the subsidence rates along the coasts into calculations of relative sea level rise? I never see it brought up in many of the sea level conversations, but it seems to be an important factor when subsidence of 2in year or more in some areas along the coasts. Take this paper on the Chesapeake Bay.
https://pubs.usgs.gov/circ/1392/pdf/circ1392.pdf
I quote, "The difference between the average sea-level rise computed
from the four NOAA tidal stations in the study area (3.9 mm/yr) and the benchmark global
rate (1.8 mm/yr) is 2.1 mm/yr, which is an estimate of the average rate of land subsidence at
the four NOAA stations. These numbers indicate that land subsidence has been responsible
for more than half the relative sea-level rise measured in the southern Chesapeake Bay region."
I am just curious why this doesn't seem to be discussed when people are talking about sea level rise. Seems like a glaring mistake, but maybe I am crazy.
Tlander - why do you believe that substance rates are not accounted for in assessment of sealevel rise from tide gauges? Eg see methods part of Church and White. Furthermore, satellite altimetry methods are now used to assess sealevel rise and they are immune to coastal changes.
It actually doesn't say anything about using local subsidence in the calculations at all. Only general mention I find is in section 2.1.
"Sea-level measurements are affected by vertical land motion. Corrections for local land motion can come from long-term geological observations of the rate of relative local sea-level change (assuming the relative sea-level change on these longer times scales is from land motions rather than changing ocean volume), or from models of glacial isostatic adjustment, or more recently from direct measurements of land motion with respect to the centre of the Earth using Global Positioning System (GPS) observations. Here, the ongoing response of the Earth to changes in surface loading following the last glacial maximum were removed from the tide-gauge records using the same estimate of glacial isostatic adjustment (GIA; Davis and Mitrovica 1996; Milne et al.2001) as in our earlier study (Church et al.2004)." I'll have to dig in more to see if they used local measuresments of subsidence for corrections.
I'm sure that the satellite atlimetry is accurate, but that doesn't change the fact that if you have cosatal lands falling at 2in(~50mm) a year and sea level rising at 12mm/year than no matter what we do, the coasts will be under water in short time. Subsidence is a big reason that floods are becoming more expensive and frequent along the coasts.
Here is a link to an article Houston Chronical did on a USGS study of subsidence in the Houston area.
http://www.houstonchronicle.com/news/houston-texas/houston/article/For-years-the-Houston-area-has-been-losing-ground-7951625.php
Some areas show subsidence rates as high as 4'/year.
I'm not arguing that sea level is rising. I am arguing that the influence of subsidence is a compounding issue tied to sea level rise that doesn't seem to be talked about much. Its seems to be more of the issue than sea level rise, especially for coastal cities. We could completely drop fossil fuels tomorrow and it wouldn't change the fact that the coastal cities will be in sinking faster and faster and will be in trouble no matter what.
TLander @38 , I suspect the reason that the subject of local land subsidence is not mentioned much, is that subsidence is not a factor affecting most of the world. Yes, parts of the USA and northern Europe — but these are wealthy regions and there is relatively little cost in "adjusting" to a slow and steady subsidence. OTOH the sea level rise is accelerating : towards a cumulative effect which will swamp [excuse pun] subsidence effects over the next century or so, and involving all the world's continents & islands.
I beleive that is completely wrong.
It is pretty well known that a majority of the population in the world lives near the coasts and that a majority of the money is concentrated at the coasts. Just look up population/wealth maps of China, India, Europe and the United States. Even poor communities, specifically islands, have issues with subsidence due to pumping groundwater and salt water infiltraition causing dissolution like in Florida where they are dealing with sinkholes do to infiltration. It's not a poor/rich problem. It's a problem with where we build our cities and how we think we can control the Earth. We could keep mitigating and mitigating, but living near the coasts has more risk than just rising sea level or even subsidence.
TLander @40 — agreed, few would care to deny that a considerable portion of the world's population lives near the coast, where (as you rightly say) there is the issue of land subsidence / sea level rise. As ever in this world, the poor suffer disproportionately more greatly than the rich, when assailed by adverse events [events rapid or slow].
Though you are somewhat obscure when you allude to a third risk affecting the coast-dwellers. Were you referring to the increasing heat waves (and especially the high-humidity heat waves) which would increasingly make parts of the tropics unlivable as AGW worsens? That risk is already beginning to nibble at us — but of course applies inland as well as at the coastal regions.
TLander @42 . . . your post seems to have been "snipped" for wandering too far off topic.
But I should point out that your "third factor" — namely coastal erosion — can well be described as an historical constant , rather than a large new threat to coast dwellers. Likewise with tsunamis, and coastal subsidence/uplift.
The man-caused local coastal erosion [that you mention] is a very tiny portion of the total world coastline.
Of your (unfounded) proposal that CO2/greenhouse-gasses are highly unlikely to be the cause of Global Warming (or Climate Change, or whatever word-label you care to use for the underlying reality) . . . well, you evidently have not thought the matter through — so I shall reply to you on a more appropriate thread.
[ I haven't yet decided which would be the most appropriate thread — there are several eligible threads, and at this stage I am leaning towards using "Climate Myth Number 68 : Is The Science Settled" ]
Subsidence and Coastal Erosion are not historically constant where a large percentage of the worlds population is located. I agree that a majority of the coasts aren't developed, but the issue is where we are developed. Do we care about coasts where people don't live? The coasts where people don't exist will be fine, because no one lives there and it will just be the norms that have been going on forever. I don't see your argument. I will agree that in the coastal regions where humans haven't developed that there is more or less a historical constant of subsidence and coastal erosion, but from my understanding the issue with sea level rise is that the coastal cities(where people live) will be inundated and destroyed from massive storms/encroaching waters costing money and human life. In these areas, coastal erosion and subsidence are a huge deal and need to be completely accounted for. Yes, the sea level will rise all around the world. Most of the coast will be effected, but it will only matter in terms of human life and cost in the areas where people live.
All of the icecaps could melt and sea level could rise to its max, but it we would still have issues with coastal erosion and subsidence where people are concentrated.
You can even factor in storm surges/flooding destruction being more prevalent due to the destruction of beach dunes and by damming rivers upstream, which is the source of sediment that creates protective barriers on the coasts to fend off storm surges. These protective barriers are destroyed in areas where human development is high.
I read "Climate Myth Number 68 : Is The Science Settled," and is it supposed to validate anything? Am I supposed to learn something from it? I agree that humans are increasing the CO2 in the atmostphere. I agree with it 100%. I don't agree with it being the cause of droughts, wildfires, "extreme weather", or even hugely responsible for sea level rise.
[JH] The concluding sentence of your post:
I don't agree with it being the cause of droughts, wildfires, "extreme weather", or even hugely responsible for sea level rise.
Your personal opinion carries ver little weight on this website. You are now obligated to document with references to appropriate scientific materials how your opinions have merit.
TLander @43 , on the other thread [Climate Myth Number 68 , in the comments section, Page 2 , Comment #80 ], I have given two strong reasons why your thinking is wrong.
Various other reasons exist as well — but (to misquote Einstein) : Two would be enough.
If by some strange means you have gained the belief that the recent large rise in atmospheric CO2 is not responsible for planetary warming & the consequential fast rising volume of the sea — then the honor of making Comment #81 awaits you on that other thread ["Is the science settled" Myth No. 68 ]. There you can provide whatever disputation you are capable of — for clearly in your own mind, the science is not settled and the scientists are all wrong.