Climate Science Glossary

Term Lookup

Enter a term in the search box to find its definition.

Settings

Use the controls in the far right panel to increase or decrease the number of terms automatically displayed (or to completely turn that feature off).

Term Lookup

Settings


All IPCC definitions taken from Climate Change 2007: The Physical Science Basis. Working Group I Contribution to the Fourth Assessment Report of the Intergovernmental Panel on Climate Change, Annex I, Glossary, pp. 941-954. Cambridge University Press.

Home Arguments Software Resources Comments The Consensus Project Translations About Support

Bluesky Facebook LinkedIn Mastodon MeWe

Twitter YouTube RSS Posts RSS Comments Email Subscribe


Climate's changed before
It's the sun
It's not bad
There is no consensus
It's cooling
Models are unreliable
Temp record is unreliable
Animals and plants can adapt
It hasn't warmed since 1998
Antarctica is gaining ice
View All Arguments...


Username
Password
New? Register here
Forgot your password?

Latest Posts

Archives

Phil Jones and the meaning of 'statistically significant warming'

What the science says...

When you read Phil Jones' actual words, you see he's saying there is a warming trend but it's not statistically significant. He's not talking about whether warming is actually happening. He's discussing our ability to detect that warming trend in a noisy signal over a short period.

Climate Myth...

Phil Jones says no global warming since 1995

'Phil Jones said that for the past 15 years there has been no "statistically significant" warming. The admissions will be seized on by sceptics as fresh evidence that there are serious flaws at the heart of the science of climate change and the orthodoxy that recent rises in temperature are largely man-made.' (Daily Mail)

A headline in the Daily Mail claims that Phil Jones, ex-director of the University of East Anglia’s Climatic Research Unit, said 'there has been no global warming since 1995'. Not only did Phil Jones not say these words, this interpretation shows a poor understanding of the scientific concepts behind his words. To fully understand what Phil Jones was saying, one needs to read his actual words and understand the science discussed. Here is the relevant excerpt from the BBC interview:

BBC: Do you agree that from 1995 to the present there has been no statistically-significant global warming

Phil Jones: Yes, but only just. I also calculated the trend for the period 1995 to 2009. This trend (0.12C per decade) is positive, but not significant at the 95% significance level. The positive trend is quite close to the significance level. Achieving statistical significance in scientific terms is much more likely for longer periods, and much less likely for shorter periods.

BBC: How confident are you that warming has taken place and that humans are mainly responsible?

Phil Jones: I'm 100% confident that the climate has warmed. As to the second question, I would go along with IPCC Chapter 9 - there's evidence that most of the warming since the 1950s is due to human activity.

Phil Jones is saying there is a warming trend but it's not statistically significant. He's not talking about whether warming is actually happening. He's discussing our ability to detect that warming trend in a noisy signal over a short period. To demonstrate this, look at the HadCRUT temperature record from 1995 to 2009. The linear trend is that of warming. However, the temperature record is very noisy with lots of short term variability. The noisy signal means that over a short period, the uncertainty of the warming trend is almost as large as the actual trend. Hence it's considered statistically insignificant. Over longer time periods, the uncertainty is less and the trend is more statistically significant. 
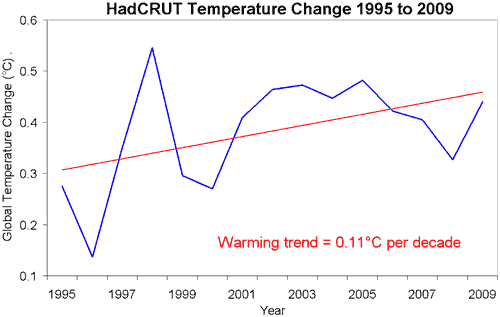
HadCRUT global temperature 1995 to 2009
Figure 1: HadCRUT global temperature change in degrees Celsius. Blue is yearly average. Red is linear trend (HadCRUT).

It bears remembering that the HadCRUT record only covers around 80% of the globe. Analysis by European Centre for Medium-Range Weather Forecasts (ECMWF) and NASA GISS (Hansen 2006) find that the areas omitted by HadCRUT are some of the fastest warming regions in the world. Consequently, the HadCRUT record underestimates the warming trend, as demonstrated by the NASA GISS record which covers the whole globe:
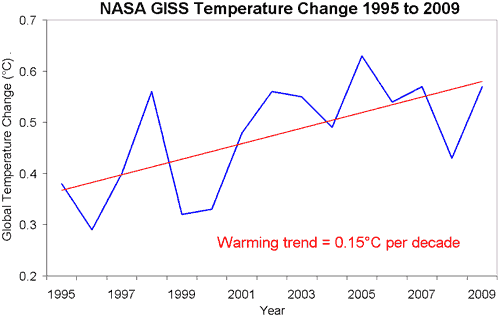
NASA GISS global temperature 1995 to 2009
Figure 2: NASA GISS Global temperature change in degrees Celsius. Blue is yearly average. Red is linear trend (NASA GISS).

However, even this doesn't give you the full picture. Surface temperature is only a small fraction of our climate with most of global warming going into the oceans. When all the heat accumulating in the oceans, warming the land and atmosphere and melting ice is tallied up, we see that global warming is still happening.
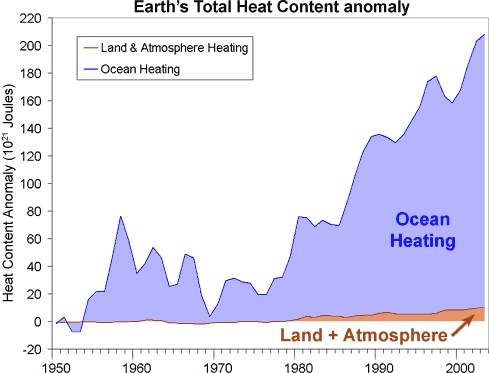

Figure 3: Change in total Earth heat content from 1950 (Murphy 2009).

Last updated on 26 June 2010 by John Cook.

Printable Version  |  Offline PDF Version  |  Link to this page

Argument Feedback

Please use this form to let us know about suggested updates to this rebuttal.

Further reading

For an introduction to the concept of statistical significance, read Significance in Statistics & Surveys.

Another excellent discussion on statistics can be found at Tamino's The Power — and Perils — of Statistics.

.

Comments

Comments 1 to 14:

  1. Could I ask what the significance level (confidence level) of 1995-2009 really is? I've read blogs about 92-94%, but is this correct?
  2. Late to the party here, but first time poster and all that... There is some very interesting background to that BBC interview of Phil Jones. The Beeb were trying to be 'balanced', and so invited (some) questions from prominent climate skeptics. That "Do you agree that from 1995 to the present there has been no statistically-significant global warming?" question in particular was in fact carefully crafted by Lubos Motl (and Steve McIntyre may have had a hand in there too, not sure) to paint Dr. Jones in a bad light. They knew he had to answer it honestly, but it was a loaded question. If you go back even *one year* to 1994, or in fact any year before that, then the warming is statistically significant to the 95% confidence level. As most of you know, you really can't consider periods shorter than 22 years because of the influence of solar cycles. 15 years is not nearly long enough. Motl and McIntyre know this, of course. So this is what climate science is up against: clever little deceptions and spin to score cheap points in the eyes of the public.
  3. John, Tamino's 'How Long' post seems to have vaporized. But he has another, more recent, one that treats the Phil Jones quote http://tamino.wordpress.com/2010/11/11/hey-david-whitehouse-why-is-the-sky-green/
  4. It's been a while since I did any actual science, but my understanding is that the scientist picks the confidence level AHEAD of time, and if the result is significant, it's significant, and if it's not, the scientist does not actually get to say " Yes, but only just. I also calculated the trend for the period 1995 to 2009. This trend (0.12C per decade) is positive, but not significant at the 95% significance level." The scientist does not get to post-facto change the significance level to suit the experiment. If Jones dislikes picking confidence levels, let him use Bayesian analysis. But he designed the experiment, he chose the 95% confidence level, and the data doesn't match that.
  5. That was a case of answering a leading/staged question presented by the interviewer rather than designing an experiment.
  6. 15PacksADay - So choosing to ask about a 15 year period (when just about everyone in climate science agrees that 25-30 is the minimum to evaluate a significant trend), the largest period in that time frame that did not meet the 95% significance threshold - is that good journalism? Or is that a trick question intended to advance a statistically false viewpoint? I do wish Jones had answered that question a bit differently - but he answered it correctly given the data. Positive, but not at the 95% significance level.
  7. "But he designed the experiment, he chose the 95% confidence level" Actually, no he did not Lindzen and Lubos Motl did. See here. 15PacksADay probably also believes the myth that HadCRUT massaged their data to hide the decline in global temperatures.
  8. Tamino disagrees with Phil Jones: the trend IS statistically significant since 1995. Indeed, it is since 2001. But I'll let you read the original post.
  9. An update from Phil Jones
  10. Can we have an update on this post at the point at which warming since 1998 has become statistically significant? It's worth just being able to say "two years ago, it was true to say there was no statistically significant warming since 1998 (though there was still warming, of which we were more than 90% confident that it was not just random variation), but now, we have more than 95% confidence and so *yes* there is statistically significant warming".
  11. Byron, statistical hypothesis testing is a rather subtle issue, watching a trend to see where a trend goes from insignificant to significant violates the underlying statistical assumptions of the test (e.g. that the period in question is a random sample from some population of samples), and is essentially the same error being committed by the skeptic when they wait for a long period that isn't statistically significant to make a fuss about. One of the problems with statistical hypothesis tests is that if you wait long enough the trend will always be statistically significant, even though the magnitude of the trend is meaninglessly small. As the forcings are changing, we know a-priori that the real trend is not exactly zero. Statistical hypothesis testing is a useful sanity check to prevent you from getting over-excited about your hypothesis, very little more.
  12. I participate in YA global warming forum and the deniers there always drop "statistically significant" but he went on to say the average warming for the period I think was 0.2C yearly which is a slight warning

    Just another case of cherrypicking

  13. YahooMike @12, 0.2 C per year is a very large rate of warming.  In fact it is 10 times the underlying (ignoring volcanic influences) predicted rate from the IPCC, which is approximately 0.2 C per decade.  You may have misremembered the rate of warming the denier in question claimed.

  14. "When all the heat accumulating in the oceans, warming the land and atmosphere and melting ice is tallied up, we see that global warming is still happening."

    Naturally this article fails to mention that since the hydrosphere is 271 times as massive as the atmosphere, if oceans are absorbing the heat they are likely to moderate AGW into a nonproblem, as the average ocean temperature has only changed by .1 degrees in 50 years, an amount that is probably smaller than measurement error.

    Response:

    [PS] please note the comments policy, especially the section on sloganeering. There are numerous papers on measurement error and you wish to dispute that please provide evidence to support it. That the oceans ameliorate warming hardly needs stating - without oceans, we would have warming by 36C. If you wish to propose that somehow heat uptake can increase to make it a "non-problem", then provide evidence to back it. The evidence from papers in the IPCC reports do not appear to support your argument. Further speculative sloganeering without support will be deleted.

Post a Comment

Political, off-topic or ad hominem comments will be deleted. Comments Policy...

You need to be logged in to post a comment. Login via the left margin or if you're new, register here.

Link to this page


The Consensus Project Website

THE ESCALATOR

(free to republish)


© Copyright 2024 John Cook
Home | Translations | About Us | Privacy | Contact Us