


 Arguments


Seal of approval - How marine mammals provide important climate data
Posted on 22 July 2014 by BaerbelW, Anne-Marie Blackburn
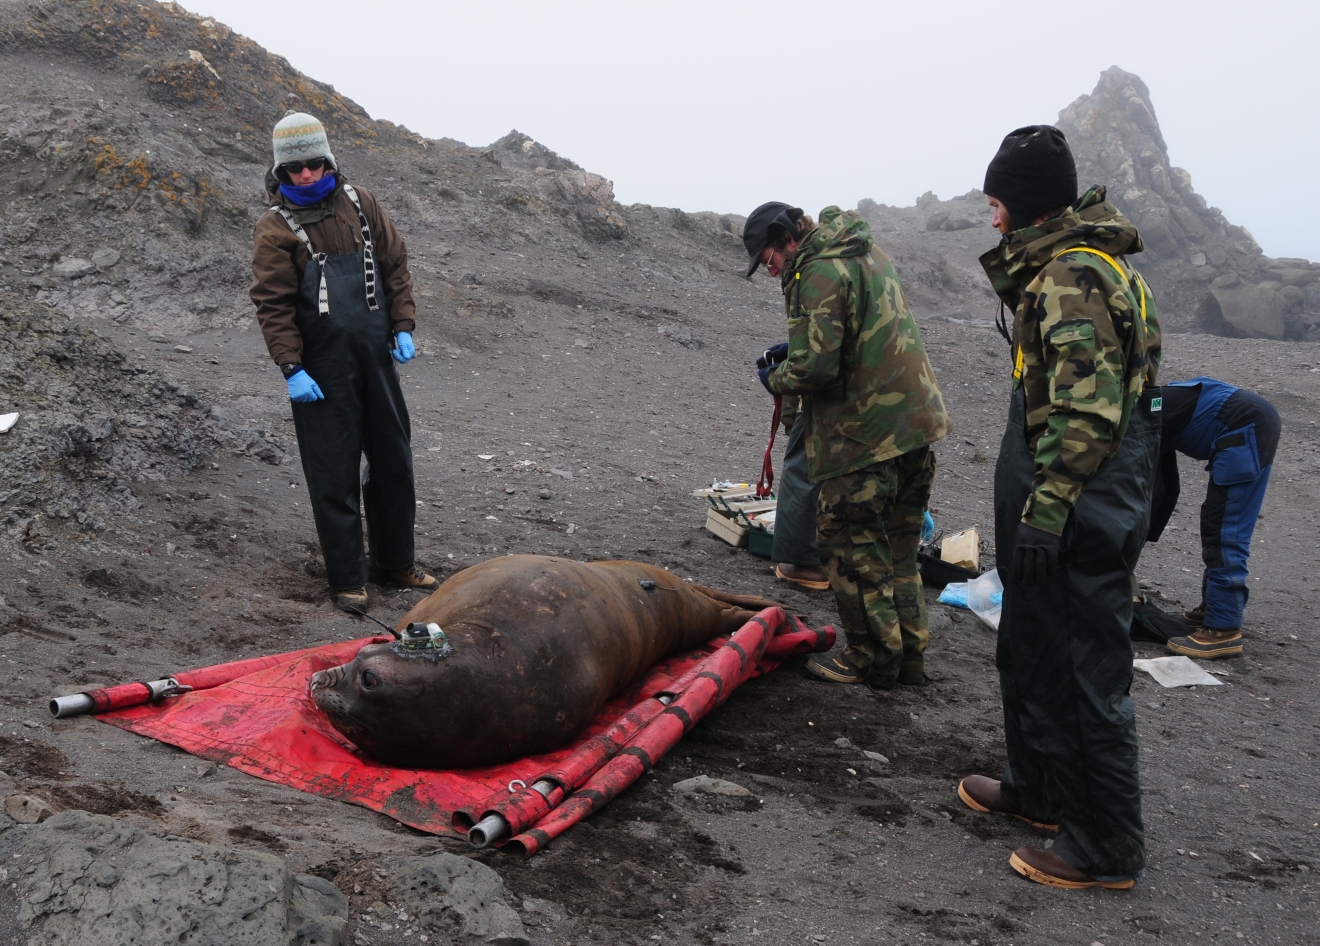
Understanding what is happening in the oceans is crucial since 90% of global warming is going there and attempts to measure temperatures at various depths go back to the 1960s. But, what does this Weddell seal have to do with this and what is it wearing on its head?
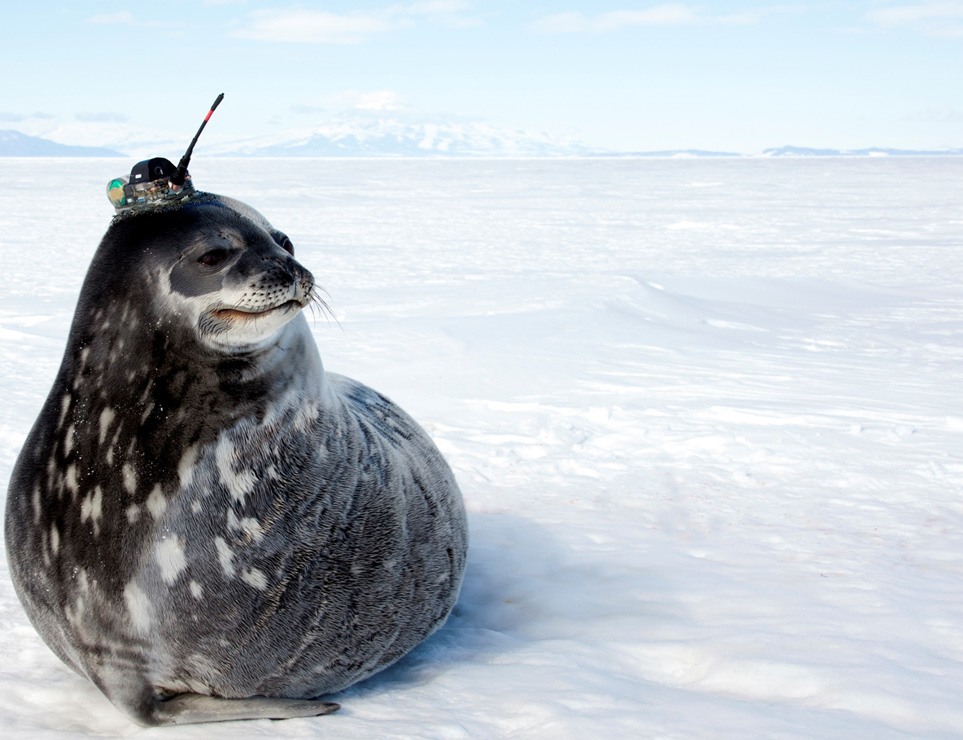
Weddell Seal West Antarctic Peninsula (photo: Dan Costa - NMFS 87-1851-03)
To answer these questions we have to backtrack a bit and look at the recent history of data collection used to find out what is happening in the oceans.
How has the data for charts like the ocean heat content been collected?
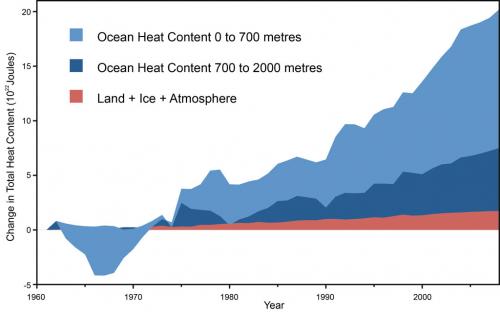
Figure 1: Land, atmosphere, and ice heating (red), 0-700 meter OHC increase (light blue), 700-2,000 meter OHC increase (dark blue). From Nuccitelli et al. (2012)
The underlying data about the temperature at different depths has been collected since the 1960s via expendable bathythermographs (XBT) and mechanical bathythermographs (MBT) deployed from ships travelling across the high seas. These measurements have been rather confined to the shipping lanes most travelled and therefore leave out a lot of the actual ocean surface, including much of the polar regions as these are not (yet!) on any regular shipping lines.
At the beginning of the 21st century, a network of autonomous Argo-floats started to be deployed all across the ocean and there are currently 3,600 floats providing around 100,000 measurements per year.
 Figure 2: Positions of the floats that have delivered data within the last 30 days (Updated daily) From the Argo website
Why is even the Argo data incomplete?
Argo-floats follow an operating cycle which requires them to regularly surface to send their data to orbiting satellites. This makes it impossible for them to operate in areas covered by sea-ice, which is why they cannot provide much data from either Arctic or Antarctic waters. In addition, ocean currents around Antarctica tend to make the floats move away from instead of closer to the continent once deployed. Getting data from these remote and inaccessible areas therefore required new solutions.
The below graphic shows a typical Argo-cycle in which the autonomous floating device descends to a depth of about 1,000m where it drifts with the currents for 8 to 10 days. This drifting is followed by a further descent to a depth of 2,000m and then the float ascends within 6 hours collecting data on temperature and salinity during its rise. Once at the surface, the data is sent to orbiting satellites.
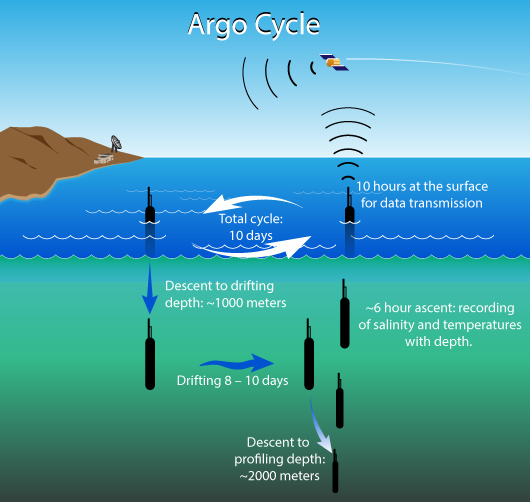 Figure 3: Schematic of a typical Argo-cycle - for a hi-res version click here (jg)
Marine mammals to the rescue!
Birds have been ringed since the late 19th century to learn more about their migration patterns. Once technology allowed it, radio and later satellite tracking started to be used to also collect data about the routes actually travelled. This provided a lot more data than just where a bird was first banded and later re-captured or found dead. In addition to birds, mammals have also been outfitted with transmitters to track their migrations and whereabouts.
Tracking animals over land already has its challenges but doing so with animals living in a marine environment adds even more complexity as the tracked individuals spend a lot of their time somewhere in the oceans and basically out of easy reach. This is where Professor Dan Costa at the University of California Santa Cruz (UCSC) and his research team come in. They have been radiotracking marine mammals for several decades in order to learn more about their behaviour and where they go to find their food.
 Tagging a southern elephant seal (photo: Dan Costa - NMFS 87-1851-03)
There are two recurring occasions when the seals come to their beaches: to give birth and mate in the winter and several months later to moult. These are the times in the year when the researchers can attach or collect the tracking devices. In the early days of tracking marine mammals, the data recorders simply logged data while the individuals were out at sea to forage and the researchers had to wait for the animals’ return to collect the tags (which fall off when the seals moult). The data could then be downloaded and processed.
As technology evolved it became possible to transmit the data to satellites while the animals are out and about, making almost real-time data available to the researchers and the public. You can currently for example track several northern elephant seals via the Ano Nuevo blog maintained by Dan Costa’s team.
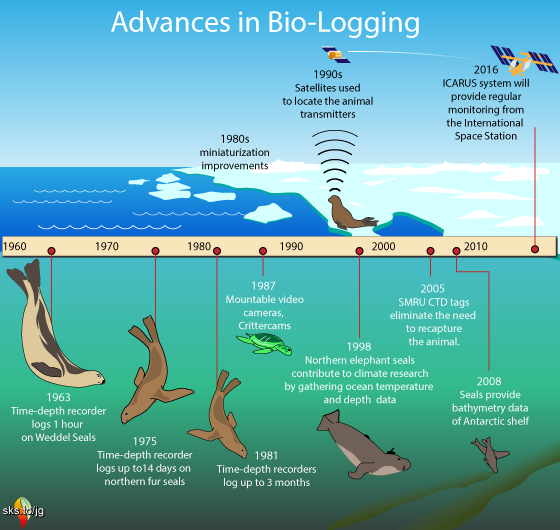 Figure 4: Timeline of bio-logging with marine animals - for a hi-res version click here (jg) - Note: the SMRU CTD tags mentioned for the year 2005 are Conductivity/Temperature/Depth recorders developed for the Sea Mammal Research Unit of the University of St. Andrews
Even though the data-recorders became more sophisticated and powerful, the procedure to attach them to the animals has not changed a lot over the years. The researchers go to the rookeries when the animals congregate there, suitable animals are sedated and the loggers are glued to their heads. Neither the tagging procedure nor carrying the tag around for several months seem to negatively impact the seals.
The research is important to pinpoint areas which need to be protected from human influence to ensure that for example feeding grounds for animals like northern elephant seals remain viable long term. Before radio-telemetry came into play, researchers only had very limited data available through observations from boats or planes. This led to incomplete assumptions of where the seals spent their time out at sea while not at their rookeries as shown on the left (a) in the figure below (from Costa 2012). While on the right (b) a much more complete picture is shown thanks to tag-collected data:
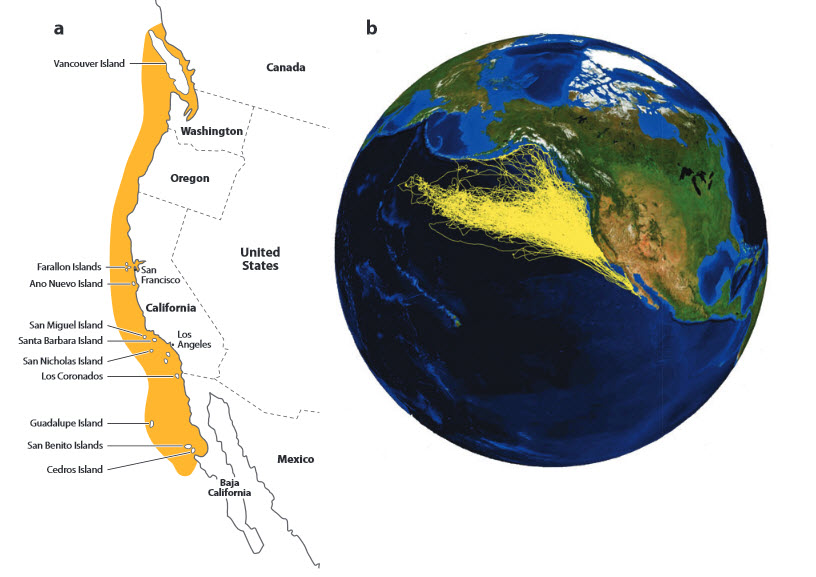 Figure 5: Distribution of seals from „New Insights into Pelagic Migrations: Implications for Ecology and Conservation”, Costa et al 2012
The seals not only provide data about their location at the sea surface but also about the depths they dive to and information about the water temperature and its salinity. Figure 6 below shows an example for the different profiles collected from elephant seals tagged in the Western Antarctic Peninsula:
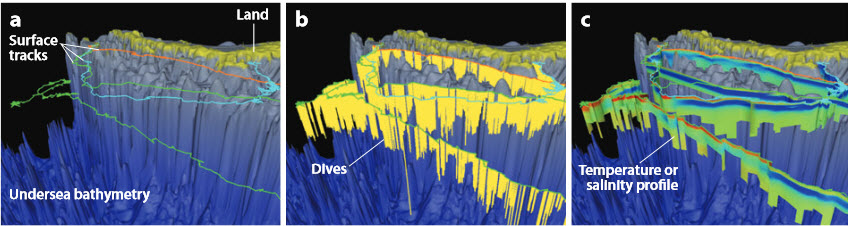 Figure 6: Tracks of three southern elephant seals in the Western Antarctic Peninsula. Panels show (a) just the surface track, (b) the surface track along with diving behavior, and (c) the temperature and salinity profiles that can be obtained to provide data on the physical environment the animals are moving through. (Costa et al 2012)
At the end of the 20th century a kind of “Eureka-moment” must have happened when the researchers put two and two together and realised that the data collected by the seals would also be of interest to climate researchers to flesh out the data coming from the Argo-floats and XBT-measurements. The seals obviously don’t have a problem with diving below the sea-ice and they also do not drift away from Antarctica due to ocean currents. Adding the seal-collected data provides many more data points from closer to Antarctica (left panel) than the other measurments can provide (right panel) in figure 7 below:
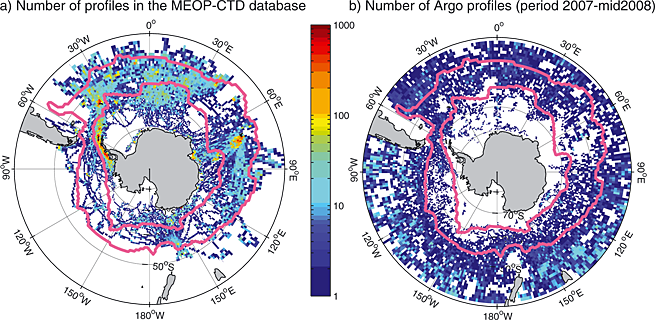 Figure 7: Estimates of the Southern Ocean general circulation improved by animal-borne instruments (from Roquet, F., et al. (2013))
A case study: Why did the Wilkins ice shelf disintegrate so quickly in 2008?
In spring 2008 there were many reports about the Wilkins ice shelf disintegrating over the course of just a few weeks and NASA still has a page about this event on its website. When researchers tried to understand how this break-up happened so quickly they couldn't, because it would have required more heat to de-stabilize the ice than they could account for. Other factors like the mass balance of the icesheet were available and had already been included in the calculations.
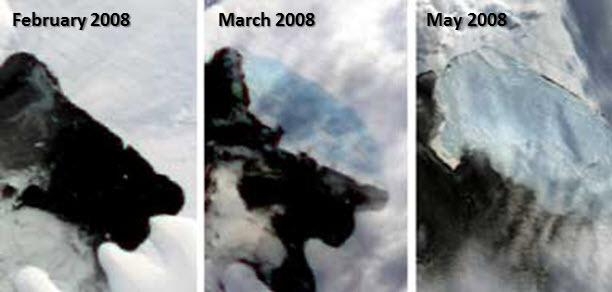
The breakup of the Wilkins Ice Shelf between February and May 2008 (from NSIDC)
This is where tagged seals were able to provide the missing piece of the puzzle. Dan Costa from UC Santa Cruz with colleagues from the US Antarctic Marine Living Resources (AMLR) Program deployed tags on southern elephant seals from the AMLR summer field station on the South Shetland Islands. The tags relay the animals’ position, their behaviour and data on the water temperature and salinity via ARGOS satellites. During the deployment period the Wilkins Ice Shelf collapsed over a three month period.
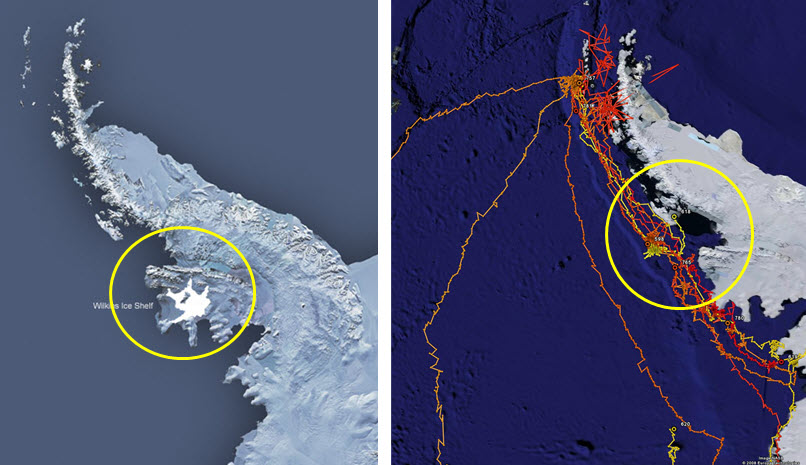 Figure 8 -left: The Wilkins Ice Shelf prior to collapse in relation to the Antarctic Peninsula - right: seal tracks in relation to the Wilkins Ice Shelf. Notice that the tracks originate from the northern part of the Peninsula. This is where the tags were deployed on Livingston Island. (Dan Costa)
Dan Costa provided the seal diving and temperature profile data to Laurie Padman of Earth & Space Research, Corvallis, Oregon who noticed that the animals sometimes dove deeper than the reported underwater topography, or bathymetry, of this area. This was not surprising as the bathymetry of this area is poorly known. Laurie Padman then used the seal data to correct the bathymetry. Wherever a seal dove deeper than the known bottom, the researchers knew that it was deeper. The colored regions in the left-hand figure 9 below show the seal corrected bathymetry. This led to the discovery of a series of troughs or canyons (red arrows), deeper regions in the continental shelf than had previously been known to exist.
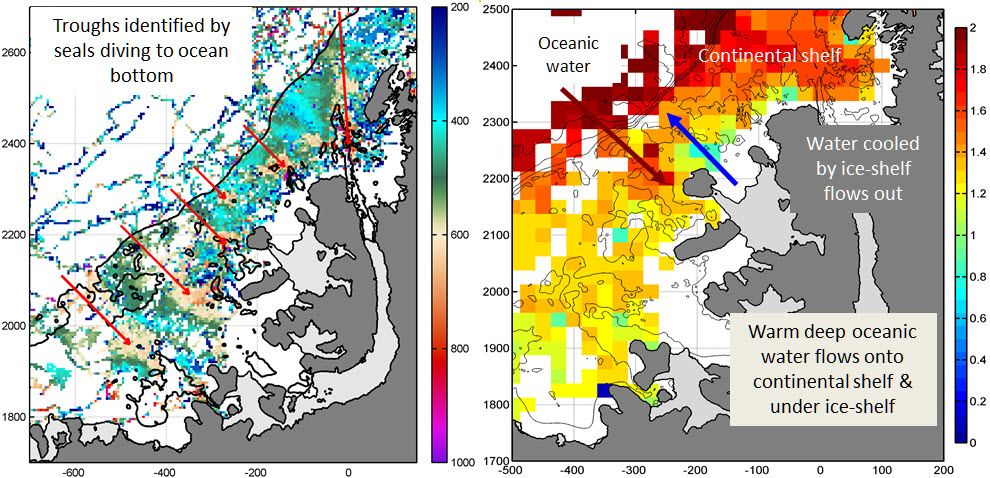 Figure 9: Seal enhanced bathymetry data (left) and water temperature (right) – (from Padman et al (2010))
These troughs provide an avenue for warmer deep oceanic water to intrude up and onto the continental shelf and eventually under the Wilkins Ice Shelf. This brings additional heat onto the continental shelf and under the ice shelf. Thermodynamic calculations showed that atmospheric heat alone was insufficient to account for the breakup of the ice shelf. The addition of the deep oceanic water was sufficient to account for the needed heat to cause the break up. This is now recognized as a very important component of the heat budget of ice shelves and their stability. The seals provided data on this process as seen in the right-hand panel in the image above. Here the warmer oceanic water (aka Circumpolar Deep Water or CDW) can be seen by the temperature readings taken by the instruments carried by the seals. The warm CDW water can be seen moving onto the continental shelf and under the ice shelf by the red boxes and red arrows. In turn the now cooled water can be seen leaving from under the ice shelf by the blue arrows.
Here is a summarised picture of what was discovered and the Weddell seal pictured sure looks pretty satisfied with its and its “friends’” accomplishment!
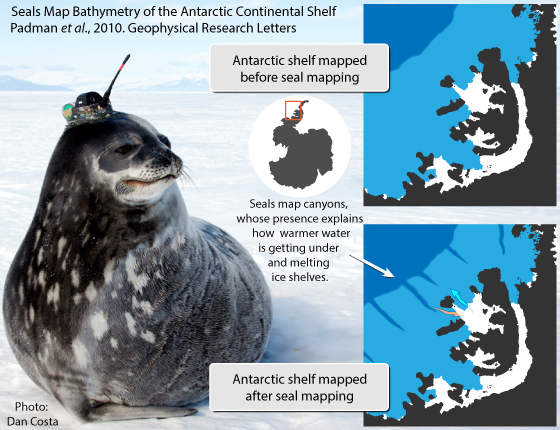 Figure 10: Simplified version of seal-discovery - (seal photo: NMFS 87-1851-03)
Thanks to Dan Costa and his team for providing the information to put together this post! I'd also like to thank Prof. Dr. Martin Wikelski (Max Planck Institute for Ornithology) whose presentation at this year's nature conservation convention in Radolfzell planted the seed for this article.
Additional Information:
To get an idea of where and which animals are being tracked – including some of Dan Costa’s tagged seals -, check out Movebank, a nascent global database on animal movement data and a first step towards ICARUS – the “International cooperation for animal research using space”. Once implemented by the end of 2016, thousands of tagged animals will provide data from around the world sent to antennas yet to be installed at the I.S.S. The data will not only provide information about the whereabouts of individual animals but will also collect weather and climate related information from around the globe.
Large-scale and long term studies like the one of northern elephant seals at Ano Nuevo are only possible thanks to the UC Natural Reserve System. This is a network of reserves, which protects natural areas and encourages and facilitates scientific research.


I'm sorry, but that seal looks very much like she's saying "Does this hat make me look fat?"
Actually, I have a serious question, concerning the graph of ocean heat versus atmospheric heat. Long ago, I did the calculation of the relative heat capacities of the oceans and the atmosphere and came up with a result of 99% of the net heat capacity of the two was held in the oceans. I have seen other calculations yielding 99.9%, 99%, and even 90%. Figure 1 suggests 90%. I realize that there are complexities arising from freshwater, and the amount of water vapor in the air, especially involving the latent heat in water vapor. Can somebody please explain the basis for the different answers?
Chris - They are two different things. The ocean has the capacity to hold a thousand times more heat than the atmosphere, but we live on a rapidly rotating sphere where the bulk of incoming energy from the sun is received in the tropics.
In practice, because of Earth's geometry, the shape of the ocean basins, the percentage of land vs ocean in the tropics, and a host of other considerations, we're never going to actually see a thousand times more heat in the ocean than the atmosphere.
The 93.4% figure is the percentage of heat going into the ocean, whereas the specfic heat capacity is an idealized scenario.
Thanks, BaerbelW and Anne-Marie Blackburn, for a very interesting post!
Thanks for explaining that for me, Mr. Painting. I had not taken into account the differences due to distribution between land and ocean as a function of latitude. I suppose that there are further differences between the heat capacity in ideal conditions and the heat capacity in practice.
Thanks again.
That graph is showing the change in heat content. So the relative values probably reflect the fact that that the temperature of the tropopause has increased more than the temperature of the ocean, combined with the much larger volume of the tropopause compared to the volume of ocean water that has undergone a measurable increase in temperature. That's just a guess though.
I'm guessing that the heat absorbed to produce the net loss of ice is also included in the land-ice-air value.
There is also some heat involved in raising the land's temperature. It would be interesting to see that calculated. I can't imagine that heat would penetrate far below the land's surface, but it would have to gain some heat to keep the surface temperature in a rough equilibrium with the increased air temperature over land.
WRyan:
This figure on page 13 in Earth’s energy imbalance and implications by James Hansen et al shows the estimated energy imbalance (rate of warming or cooling) for different parts of the climate system given as watt/m² spread over the entire surface of the Earth.
Notice that the atmosphere has accumulated a nearly negligible fraction of the entire climate system’s heat increase and a pretty small part of the non-ocean climate system as well. The amount of heat penetrating into the ground is several times larger than the accumulation in the atmosphere and the second largest component of non-ocean, after the melting of sea ice and ice sheets.
Regarding the heat capacity of the ocean vs. the atmosphere:
Water has about 4 times larger heat capacity than air measured by mass, i.e. it takes 4 times more energy to heat one gram of water by 1°C than one gram of air. The total mass of the oceans is about 250 timer larger than the atmosphere, hence the 1000-fold larger heat capacity overall.
Thanks for the graph.
Older calculations had the atmospheric warming at around 2% of the total heat content. These two graphs include periods after 2005 where the atmosphere was not warming. So this difference in atmospheric heat gain might be due to this lack of temperature increase, or maybe Hansen is using a different way calculating heat gain for different parts of the system than was used in the earlier calculations.
With regard to the different heat capacity of the ocean and atmosphere, the absolute heat content of the two systems is not in question here. Rather we are looking at their respective changes in heat content.
The changes in heat content depend on their respective specific heat capacities and the respective changes in average temperature of each system.
The troposphere has had a fairly uniform temperature increase throughout its entire mass. So we can calcualte its increase in heat content by using its entire mass. I don't know if the same can be said of the ocean.
I imagine that heat distribution in the ocean is much slower than heat distribution in the atmosphere, so the temperature increase of the upper ocean is probably different to the temperature change in the deeper ocean. So I don't know how accurate it would be to use the total mass of the ocean when calculating heat gain in recent periods unless you had the average temperature increase for the entire ocean.
WRyan:
I think the different numbers depend on what period Hansen and others have used in their calculations. Hansen was probably most interested in the recent energy imbalance.
Based on figure 1 here and temperature data from GISS I got the following results for the troposphere’s fraction of the total heat accumulation:
1961-2008
1.5 %
1975-1998
2 %
1993-2008
1.2 %
The higher fraction of tropospheric warming in the second period is caused mostly by a very slow ocean warming between 1975 and 1990 compared to the warming we have seen after that.
It’s worth noting that the linear trend for the troposphere between 1993 and 2008 was 0.22°C/decade, and that is actually higher than the trend between 1975 and 1998 (0.18°/decade).
BTW, this graph clearly shows that the ocean warming has been far from uniform. Note that the difference between these depth intervals would be even larger if they didn’t overlap each other.
Here is an update about the ICARUS project mentioned in the article: it took longer than expected but the antenna is now scheduled to be attached to the I.S.S. during a 6 hours space walk by Russian astronauts Artemyev and Prokopyev on Wednesday, August 15 2018 starting on 11:58am Eastern U.S.
It will be broadcast live on NASA.TV which you can tune in to here:
https://www.nasa.gov/multimedia/nasatv/index.html#public
A recent article published by Esprit Smith on NASA's website on December 4, 2019 provides another example where data collected by seals around Antarctica provides new insights:
Seal Takes Ocean Heat Transport Data to New Depths
The article includes a link to a related post written by Carol Rasmussen and published on May 2, 2019:
Data with Flippers? Studying the Ocean from a Seal's Point of View
H/t to David Kirtley, who made me aware of the article.