Climate Science Glossary

Term Lookup

Enter a term in the search box to find its definition.

Settings

Use the controls in the far right panel to increase or decrease the number of terms automatically displayed (or to completely turn that feature off).

Term Lookup

Settings


All IPCC definitions taken from Climate Change 2007: The Physical Science Basis. Working Group I Contribution to the Fourth Assessment Report of the Intergovernmental Panel on Climate Change, Annex I, Glossary, pp. 941-954. Cambridge University Press.

Home Arguments Software Resources Comments The Consensus Project Translations About Support

Bluesky Facebook LinkedIn Mastodon MeWe

Twitter YouTube RSS Posts RSS Comments Email Subscribe


Climate's changed before
It's the sun
It's not bad
There is no consensus
It's cooling
Models are unreliable
Temp record is unreliable
Animals and plants can adapt
It hasn't warmed since 1998
Antarctica is gaining ice
View All Arguments...


Username
Password
New? Register here
Forgot your password?

Latest Posts

Archives

Zebras? In Greenland? Really?

Posted on 11 April 2011 by Daniel Bailey, mspelto

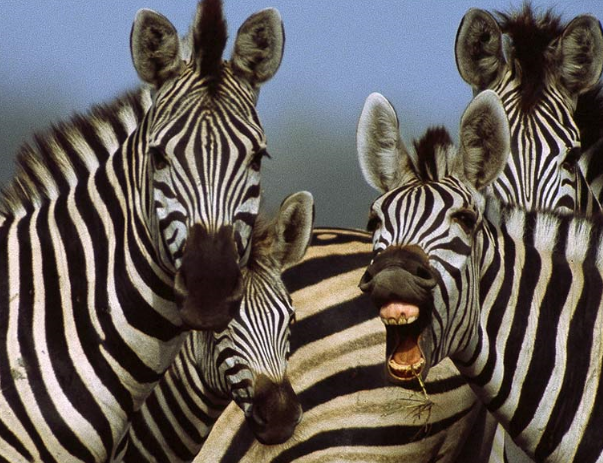
At first glance, zebras are all the same.  Sure, you can argue that they are black with white stripes or white with black stripes.  But nobody really cares; they're Zebras, after all.

Fig 1.  Zebras (Equus Hippotigris; image courtesy National Geographic)

Just as each zebra has an individualized set of stripes, making them unique, so also are each of the individual glaciers in Greenland unique.  They each have varied lengths, heights, widths, fjord geometries, differently-sized accumulation zones (where they "pack on weight") and flow speeds.  Each is located in a different part of Greenland and thus are also affected differently by their latitude, oceanic currents (for the marine-terminating glaciers), weather and climatic patterns.  And also by the modifying effects of Arctic amplification of the warming of the globe.

Variations in Greenland Ice Sheet outlet glacier behavior

The Greenland Ice Sheet has an area of 2.17 million square kilometers (1.28 million square miles) and spans 18o degrees of latitude from north to south.  It is not surprising that over this vast area that the geology and climate vary substantially and that this leads to variations in behavior of Greenland glaciers.  Our tendency is to lump the Greenland Ice Sheet into one category impacted similarly by each of the dynamic forces that impact flow. This is akin to saying banks, credit unions and savings and loan institutions are impacted similarly by all the economic forces.  In the case of a recession there is a shared signal, just as with global warming there is a shared signal amongst Greenland glaciers.   This is a simplification that does not work.  In this article we divide the glaciers into four main categories to illustrate the different properties and sensitiveness of each.

The surface mass balance of the glacier is the difference of accumulating snow on the ice sheet (its income) and snow and ice losses from melting and calving (its expenditures).  The volume of the ice sheet is its asset.  On an ice sheet, the main factor driving flow is simply the mass balance input in the accumulation zone.  The higher the accumulation rate the faster the movement; the accumulated snow is inexorably moved downslope towards the ocean and the margin of the ice sheet.  Observation of a precipitation map (focused not on the outer margin, but on the accumulation zone of the ice sheet) indicates that highest accumulation rates, over 40 cm per year, extend along the western side of the ice sheet to the southeast quadrant of the ice sheet.  

F2


Fig 2. Distribution of precipitation in Greenland (in grams per square centimeter per year). Contours dashed where inferred. Ice-free areas are shown in dark gray. (USGS Satellite Image Atlas of Greenland)


The overall topography of the ice sheet is controlled both by the basal and peripheral geology and the mass balance distribution of the ice sheet.  The higher rates of mass accumulation inland and the greater melting nearer the margin yield a steeper profile for the ice sheet. 

F3


Fig 3. Topographic map of the Greenland ice sheet. The contour interval is 100 m. Local ice caps and ice domes are shown in green. Ice-free areas are shown in dark gray. (USGS Satellite Image Atlas of Greenland)


Figure 3 shows that the contours have the closest spacing along the west margin and in the southeast, just as the high accumulation rates in those areas would suggest.  Thus the combination of the surface slope and the accumulation rate drive faster flow in these regions. 

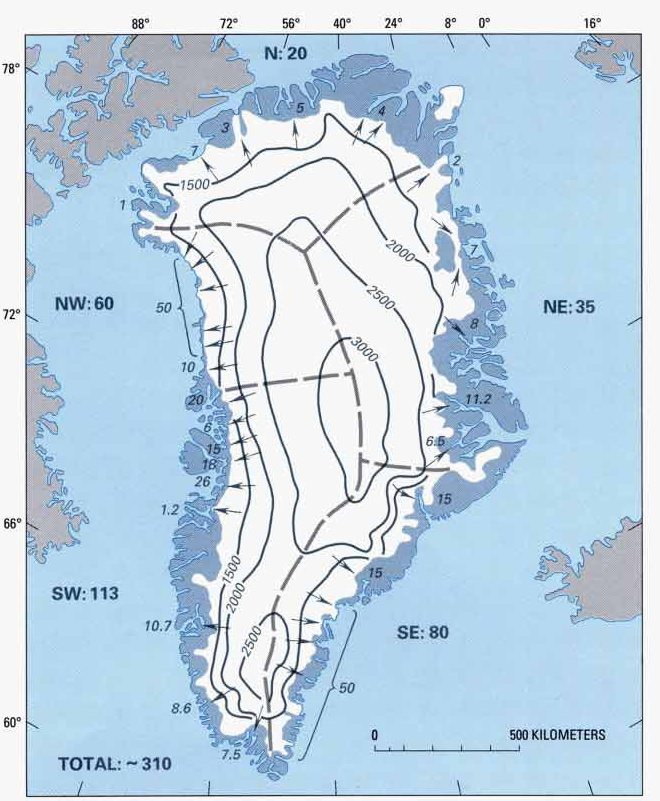
The generalized calving output of each section of the ice sheet (Figure 4, below) indicates the volume flux by quadrant and by glacier in some cases. 

F4


Fig 4. Generalized calving output by quadrant, in cubic kilometers per year water equivalent based on the assumption of an equilibrium state. The contours indicate elevation in meters. (USGS Satellite Image Atlas of Greenland)


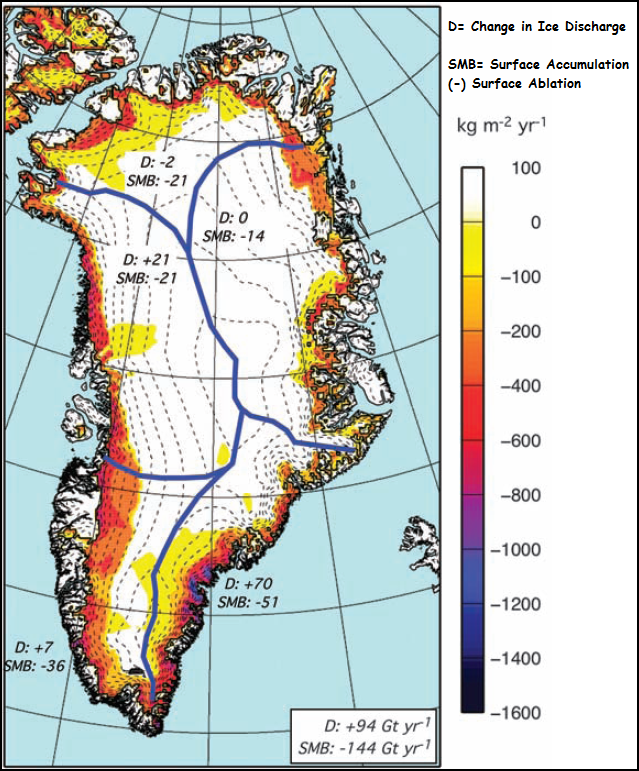
The northern quadrant is one of the largest in terms of the ice sheet perimeter, but the calving output is the lowest at 20 km3.  The northeast quadrant at 35 km3 is the second lowest.  The highest are the southwest and southeast quadrants at 113 km3 and 80 km3 respectively.  The difference is the result of higher accumulation rates.   If we look at more recent work, which examines the changes in volume discharge and surface mass balance, we see the greatest discharge changes and surface loss are in the southeast. 

F5

Fig 5. Higher calving flux indicates higher velocities (Van Den Broecke et al, 2009). D denotes change in ice discharge while SMB denotes the net surface mass balance (accumulation minus ablation).


F6


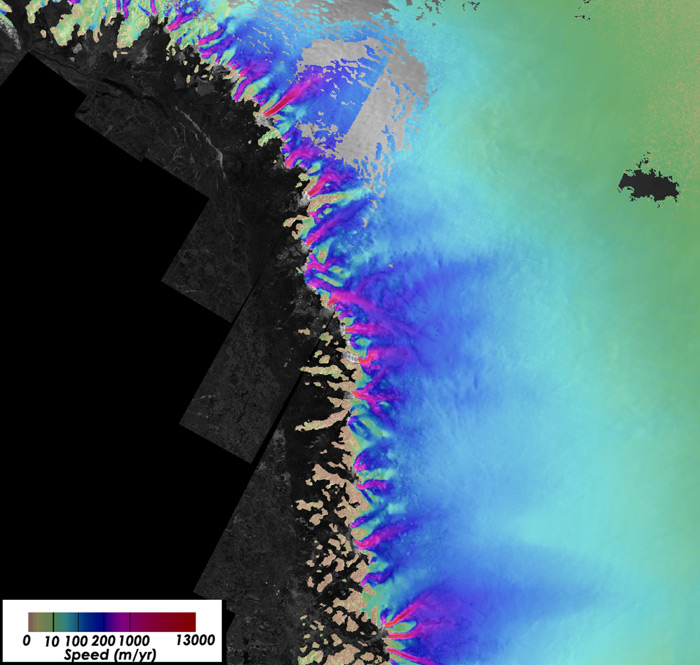
Fig 6. Ice flow speed in Greenland (color) for winter 2006 derived from synthetic aperture radar (SAR) imagery (gray scale image derived from NASA funded research. Because of the large range of speeds (1 -13,000 m/yr), a log color scale is used (Ian Joughlin, Big Ice)


Hence the above velocity map of the glacier will indicate higher average velocities in the quadrants with the highest calving volume flux.  This map indicates relatively low flow rates of less than 10 m/year inland, with particular bands of fast flow that extend well into the ice sheet and feed outlet glaciers.  The variation in flow and accumulation rates indicates the problem of lumping the glaciers into one category. 

Climate change has led to an observed increase in surface melting, surface accumulation, increased discharge and overall mass balance losses.  The very mechanism that establishes the basics of behavior of the GIS mass balance are changing (Zwally et al, 2011).

Greenland glaciers fall into at least 4 common types, each with its own unique sensitivity to sea surface temperature, surface melting, meltwater lubrication, calving changes, etc.

Type 1: Northern, with Large Floating Termini

Northern glaciers with large floating termini (Petermann, Ryder, Steensby, Zachariae, Academy, etc).  Each of these is a marine terminating outlet glacier that has an extensive floating ice shelf.  The large ice shelves can exist in part due to the lower surface melt rates and the lower flow rates of the glacier.  Petermann Glacier is the fastest with a flow speed of 1000 m/year at the grounding line.  This is much less than the average outlet glacier speed along the west coast.  The large floating ice shelves are susceptible to bottom melting but, except for Petermann Glacier, we have no observations of the process or that more warm water is penetrating under these ice shelves.  Rignot and Steffen (2008) found that at Petermann Glacier 80% of the ice loss into the ocean was from basal melting of the floating tongue.  If the ice shelves are removed, the feeding glacier is less buttressed and will accelerate for a period and draw down its surface profile.  The recent ice area lost by Petermann, Academy and Zachariae Ice Stream indicate these glaciers are being impacted by the increased melting at the surface and likely the base of the ice shelf for Petermann Glacier at least. 

Examination of how far the high velocities extend inland in Figure 6 indicates that it is only Zachariae and Petermann that tap far into the ice sheet.  This northern area has low accumulation rates, and a shorter less intense melt season.  The early onset of melting and lack of accumulation in 2010 led to an early exposure of the ablation zone on these glaciers. 

This is their sensitivity Achilles Heel:  relatively little increases in melt can expand the ablation zone appreciably given the low surface slopes and low accumulation rates.   Based on the velocity map, it is the Zachariae that is likely the only of this group that would be comparable to a bank that is too big to fail as its increased velocity band extends well into the ice sheet. 

F7


Fig 7. Ice flow speed for Zachariae Glacier (Joughlin et al, 2010)


Type 2: Inland-terminating

Glaciers with inland termini lacking any calving (Sukkertoppen, Frederickshaab, Russell, etc). Between the fast flowing marine terminating outlet glaciers, the ice sheet particularly in the southwest quadrant has numerous glaciers that terminate on land or in small lakes.  The velocity of these glaciers reaches a maximum of 1-2 meters/day.  Each terminates on land because total ablation over the glacier equals total accumulation at the terminus.  These glaciers are more like a typical alpine glacier and are susceptible to the forces that tend to cause alpine glaciers to experience peak flow during spring and early summer.  Those forces are the delivery of meltwater to the base of the glacier, when a basal conduit system is poorly developed.  This leads to high basal water pressure, which enhances sliding.  As the conduit system develops the basal water pressure declines as does sliding, even with more water. F8
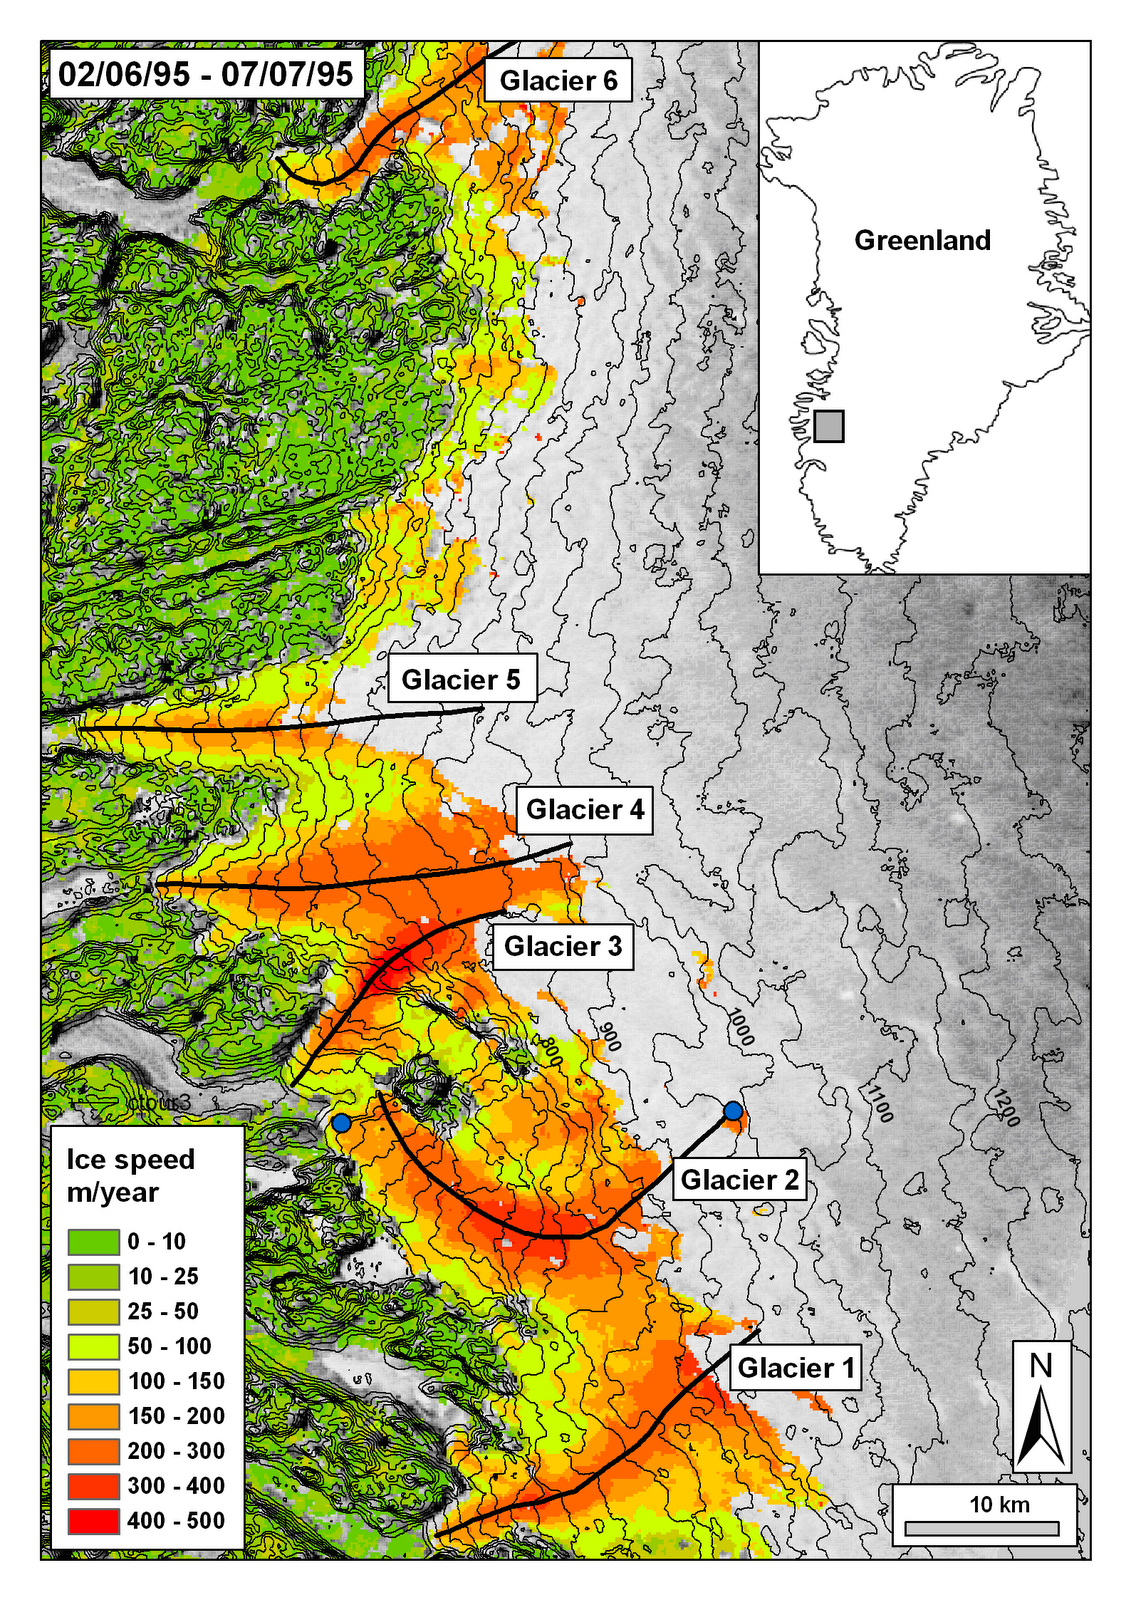


Fig 8. Inland terminating glaciers (Sundal et al, 2011)


This is what has been recently reported to be the case by Sundal et al (2011).  The meltwater lubrication mechanism is real, but as observed is limited both in time and area impacted.  It is likely that, as on alpine glaciers, the seasonal speedup is offset by a greater slowdown late in the melt season.  Most observed acceleration due to high meltwater input has been on the order of several weeks, leading to a 10-20% flow increase for that period.  The role of supraglacial lakes in this has been a point of emphasis; Luthje et al, (2006) noted that the area covered by supraglacial lakes was independent of the summer melt rate, but controlled by topography.  This led Luthje et al (2006) to conclude that  the area covered by supraglacial lakes will remain constant even in a warmer climate.  This suggests that the enhancement of flow by the drainage of such lakes would be limited.

The land terminating glaciers such as Sukkertoppen, Russell and Mittivakkat are retreating significantly in response to global warming.   This is an indication of negative mass balance. The latter glacier in southeast Greenland has retreated 1200 meters since 1931 (Mernhild et al, 2011).  The Mernhild study identified this slow rate compared to the outlet glaciers and, based on mass balance observations, that the current surface mass balance can only support a glacier at most one-third its current size.   This indicates the slow but inexorable sensitivity of the non-calving glacier to surface mass balance change.  Moon and Joughin (2008) observed that the retreat of the land terminating glaciers was relatively minor from 1992-2007, averaging 5 m/year or less.  These glaciers are the equivalent in our banking system to the local banks:  there are many and they are sensitive, but the changes in a single one is not important. 

Type 3: Marine-terminating

Fast flowing marine terminating outlet glaciers of western and southeast Greenland (Rinks, Umiamako, Helheim, Jakobshavn, Epiq Sermia, etc).  These are the glaciers that drain the greatest area of the ice sheet and deliver the greatest volume to the oceans via calving.  The flux from many of the larger glaciers is over 10 km3/year (DMI).  Each of these glaciers is fast-flowing at the terminus; the fast flow section extends inland into the ice sheet up a sub-glacial trough.  The outlet glaciers act like a drain capturing ice from a larger area of the ice sheet than their narrow terminus would suggest.  

F9


Fig 9. Marine-terminating glaciers (Thomas et al, 2009)


Pelto et al (1989), a paper on the equilibrium state of the Jakobshavn Glacier, showed that the terminus had not changed significantly in 30 years; its velocity had also been consistent.  Furthermore, it was observed that the velocity was consistent throughout the seasons.  This indicated that the glacier velocity was not being impacted by the meltwater pulse of summer. 

Bob Thomas (NASA, 2004) and Terry Hughes (University of Maine, 1986) developed the basic mechanism of flow for the glacier that has proven to be true.  The outlet glaciers have a balance of forces at the calving front.  The fjord walls, the fjord base and the water column impede flow.  The slope of the glacier, its upglacier velocity and the height of the calving face strive to increase flow.  If the glacier thins than there is less friction at the calving front from the fjord walls and the fjord base, leading to greater flow.  The enhanced flow leads to retreat and further thinning, resulting in the thinning and the acceleration spreading inland.  In 1990 it was not envisioned that acceleration would occur as soon as it has, yet that was the motivation for the research. 

Figure10

Fig 10. Jakobshavn profile (Thomas et al, 2009)

In 2001 acceleration of Helheim, Jakobshavn and Kangerdlussaq Glacier caught the attention of the world.  By 2007, acceleration had been noted at all 34 marine terminating outlet glaciers observed.

The acceleration was not significantly seasonal; Howat et al (2010) noted a 15% seasonal component to the acceleration, it had spread inland and had led to retreat and thinning.  This demonstrated that the marine terminating glaciers were largely responding to a change in the balance of forces at the glacier front. 
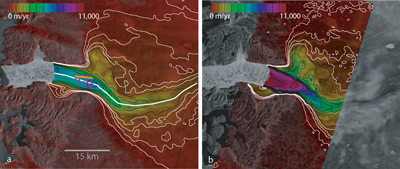
Figure11

Fig 11. Ice flow velocity as color over SAR amplitude imagery of Jakobshavn Isbræ in a) February 1992 b) October 2000. In addition to color, speed is contoured with thin black lines at 1000 m/yr intervals and with thin white lines at 200, 400, 600, and 800 m/yr. Note how the ice front has calved back several kilometers from 1992 to 2000. Further retreat in subsequent years caused the glaciers speed to increase to 12,600 m/yr near the front. (Ian Joughlin, Big Ice)

The recent increases in outlet glacier discharge have always been coincident with floating tongue losses.   This causes reduced back pressure at the glacier front, letting up on the brakes; the resulting glacier thinning leads to less basal friction and further acceleration.  If the glacier front retreats into deeper water the process will continue and increase.  This is why understanding the basal slope changes inland of the calving fronts is crucial. Moon and Joughin (2008) observed the terminus change of 203 glaciers from 1992-2007 and noted a synchronous ice sheet wide retreat of tidewater outlet glaciers. The thinning could be due to increased surface melt, basal melt or most likely a combination of the two.  Moon and Joughin (2008) reported for the 2000-2006 period:

  • In the southeast quadrant 35 glaciers retreated an average of 174 m/year
  • In the eastern quadrant 21 glacier retreated an average of 106 m/year
  • In the northwest 64 glaciers retreated an average of 118 m/year. 

Each quadrant’s retreat increased markedly after 2000.  The largest of this group are comparable to the banks that are too big for our banking system to allow them to fail:  they drain a substantial portion of the entire ice sheet and reach so far into the ice sheet that their behavior can impact that of other adjacent glaciers.

Type 4: Marine-terminating in Shallow Water

Marine terminating glaciers outlet glaciers in shallower water (Humboldt, Cornell, Steenstrup etc).  These glaciers do have calving termini, but lack the large fast flowing feeder tongues extending into the glacier.  This is because there is not a topographic low under the ice sheet that funnels the flow.  Humboldt Glacier is the widest front of any Greenland Glacier, wider even than Petermann Glacier. 
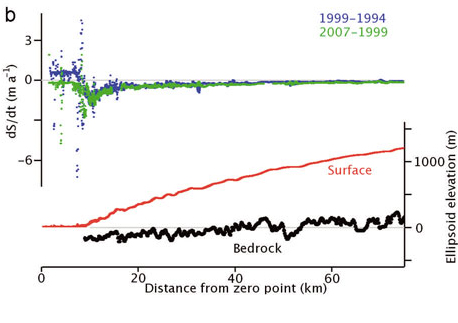
Figure12

Fig 12. Humboldt profile (Thomas et al, 2009)

However, the velocity on average is low at 100 m/year and the base of the glacier is quite high.  This makes it difficult for a large calving retreat of the glacier to occur and extend inland.  Humboldt Glacier is retreating but as the velocity profile indicates the glacier, despite its size, does not tap dynamically into the center of the ice sheet.  These glaciers are substantial, but their failure (though significant for sea level) would not destabilize the ice sheet as a whole.

 Greenland Ice Sheet outlet glaciers: Zebras no more

 Overall in Greenland, the rate of area loss in marine-terminating glaciers during the 2010 melt season (419 km2) was 3.4 times that of the previous 8 years. There is now clear evidence that the ice area loss rate of the past decade (averaging 120 km2/year) is greater than loss rates pre-2000.  The exceptional extension of the ablation season in 2010 in southern Greenland indicates the vulnerability of these areas to expanded melt regions (Box et al, 2010). 

The amazing aspect of Greenland glaciers is that (despite the specific variation in type, location specific fjord configuration, etc) their response has been as uniform and synchronous to global warming as has been observed.  If this warming of the world persists long enough, the  ice “banks” of Greenland will begin to fail.  Those with the greatest reserves on their asset sheets and the fastest turnover, and thus having the greatest potential contributions to sea level rise over time, are:

  • In the north, Zachariae (and to a lesser extent, Petermann)
  • The fast flowing marine terminating outlet glaciers of western and southeast Greenland (Rinks, Umiamako, Helheim, Jakobshavn, Epiq Sermia and Kangerdlussaq)

Further Reading & Resources

  1. Pelto et al (1989)
  2. Luthje et al (2006)
  3. Moon and Joughin (2008)
  4. Rignot and Steffen (2008)
  5. Thomas et al (2009)
  6. Van Den Broecke et al (2009)
  7. Box et al (2010)
  8. Howat et al (2010)
  9. Joughlin et al (2010)
  10. Mernhild et al (2011)
  11. Sundal et al (2011)
  12. Zwally et al (2011)
  13. The USGS Satellite Image Atlas of Greenland

0 0

Printable Version  |  Link to this page

Comments

1  2  Next

Comments 1 to 50 out of 69:

  1. Great post. However, I think coverage of fauna should be subject to the same scientific rigor as the wonderful climate arguments presented here. So, I submit that there is no argument regarding striping in zebras (are US conservatives behind this, too?), they are black with white stripes (Bard, J. 1977. A unity underlying the different zebra striping patterns. Journal of Zoology. 183:527-539.). Further, I would point out that the scientific name in the caption should most likely read Equus quagga (italicized - which is beyond my posting ability). Hippotigris is the subgenus. Yes, a bit nit-picky, but it helps me take my mind off of the pending climate disaster for a bit...
    0 0
    Moderator Response: [DB] Thanks! I actually wanted to use the shot of the zebras congregating around the waterhole from Madagascar 2, but couldn't find one I was happy with...As for jazzing up the comments with HTML Tags, see here. I've also added a bit to the Posting Tips section of the Comments Policy page.
  2. An interesting article, thanks - despite the zebras giving me a headache... (too little sleep last night!) So, it seems that there are a number of different mechanisms involved as to why Greenland glaciers are losing mass. That Zachariae Glacier looks like a doozy, it might be able to move a *lot* of ice if it picks up speed appreciably. One question - with the land-terminating glaciers - is there any prospect of them accelerating and increasing in length with warming, as they continue to thin? I'm still a bit hazy on the dynamics of ice movement, and how temperature affects that - e.g. does ice get more 'fluid' as it warms? Or does -10ºC ice behave much the same as -40ºC ice?
    0 0
  3. Bern - Climatic warming could accelerate land terminating glaciers too. The main mechanism would be by increased surface melting causing an increased volume of meltwater reaching the bed of the glacier. This would help lubricate it and, effectively increase its "slippiness". Ice itself would not really become more fluid as the temperature warms, and I don't believe the basal temperatures would change very much. A lot of the glaciers identified in the marine terminating catagory are in fact ice-streams, the most dynamic sectors of ice sheets. These are of upmost importance to the wellbeing and mass balance of the Greenland Ice Sheet.
    0 0
  4. Wow, I geeking out to this post. Ill pop over to nevens and drop a link. Its a corker.
    0 0
  5. This may be o/t but what happens when/if it rains? There is no soil to soak up the water so does it become a serious flood? Will that accelerate the glaciers flow rate and ablate some snow of off the top layer?
    0 0
  6. Increasing the meltwater discharge to the land terminating glacier does not lead to further acceleration automatically. If there is already sufficient meltwater to lead to high basal water pressure, than further melting as Sundal et al (2010)notes does not cause acceleration, it can reduce the meltwater further matures the drainage system. Mature drainage systems as exist on large temperate outlet glaciers in Alaska tend to limit the summer acceleration. As noted above it also not clear that any short term acceleration from such meltwater events does not lead to a following deceleration. In the northern portion of Greenland where melting is more limited is the only sector where there is good potential of more meltwater enhancing annual flow signficantly. Rain is a daily occurrence on many large Alaskan outlet glaciers and in amount it can rival and enhance meltwater, but it does lead to any acceleration of the larger glaciers, which already have plenty of meltwater and a high basal water pressure. Pelto et al (2008) looking at the consistent flow of Taku Glacier is a good example of this. The vecloity consistency observed from Jakobshavn Pelto et al (1989) noted also spanned several years with vastly different weather conditions.
    0 0
  7. Terific post. It is great to be able to read a carefully written and referenced account by people who know what they are talking about. Thanks a lot. Does the strength of the ice change much as the temperature changes from say -20 to 0C? How much difference is there in the flow rate of glaciers that are 0C compared to ice in the interior that is lower temperature? What is the temperature of the ice in the interior of Greenland and is it warming in response to AGW? Is there a reference to temperatures made during ice cores that I can read?
    0 0
  8. Interesting post. I only got as far as "Type 1: Northern, with Large Floating Termini" and got side-tracked into reading the Rignot and Steffen (2008) paper. Can you just confirm it's this one as there is no link for it? It would seem that warming water under the glacier is crucial here, are there any actual observations of that warming? I thought the Rignot and Steffen paper seems to actually highlight dynamical issues with regard to what is happening on this glacier. For example they highlight the role of channel formation at the bottom and it's potential role in "severing the glacier into large blocks". That can't be good for glacier stability. Secondly can you just help me reconcile your comment "The recent ice area lost by Petermann, Academy and Zachariae Ice Stream indicate these glaciers are being impacted by the increased melting at the surface and likely the base of the ice shelf for Petermann Glacier at least." with this from the paper "Ice velocity was mapped using Radarsat-1 InSAR data with a 10-m/yr precision at 50-m posting. We detect no interannual variability in speed averaged over 24 days between year 2000 and 2006...... Petermann Glacier has had stable flow conditions over the past decade." they seem to me to be related and contradictory.
    0 0
  9. @ HR Thanks for pointing out the link to Rignot and Steffen (2008)! I will amend the text of the post above to reflect that shortly. Remember the focus of Rignot and Steffen (2008) is on the floating ice tongue of Petermann glacier only. Reading the paper shows that actual confirmation of the basal melt was made. And no, it's not good for the long-term stability of Petermann (or any other similarly-structured floating ice shelf). The statement about recent ice area lost is due to the recent calving events of those glaciers, primarily that of Petermann ice island B last year. Since that event was subsequent to the publication of Rignot and Steffen (2008) it is not at all contradictory to it. Thanks for your input, The Yooper
    0 0
  10. Terminus calving events of a floating tongue the size of the Petermann Glacier are not expected to be related to a flow change over the period of time observed by Rigot and Steffen. This is not one of the rapid outlet glaciers of the Jakobshavn type with a small floating tongue that is less than a few months worth of movement long. Petermann instead requires many decades for ice to get from the grounding line to the terminus. Sweet Question in #7, I will have time to address it five hours hence.
    0 0
  11. First in real terms if you have ever been on the same ice covered pond on a -10 C day and on a 0 C day you will notice a difference in the hardness of the ice. Ice is hard in both cases, but is more deformable the warmer it gets. Ice that is -20 C is found to be 10-15 times as hard as ice that is at 0 C. This does not mean it falls apart, just that it deforms more easily. Now since most ice motion occurs near the base on an ice sheet and for the GIS this ice is mainly close to or at the pressure melting point, the impact is not as large as you might first think. The cold ice is more in the middle of the depth profile where because of much reduced pressure, deformation forces are less. In the basic Glen's flow law of ice there is a parameter (A) that is really a measure of the hardness of ice. This parameter depends on temperature, impurities in the ice and the degree to which crystal orientation is preferential to the main stress direction. The law is Strain rate=A(shear stress)3rd. For a further detailed discussion with examples of the depth velocity profile and the depth temperature profile see Copenhagen Universities Centre for Ice And Climate
    0 0
  12. Might I just point out that evidence of warming, like melting Greenland glaciers, is not evidence that it was humans that caused the warming. The Greenland climate is pretty complex, and there is plenty of evidence to believe that it's climate is not driven by CO2. Look, the current Greenland warming is very similar to a previous period of warming in Greenland. All of the Greenland temperature data showed that it was warmer or at least as warm as it is today, in the 1930's and 1940's. I suggest that you read the following paper: "Greenland warming of 1920–1930 and 1995–2005" by Petr Chylek et al, published in 'Geophysical Research Letters' (2006) http://www.joelschwartz.com/pdfs/Chylek.pdf Abstract- "We provide an analysis of Greenland temperature records to compare the current (1995– 2005) warming period with the previous (1920 – 1930) Greenland warming. We find that the current Greenland warming is not unprecedented in recent Greenland history. Temperature increases in the two warming periods are of a similar magnitude, however, the rate of warming in 1920 – 1930 was about 50% higher than that in 1995 – 2005." Conclusion- "iii) Although the last decade of 1995 – 2005 was relatively warm, almost all decades within 1915 to 1965 were even warmer at both the southwestern (Godthab Nuuk) and the southeastern (Ammassalik) coasts of Greenland. [18] iv) The Greenland warming of the 1995 – 2005 period is similar to the warming of 1920 – 1930, although the rate of temperature increase was by about 50% higher during the 1920– 1930 warming period. ...... To summarize, we find no direct evidence to support the claims that the Greenland ice sheet is melting due to increased temperature caused by increased atmospheric concentration of carbon dioxide. The rate of warming from 1995 to 2005 was in fact lower than the warming that occurred from 1920 to 1930." Now if Greenland was warmer 60 years ago, when it couldn't possibly have been us back then, then surely it is reasonable to believe that humans are not the cause of it's current heat wave. The 1930's heat wave was driven by natural causes (agreed?), which means it is equally possible that Greenland's current warming is of natural causation. The fact that the ice sheet was warmer 60-70 years ago shows that all of the dramatic melting it is experiencing, isn't unprecedented in it's history. It's like a cycle. The Arctic/Greenland has heat waves about every 60 years, and in between that, it has colder periods, which is what has been observed. There isn't any actual proper evidence that the current Greenland warming has got anything to do with CO2. Greenland's climate doesn't show any anthropogenic signal over the past 100 years; and the current ice sheet loss can indeed be explained naturally. Most of what has been presented in this article, about the melting glaciers, I do agree with, I just don't agree with the claim that it is caused by humans.
    0 0
  13. Adam #12 - first off, Greenland isn't the world. The planet is much hotter now than it was in 1930. Secondly, the fact that the planet warmed naturally in the past doesn't mean it's warming naturally now. We know current warming isn't natural because that's what the physical evidence clearly shows.
    0 0
  14. Dana, I think you'll agree that Greenland is very important for the whole climate change issue. News medias have constantly cited Greenland's melting ice as clear evidence for AGW. The theory that the Greenland warming is caused by humans, is a major part of the whole theory of anthropogenic global warming. Polar patterns are especially important. They should show more sensitivity to anthropogenic greenhouse gases if the theory was correct. Now CO2 is much higher than it was in the 1930's; yet in the 1930's Greenland was warmer than it is today. Therefore, simple logic should show that if Greenland was naturally warmer in the past, then it is plausible that it's current heat wave is natural. I am not claiming that the planet has warmed naturally before, so therefore current climate change is natural. What I am saying is that current Greenland climate change is not unprecedented. The same amount of melting Greenland is experiencing today, it also experienced 60 years ago. I think you should read the paper I gave you. It explains about both heat waves and why there is nothing unusual about the current state of Greenland's climate.
    0 0
  15. I also suggest that you read this paper: “Observationally based assessment of polar amplification of global warming” http://www.cfa.harvard.edu/%7Ewsoon/MattCronin-Mar21-07-d/Polyakovetal02-PolarWarmingGRL.pdf The abstract “Arctic variability is dominated by multi-decadal fluctuations. Incomplete sampling of these fluctuations results in highly variable arctic surface-air temperature (SAT) trends. Modulated by multi-decadal variability, SAT trends are often amplified relative to northern-hemispheric trends, but over the 125-year record we identify periods when arctic SAT trends were smaller or of opposite sign than northern-hemispheric trends. Arctic and northern- hemispheric air-temperature trends during the 20th century (when multi-decadal variablity had little net effect on computed trends) are similar, and do not support the predicted polar amplification of global warming.” conclusion “Arctic and northern-hemispheric air-temperature trends over the 20th century, when multidecadal variability had little net effect on computed trends, are similar and do not support the hypothesis of the polar amplification of global warming simulated by GCMs. It has been hypothesized that this may be due to the moderating role of arctic ice. Evaluation of fast- ice melt required to compensate for the two-fold enhance- ment of polar warming simulated by GCMs shows that the equired ice-decay rate would be statistically indistinguish- able from zero, given the substantial intrinsic variability observed in the data. Observed long-term trends in arctic air temperature and ice cover are actually smaller than expected, and may be indicative of complex positive and negative feedbacks in the arctic climate system. In summary, if we accept that long-term SAT trends are a reasonable measure of climate change, then we conclude that the data do not support the hypothesized polar amplification of global" Dana, if greenhouse gases were warming our planet, the first signs we would expect to see of it would be at the poles. Polar regions are very sensitive. All of the climate models predict that polar areas would amplify the heat from greenhouse warming. Yet, as shown by that paper, real world data does not support the theory of predicted polar amplification of global warming. This is strong evidence against AGW. The Arctic/Greenland climate changes are not anthropogenic.
    0 0
    Moderator Response: [muoncounter] Please do not quote large sections of linked papers. The link and a key sentence or two should be sufficient to get your point across.
  16. Adam - "I am not claiming that the planet has warmed naturally before, so therefore current climate change is natural." Actually that is precisely what you are arguing. By the way, although polar amplification is obviously a reality, given that the Arctic is the fastest-warming part of the planet, I don't think it's a specifically anthropogenic signal. Polar amplification is due to the feedback from melting ice. Would you care to explain why polar amplification is specific to greenhouse gases?
    0 1
  17. Adam, Please review the thread Greenland was warmer in 1940 and post your claims there. You will see that the data you are presenting has been cherry picked. In addition, in 2010 records were set across Greenland for heat so your linked papers are out of date. Your comments about the entire Arctic having been as warm in the 1940's are simply false. There was always much more ice in the Arctic from the time Cook explored there in the 1700's until the catastrophic decline of the last 30 years.
    0 0
  18. @ Adam (12, 14, 15) Appreciate your concerns, and the links to published data. However, Greenland does not exist in a vacuum, nor is it normally particularly meaningful to make decadal comparisons of data, as the results are highly dependent on the choice of the starting periods. Chylek 2006 did the best they had with the limited scope of their paper and their source data. Chylek 2009 (IMO a much more meaningful paper) looked at arctic amplification over more robust periods of time and found that the ratio of the amplification in the earlier timeframe to be higher than the latter (not specifically your point but a heckuva read nonetheless). But, to Dana's point, we know the globe is presently warming more now overall than it did earlier in the 20th century (indeed, current temps are equivalent to those reached in the Holocene Maximum/Altithermal) and for differing (read:anthropogenic) reasons. Looking at the best available data:
    Note: Gray areas signify missing data. Graphics bug: Occasionally the color for the .5-1C range is replaced by gray. Note: Ocean data are not used over land nor within 100km of a reporting land station.
    1995-2005_Zonal_Mean
    Note: Gray areas signify missing data. Graphics bug: Occasionally the color for the .5-1C range is replaced by gray. Note: Ocean data are not used over land nor within 100km of a reporting land station.
    2000-2010_Zonal_Mean
    Note in all cases the greater recent warming of Greenland (where data exists to make a comparison) than during the earlier periods. HTH, The Yooper
    0 0
  19. Whoops, posted my link too fast. The link in 17 talks about the AArctic and not Greenland specificly. It appears that your specific argument has not yet been addressed. In any case, 2010 set records across Greenland and your generalization to the Arctic as a whole is incorrect. By itself the retreat of glaciers in Greenalnd is not proof of AGW. It is a piece of the puzzle that all adds up to proof.
    0 0
  20. Dana, no that is not what I am arguing. What I am saying is that the Greenland climate is simply not unprecedented. Co2 is higher than it was in the 1930's, yet the ice sheet was warmer back then. Michael  Sweet the link you provided did not focus on the greenland ice sheet.  It focused on the entire Arctic ocean, which is not what I was referring to. I agree that for the past 5-10 years, Arctic temperature has slightly exceeded the 1930's warming. However, Greenland's temperature data shows that it was still warmer in the 1930's. What I have said is correct. This article focuses on Greenland glaciers, so therefore that is what I'll be focusing on. There are many other papers, which show that the ice sheet was indeed warmer back then, and therefore it's current state would not be unprecedented. I am not 'cherry picking'. The paper I provided was published and peer reviewed by other scientists, and there are many others which confirm it's argument. “In addition, in 2010 records were set across Greenland for heat so your linked papers are out of date.” Michael, one year is not statistically significant. You have to look back, and look at the temperature variations on decadal scales. One year is not going to tell us anything about Greenland's climate, or the causes of it's temperature variations. “Your comments about the entire Arctic having been as warm in the 1940's are simply false.” No it's not. Once again, read the paper I provided. Here is another one: “Extending Greenland temperature records into the late eighteenth century ” by Vinther et al (2006) http://www.cru.uea.ac.uk/cru/data/greenland/vintheretal2006.pdf It examined Greenland temperature records for the past 250 years, and concluded “The warmest year in the extended Greenland temperature record is 1941, while the 1930s and 1940s are the warmest decades." Now this paper was not written by skeptics. Two of its authors were Phil Jones and Kieth Briffa, who both play a major part in supporting AGW. Therefore, since this paper is written by two AGW scientists, I think that paper would be the best one to use to show that Greenland was indeed warmer 60 years ago. Daniel Bailey “nor is it normally particularly meaningful to make decadal comparisons of data, as the results are highly dependent on the choice of the starting periods.” Decadal comparisons are actually the best you can use, for finding out about current periods. Now, in theory the anthropogenic contribution to global warming, supposedly started around 1975. Therefore, according to the theory, the Greenland warming of the past 20 years, must have been human caused. But Daniel, if you look back on a decadal time scale, you will see there is nothing significant about how Greenland is today. Like I said, CO2 is much higher than it was 60 years ago. If you look back for say 100-200 years, you'll see that it is likely the current Greenland climate Is not driven by CO2. Michael Sweet could you please explain your statement “By itself the retreat of glaciers in Greenalnd is not proof of AGW. It is a piece of the puzzle that all adds up to proof.” How is it a 'piece of the puzzle'. All it provides is evidence of warming, and says nothing about the cause of warming.
    0 0
  21. Adam, If you wish to take a single piece of data and claim there is a small problem with it, you can challenge many things. The point is that all the data leads to the same conclusion: that humans are causing the temperature to raise. Can you suggest an alternate mechanism for the entire globe to increase in temperature? This data on Greenland is an example of that data, which suports the AGW conclusion. Why does all the data point the same way? If it was not from the same cause the data would point in different directions. You are extrapolating the Greenland temperature to the rest of the Arctic which is incorrect. The rest of the Arctic was not warm in the 1940's. See the link I provided above for the Arctic data.
    0 0
  22. @ Adam Look again at the graphs I generated above on the polar projections for the Arctic, both for the periods covered by Chylek 2006 and the most recent 10 year trend. In both, Greenland is warmer in the recent interval than the earlier. It is the lack of data from the earlier timeframe that keeps us from concluding with very high confidence that the entirety of Greenland is now the warmest in the instrumental era. Your comments about CO2 levels relative to temperatures quite frankly betray a lack of understanding of the time lags involved in order for temperature equilibria from CO2 forcing to be realized. As that is off-topic here, you can find many more appropriate threads than this to further your knowledge. The thrust of your position, that CO2 is not driving Greenland (or any other) climate change, is similarly off-topic here. The Yooper
    0 0
  23. Now Daniel, the point of your article is that Greenland glaciers are melting rapidly due to global warming. But this is only evidence of warming and not anthropogenic warming. I have not seen any credible evidence that the current Greenland warming is caused by humans. It is very likely that the same amount of melting you describe in your article also happened 60 years ago. Dana is misunderstanding what I am saying. I' m not saying it's warmed naturally before, so it's current warming must be natural. I am just saying that the melting of glaciers that you describe is well within the natural variability of Greenland's climate, and is not likely to be caused by CO2. Really the only clear evidence that humans have got anything to do with post 1980 greenland warming is computer models, and as shown by Polyakov's 2002 paper, they have failed to replicate the current Arctic climate. I also suggest you read this paper, which supports the same conclusion that the current Greenland climate is not unprecedented: "Greenland ice sheet surface air temperature variability: 1840-2007” by Jason Box et al, published in the 'Journal of Climate (2009) http://polarmet.osu.edu/PolarMet/PMGFulldocs/box_yang_jc_2009.pdf Look, when looking back at past temperature data for Greenland, you can see that there is nothing unusual or unprecedented about the past 20 years of warming. It is very difficult to detect any anthropogenic signal in Greenland's climate. A lot of the temperature and ice variations are very hard to be explained by CO2. I think that based on what we know about Greenland's climate, and it's history, the most plausible explanation is that it's current climatic changes are of natural causation.
    0 0
  24. Adam - Greenland doesn't exist in a bubble. I have a hard time understanding how you can argue that the increased greenhouse effect, which we know is warming the planet, isn't warming Greenland. It's true that there was a significant warming event in Greenland in the early 20th century, in which human greenhouse gas emissions only played a small role, but the existence of a previous natural warming doesn't mean that the current warming can't be anthropogenic. That's a logical fallacy. By the way, your Jones and Briffa reference only contained Greenland temperature data up to 2000. Here's the up-to-date data from Jaxon Box's website.
    0 0
  25. "This data on Greenland is an example of that data, which supports the AGW conclusion. Why does all the data point the same way?" Michael could you please explain that statement? Could you explain how data from Greenland support AGW?
    0 0
  26. It's also worth quoting Dr. Box on the causes of Greenland warming (emphasis mine):
    "The recent (post-1994) warming, is attributable to: 1) a growing absence of sulfate cooling because there has not been a major volcanic eruption since 1991; 2) recent warming phase of AMO; 3) an apparent reversal of the global dimming trend; and 4) ongoing and intensifying anthropogenic global warming (AWG), the elephant in the room, owing to a dominance of enhanced greenhouse effect despite other anthropogenic cooling factors such as aerosols and contrails (IPCC, 2007). The primary factor responsible for the warming trend is very likely to be AWG (IPCC, 2007)."
    0 0
  27. Dana, the 2010 spike in Greenland temperature is most likely due to el nino, as it was with the rest of the globe. Dana, as your own graph shows, for all of pre-21st century climate Greenland was warmer from 1920 to 1940. Now anthropogenic greenhouse gases supposedly started having a major effect at around 1975. Therefore, the theory means that post 1975, Greenland should have been experiencing anthropogenic global warming. Yet, as your own graph shows, that for the 30 years of warming (1970 to 2000) that was meant to be caused by humans, Greenland had not exceeded it's previous period of warming. Once again, as your own graph shows, the 1920 to 1940 warming occurred at a much faster rate than the 1980 to 2000 warming.
    0 0
  28. Dana personal opinions have know meaning in science. Jason Box's personal beliefs do not effect the actual data presented in his papers; that Greenland was warmer 60 years ago.
    0 0
    Moderator Response: Dr. Box was quoting the IPCC and is thus not expressing a personal opinion.
  29. Dana all I am asking is that you simply present proper empirical evidence that humans are the cause of the Greenland warming and glacial melt described in this article. I'm not being unreasonable. The hypothesis of AGW means that post 1980 Greenland warming was caused by humans. I have not seen any empirical evidence for this claim. All I am asking is that you provide it.
    0 0
    Moderator Response: Discussion of the anthropogenic attribution of the warming observed in Greenland is off-topic for this post. Please follow the directions given in the next comment by Daniel. Thanks!
  30. @ Adam Again, the thrust of this thread is about the various responses of the different types of Greenland ice sheet outlet glaciers to the documented warming of the globe (of which Greenland is but part). As both Dana and I have amply shown, current levels of warming in Greenland exceed those measured in the early part of the previous century. I can appreciate your not wanting to accept that, but that's the reality of the data. The gist of your position is: 1. It was warmer than now previous 2. It's not CO2 causing the warming that is not happened (the logical fallacy that Dana spoke of) #1 has already been demonstrated to be false. For #2, you have multiple issues. Search for "It's Not Us" or one of the many myriad other skeptic favorite toys listed under the Taxonomy listing of skeptic arguments to further your knowledge. Unless you wish to discuss something actually pertaining to the topic of this particular thread, your positions are best discussed where directed previously (and as such are off-topic here). The Yooper
    0 0
  31. Adam, there is a difference between rate and absolute temperature. Box's data clearly shows Greenland is currently warmer than in 1930. It's true that the rate of warming 1916-1932 was a bit faster than the rate 1994-2010, but so what? There are no opinions presented here. Box clearly referenced the IPCC AR4 in his anthropogenic attribution statement. If you want evidence, go read the IPCC report.
    0 0
  32. Adam: You're new to Skeptical Science and how normal business is conducted here can be a bit confusing for the newcomer. That's why we recommend that Newcomers, Start Here and then learn The Big Picture. I also recommend watching this video on why CO2 is the biggest climate control knob in Earth's history. Further general questions can usually be be answered by first using the Search function in the upper left of every Skeptical Science page to see if there is already a post on it (odds are, there is). If you still have questions, use the Search function located in the upper left of every page here at Skeptical Science and post your question on the most pertinent thread. Remember to frame your questions in compliance with the Comments Policy and lastly, to use the Preview function below the comment box to ensure that any html tags you're using work properly. The Yooper
    0 0
  33. Adam... I'm very curious how you can cite Dr Box in one post and then turn around and dismiss his conclusions in another post just 12 minutes later.
    0 0
  34. "As both Dana and I have amply shown, current levels of warming in Greenland exceed those measured in the early part of the previous century. I can appreciate your not wanting to accept that, but that's the reality of the data." Daniel, I accept that 2010 was unusually warm for Greenland's climate (which was the big temp spike in Dana's graph), but as Dana's graph also showed, for all of pre-21st century climate, Greenland remained warmer 60 years. Now as shown by the papers I provided you (one of which was authored by two AGW scientists) Throughout the 20th century (1900-2000) Greenland was warmer in the 1930's. You have not answered what I have brought up. If all of post 1970 warming was due to humans, then it would have meant that the warming that occurred on Greenland during that period would have also been caused by humans. Yet, as shown by all of the papers I provided you and by Dana's own graph, for those 30 years Greenland temperature remained below what it was 60 years ago. This clearly contradicts AGW. "It's true that the rate of warming 1916-1932 was a bit faster than the rate 1994-2010, but so what?" Dana, for the past 70 years, as often pointed out by AGW believers, CO2 levels have skyrocketed. If anthropogenic CO2 was the cause of 1994-2010 warming, then according to the theory, that period should have warmed faster, but it didn't. Daniel, I am aware of all the policies at skeptical science. This may be my first time commenting, but I have been aware of this website for months. You do not need to tell me things I already know. Rob Honeycutt, Jason Box's opinion did not reflect on the data presented in his papers. Whether he believes what is in the IPCC's report is his choice, and has got nothing to do with what he presented in his papers.
    0 0
  35. Adam... Surely you jest. You are claiming that his published research is showing something completely different that what is expressed by his opinion? That's quite an alarming claim.
    0 0
  36. Adam#34: "for the past 70 years, as often pointed out by AGW believers, CO2 levels have skyrocketed." If by 'skyrocketed,' you mean an increase of between 1 and 2.5 ppm per year. "If anthropogenic CO2 was the cause of 1994-2010 warming, then according to the theory, that period should have warmed faster," Apparently you are unfamiliar with the way that radiative forcing works. 'It should have warmed faster' ... than what? There are ample threads here, all with pointers to the relevant literature, explaining this process in detail. Look at the rate of temperature increase in the northern latitudes since 1970 or so, they are increasing pretty quickly: 0.3C per decade in Europe, 0.5C per decade in parts of Canada, close to 0.6C per decade farther north. There are ample threads here for that information as well.
    0 0
  37. Adam said... "for the past 70 years, as often pointed out by AGW believers, CO2 levels have skyrocketed. If anthropogenic CO2 was the cause of 1994-2010 warming, then according to the theory, that period should have warmed faster, but it didn't." Really? Is that what we say? I would modify that to say "if there were no other forcings on the climate system..." then yes, you'd be right. But no one claims that CO2 is the only mechanism that affect climate. We only say that CO2 is the biggest control knob.
    0 0
  38. I think I'm arguing with a brick wall here. Adam, I'm looking at my calendar right now, and it tells me the year is 2011. So I'm having a hard time understanding why you're unwilling to consider Greenland temperatures after 2000. There's a word for that, we don't like to use it here, but it starts with the letter "d" and sounds like a river in Egypt. As for this claim:
    "If anthropogenic CO2 was the cause of 1994-2010 warming, then according to the theory, that period should have warmed faster, but it didn't."
    As Daniel and I have explained several times, this is a logical fallacy, and a false statement. As Rob notes in #37, none of us have ever claimed that CO2 is the only factor impacting global temperatures, and certainly not local temperatures. I suggest you take some time to learn and understand the AGW theory before claiming you've disproven it.
    0 0
  39. "If all of post 1970 warming was due to humans, then it would have meant that the warming that occurred on Greenland during that period would have also been caused by humans. Yet, as shown by all of the papers I provided you and by Dana's own graph, for those 30 years Greenland temperature remained below what it was 60 years ago. This clearly contradicts AGW." CO2 is not the only driver of climate Not that simple.
    0 0
  40. Adam's data of course ends in 2000. I did note in a paper I published that Jakobshavn was in approximate equilibrium with climate in the 1980's. It is the last decades warmth that has driven the amazing response of the glaciers that is the focus of this post. So the key climate data is that of the last decade.
    0 0
  41. Muoncounter, "than what? There are ample threads here, all with pointers to the relevant literature, explaining this process in detail." It should have warmed faster than the previous period of warming. Look, the fact that the 1920-1940 warming occurred at a faster rate, shows that other forces can also significantly effect Greenland's climate. It was obviously not CO2 that caused the previous period of warming. Yet it is supposedly co2, which is causing the current warming. Like I said, polar regions are especially sensitive. The increase in temperature should have occurred faster, if CO2 was the dominant driver of our climate. Could you please point out that papers you are referring to, which explains why Greenland warmed faster 60 years ago? Rob Honeycutt, "Really? Is that what we say? I would modify that to say "if there were no other forcings on the climate system..." then yes, you'd be right. But no one claims that CO2 is the only mechanism that affect climate. We only say that CO2 is the biggest control knob. " If so, could you please tell me what forcing caused the previous Greenland warming of 1920-1940? And could you also please explain why you don't think it could be that, which is causing the current Greenland warming? Dana, "Adam, I'm looking at my calendar right now, and it tells me the year is 2011. So I'm having a hard time understanding why you're unwilling to consider Greenland temperatures after 2000." You just don't get what I am trying to say. Yes I do accept that the years 2003 and 2010 were especially warm for Greenland's climate, hence causing the total temps to slightly exceed the 1930's, but it was for those two years only. Once again Dana, did you actually read the papers I provided? Now anthropogenic greenhouse gases supposedly started warming the global climate at around 1970 (right?) And Greenland is part of the global climate. Therefore, according to AGW the warming that occurred on Greenland must have been man made. (unless you accept that it could have been natural) Therefore, it means that for the 30 years, greenhouse gases were supposedly warming our climate, Greenland temperatures did not exceed what they were 60 years ago. Polar regions are especially sensitive, so therefore this data would contradict AGW. I really do suggest you read those papers. "There's a word for that, we don't like to use it here, but it starts with the letter "d" and sounds like a river in Egypt." Dana I've not insulted you, so I can't see why you are trying to insult me. Dana and scaddenp, I will repeat my challenge to Rob, to both of you. mspelto "So the key climate data is that of the last decade. " No it's not. You have to look back at the decadal trends of the past century. What you need to do is look at previous periods of warming, and see whether the current one is similar to them, which as shown by the papers I provided and Dana's own graph, it is.
    0 0
    Moderator Response: [DB] Off-topic portions struck out. For someone who claims to know how SkS works, insistence upon staying off-topic testifies to the opposite.
  42. If we are worried about the Greenland Ice Sheet and Arctic Sea Ice the spectacular and significant changes in both have all occurred in the last decade, that is why the last decade is the key. It is the outlier and that is why the last decade has seen these historic responses in both sea ice cover and ice sheet behavior. If this decade was similar to others those large cryospheric indicators would have responded in kind.
    0 0
  43. mspelto, short term trends are not statistically significant, and therefore cannot be used to come to a conclusion on different issues. Once again, I agree that the years 2003 and 2010 were unusually warm in Greenland, but you have to look at the long term and decadal trends, you can't just focus on little bits. Look, all of the dramatic glacial melting you describe in your article may seem unusual, but as shown by the papers I provided, and Dana's own graph, the warming is not anomalous when compared to previous periods of warming. If you take out the 2003 and 2010 spikes of Dana's graph you will see that there is nothing unusual with Greenland's current temperature. mspelto, Greenland has heat waves about every 60 years, and in between those, there are cooling trends, which is what the data shows. mspelto the last decade is not the 'key'. You need to look back and compare it. You need to look at all the facts about Greenland's past climate, and use it to find about how unique Greenland's current climate is. And as the data shows, the current Greenland temperature is not unprecedented in it's history.
    0 0
  44. Daniel Bailey, I do not believe that my comments were off topic. I'm sure you'll agree that the actual cause of glacial melt, is pretty important for the whole theory of AGW. Now do you believe that post 1980 Greenland warming, and all the glacial melt described in your article is due to anthropogenic greenhouse gases? ( -Snip- )
    0 0
    Moderator Response: [DB] Off-topic discussions of causation snipped. My opinions of causation of the observed warming are not on-topic for this thread. You are trolling.
  45. Adam, Do you realize that mspelto has devoted hs life to studing glaciers and has spent a considerable amount of time measuring ice melt in Greenland? Please do not treat this expert so badly, we are lucky to have him here to tell us what informed people think about the Greenland ice. Dismissing an expert with a handwave on the experts turf does not make a convincing argument. Try to find some better data.
    0 0
  46. "Dismissing an expert with a handwave on the experts turf does not make a convincing argument. Try to find some better data. " Michael Sweet, I have provided peer reviewed studies to support my argument, all of which were published within the last five years. I am sure that would indeed mean that they were reliable data sources. I am not 'dismissing an expert'. I do not know anything about mspelto or his work, but I am sure that he is probably a respectable scientist. I have not treated him badly. All I have done is state my opinion on the matter, and provided evidence for it. I have just tried to have simple debate, and explained why I have disagreed with him on some points. Could you please explain how I have treated him badly?
    0 0
    Moderator Response: [DB] You reveal your ignorance by dismissing Mauri's comments & insights. Mauri is a published, working glaciologist. Even the most abbreviated Googling of his name would have shown you that, had you bothered to acquaint yourself properly about glaciology and Greenland. You lack the background to make the sweeping statements you have been making on this thread. That, sir, is the embodiment of the Dunning-Kruger effect.
  47. Adam, This statement is just plain wrong: "The simple facts about Greenland's temperature variaitons, simply contradict AGW" And so is this one, "mspelto, there is no anthropogenic signal in Greenland's climate. " Surely you reallize the folly of suing a point location to disprove a theory which dictates that the planet's mean temperature will increase as GHG concentrations increase? Also, as shown to you @26, Dr. Box, the person who generated the graph that you showed, does not agree with your assessment. Anyways, I thought this thread was about the rich variety of glaciers? Any thoughts on that and the fact that glacier mass around the world is in decline? And please don't trot out something from Monckton et al., or some select examples of glaciers that are not losing mass. The point is that global glacier and ice sheet ice volume is decreasing as the planet warms. And please don't try and tell us that the Antarctic ice sheet is gaining ice, it is not. Folks here are infinitely better informed than those at disinformer blogs like WUWT. Why, because we actually follow the science without distorting and cheery-picking and misrepresenting it :)
    0 0
  48. Adam, " All I have done is state my opinion on the matter, and provided evidence for it." Actually no. Also, you are entitled to your own opinion, but not your own facts. I am willing to entertain the notion that the recent acceleration in loss of ice from Greenland is partly attributable to regional affects and natural variability. The inconvenient fact for those in denial about AGW remains though that Box and others have considered natural variability, and it alone does not explain recent events in the region, or the planet as a whole. For example, Polyak et al. (2010) conclude that the dramatic loss of Arctic sea ice in unprecedented in the past 200 years and cannot be explained by known natural variability. You are ignoring the elephant in the room Adam. And to be frank, you also appear to be trolling....
    0 0
  49. Albatross, "This statement is just plain wrong: "The simple facts about Greenland's temperature variaitons, simply contradict AGW" And so is this one, "mspelto, there is no anthropogenic signal in Greenland's climate. " Could you please explain how those statements are wrong. "Surely you reallize the folly of suing a point location to disprove a theory which dictates that the planet's mean temperature will increase as GHG concentrations increase? " Albatross, polar regions are especially sensitive, much more than the rest of the world. I think you'll agree that patterns in the Arctic and Greenland are very important for the whole theory of anthropogenic global warming. ( -Snip- ) "Any thoughts on that and the fact that glacier mass around the world is in decline? And please don't trot out something from Monckton et al., or some select examples of glaciers that are not losing mass. The point is that global glacier and ice sheet ice volume is decreasing as the planet warms. " ( -Snip- ) "Folks here are infinitely better informed than those at disinformer blogs like WUWT. Why, because we actually follow the science without distorting and cheery-picking and misrepresenting it :) " Albatross, I have not insulted you or anyone else on this blog, so I can't see why you are insulting me.
    0 0
    Moderator Response: [DB] Digressions into warming causation snipped.
  50. People, including me, have explained to you why those statements are wrong...and you simply ignore them or dismiss them.
    0 0

1  2  Next

You need to be logged in to post a comment. Login via the left margin or if you're new, register here.


The Consensus Project Website

THE ESCALATOR

(free to republish)


© Copyright 2024 John Cook
Home | Translations | About Us | Privacy | Contact Us