Climate Science Glossary

Term Lookup

Enter a term in the search box to find its definition.

Settings

Use the controls in the far right panel to increase or decrease the number of terms automatically displayed (or to completely turn that feature off).

Term Lookup

Settings


All IPCC definitions taken from Climate Change 2007: The Physical Science Basis. Working Group I Contribution to the Fourth Assessment Report of the Intergovernmental Panel on Climate Change, Annex I, Glossary, pp. 941-954. Cambridge University Press.

Home Arguments Software Resources Comments The Consensus Project Translations About Support

Bluesky Facebook LinkedIn Mastodon MeWe

Twitter YouTube RSS Posts RSS Comments Email Subscribe


Climate's changed before
It's the sun
It's not bad
There is no consensus
It's cooling
Models are unreliable
Temp record is unreliable
Animals and plants can adapt
It hasn't warmed since 1998
Antarctica is gaining ice
View All Arguments...


Username
Password
New? Register here
Forgot your password?

Latest Posts

Archives

What ended the Little Ice Age?

Posted on 4 January 2010 by John Cook

The Little Ice Age was a cooler period spanning the 16th to the 19th century. The river Thames often froze over. The Norse colonies in Greenland were unable to survive the harsh winters. After 1850, temperatures began to rise. But man-made CO2 emissions in the late 19th century were a fraction of current levels. Did human activity take us out of the Little Ice Age? Were there other factors? And what does it mean for current warming? This question is addressed in Meehl 2004 which examines the various factors that drove climate since the 19th Century.

Climate simulations were run using two natural factors that drive climate - volcanoes and the sun. Volcanic eruptions cool global temperature for a few years after eruption. A drop in volcanic activity after 1915 contributed slight warming in the early 20th Century. However, the greater contributor to warming from 1880 came from the sun which steadily warmed up to the 1940s. When the two factors are combined, they account well for the warming from 1880 to 1940. However, the contribution from sun and volcanoes to global temperature since the 1940s has been a slight cooling effect.
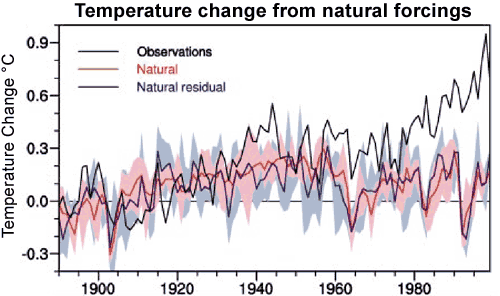

Figure 1: Climate model results from natural forcings compared to observations (black line). The red line is the average of the four-member ensemble. The pink shading is the model range. The blue line is the ensemble mean and the light blue shading is the ensemble range.

To calculate the human influence on climate, three forcings were considered: ozone, sulfate aerosols and man-made greenhouse gases. Sulfate aerosols have a cooling effect, growing stronger after around 1950. Changes in ozone produced a slight warming response. The strongest effect is from greenhouse gases which produced slow warming in the early 20th Century, then accelerated in the 1970s. When all anthropogenic forcings are combined, they show little temperature response from 1880 to to the 1960s. They do a poor job of explaining the warming from 1880 but a very good job of capturing late 20th Century warming.
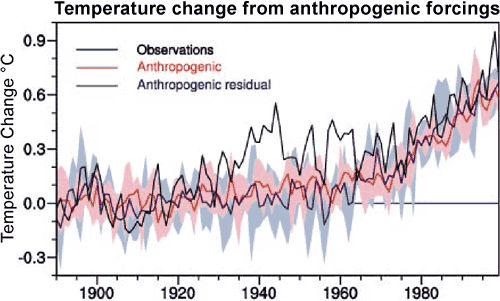

Figure 2: Climate model results from anthropogenic forcings compared to observations (black line).

When natural and anthropogenic forcings are combined, they show close correspondance with global temperature. From this analysis, Meehl concludes that the warming from 1880 to the mid-20th Century was largely natural with the sun being the main contributor. Late 20th Century warming after 1970 is mainly due to man-made influence primarily from greenhouse gases.
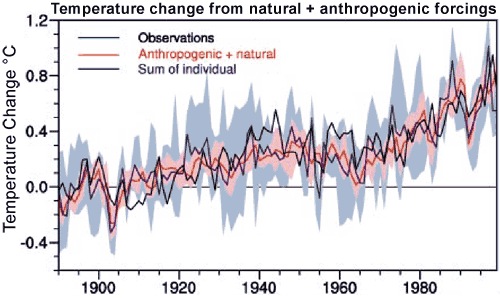

Figure 3: Climate model results from natural + anthropogenic forcings compared to observations (black line).

This analysis is a useful reminder that CO2 is not the only driver of climate. To end the Little Ice Age, the sun did most of the early heavy lifting. When the solar contribution flattened out in the mid-20th century, humanity took the baton and we've been running with it ever since. Meehl 2004 is also confirmation that past climate change tells us how sensitive climate is to radiative forcing. The climate that responded to the forcing from the warming sun in the early 20th century is the same climate that is now responding to the forcing from rising greenhouse gases.

0 0

Printable Version  |  Link to this page

Comments

Comments 1 to 22:

  1. Here something is missing: the 1910s-1940s warming is evident only in the Northern Hemisphere and there the pattern is strongest over the Artic. If the forcing is global, like Volcano+Solar, the pattern should be evident in both Hemispheres. This is not the case, so something else might have done it. I guess that the forcing in question is Antropogenic Aerosols. Important to note that the Meehl 2004 paper ignores Black Carbon forcing. This is an important flaw, as BC is now recognized as the second strongest warming forcing, only superated by CO2.
    0 0
  2. re From Peru: if there's one thing I've learned in my reading on climate, it's that responses to changes in forcing are very non-uniform across the globe. Ocean currents, in particular, can result in some counter-intuitive results (like some areas actually cooling when everywhere else heats up). Your comment re Black Carbon, though, is interesting (as it's toward the end of the LIA when fossil fuel burning really took off, so it could be a factor). I'm not sure if John has already addressed this anywhere, but I did note that the graphs above start at 1890, though warming began around 1850. It does still help to reinforce the notion of sensitivity to forcing, though.
    0 0
  3. As you are probably already aware, Prof. Svalgaard disputes that the sun actually has "warmed" up in the last few hundred years. http://www.leif.org/research/Seminar-SPRG-2008.pdf Not sure what this means to the early warming from the LIA, but something?
    0 0
  4. DeNihilist, if a small sun variation can induced detectable increases in temperature it can only mean that climate sensitivity is much larger than expected or that some fast feedback specifically related to the sun forcing must be acting. This would be good news for the "it's cosmic rays" belivers. Unfortunately (for them) we know it can not be it. Problems also arise when considering the big picture of the climate of the past, it would be hard to explain the temperature difference between glacial and interglacial with such a huge sensitivity (plus the slow fedbacks in action).
    0 0
  5. This is a good article. Firstly, it's hard to get much about the contributions from the sun out of most people advocating AGW. The period from 1880s to 1940s shows the sun has an important effect. From about the 1940s-1960s, those advocating the continuance of relatively strong warming effects from the sun have to resort to scrambling for 'unknowns' such as cosmic rays, long heat lag effects, and who knows what else (magnetic fields, UV etc etc), but they are still a possibility. One has to remember that the sun is not just a simple and unchanging ball of fire; it is still quite possible that solar effects, as yet not understood, contribute strongly to warming since the mid 20th century, although admittedly, there isnt any known mechanisms to account for this-at least not yet. Without these 'unknown' solar possibilities, including long heat lag effects, the skeptics arguments for warming since the 1950s are relatively weak. PS. Also, I think the papers advocating increased build up of heat in the oceans and various disequilibrium effects etc, are flawed because they generally rely on modelled forcings relating to greenhouse gases; like the hockeystick, these papers, the data and their conclusions are somewhat manipulated and unreliable. I dont trust them very much. A good example is Hansen 2005 (elsewhere on this site), where his 'warming in the pipeline' calculations are based on modelled effects and assumptions from greenhouse gases. Good article above though.
    0 0
  6. Why don't the graphs on this site go back to 1000 AD? It appears the warming shown is something new without a little more historical context.
    0 0
    Response: More context is always a good thing. For discussion of temperatures going back 1000 years, see the hockey stick page. For temperatures going back 450,000 years, see "CO2 lags temperature". For temperatures going back 540 million years, see "CO2 was higher in the past".
  7. I went to the "hockey stick page" but the graphs don't show the MWP. They only go back to 1500 except one which is only Northern Hemisphere. I think the MWP is instructive in this debate.
    0 0
  8. "Meehl 2004 is also confirmation that past climate change tells us how sensitive climate is to radiative forcing." I acknowledge this as an possible interpretation of data. However, using words like “sensitive” is misleading when there is still no clear picture about what the bandwidth of the natural variation actually is. What “sensitive” suggest is that there exists a certain (known) signal with a certain (known) bandwidth and that due to “radiative forcing” the center and/or shape of the bandwidth has changed. Is such interpretation supported by the analysis in the report? If not, another interpretation could be that the signal is very noisy and the bandwidth is great which can be put in other words as climate is able to vary fast over time.
    0 0
  9. To batsvensson: Reading your comment, I can only assume you have a background in electrical engineering. The problem with this is that you have a high level of math skills, mathematical intuition, systems analysis and computer modeling abilities and wish to actually approach the eco-system as a sincere scientist. I applaud your question. Unfortunately, we are talking about many non linear and dependent relationships that probably are not being accurately modeled. I dont think anyone is to blame, nor in a position to answer your question. It almost seems like there is a limit to what we humans can know, predict, and control. I am sorry for sounding so pessimistic, yet on the lighter side, I think we should also be grateful for the margin of error that Divine Providence at least so far has allowed mankind. My guess is that since 2/3 of the planet is water, there is a self imposed restriction as to how much damage we can actually do to ourselves.
    0 0
  10. batsvensson: the natural variation is very large - look at the range of daily temperatures, and look at the variation from day to day, week to week, season to season. The sensitivity being discussed here is about the climate, which is pretty much defined as long-term average conditions. If you're considering an analogy of a signal varying about a centre (as I understand your comment), then, yes, the radiative forcing is affecting the position of that centre, and the sensitivity is the amount of change of that centre when subject to a given radiative forcing. The variability about that centre may stay the same, or it may shrink, or increase, quite separately from the shift in the centre. As I understand it, that's where climatology varies from meteorology - climatology concentrates on the centre, while meteorology looks at the day-to-day variation about the centre. They are quite different aspects of temperature. Weather forecasts are rarely given beyond a few days to a week, and the accuracy falls off dramatically the further out you go - primarily because weather seems to be a chaotic system with almost unpredictable behaviour. But when you look at longer term averages, that unpredictable variation is smoothed out, and we're dealing with much more predictable systems - heat comes in, heat goes out, the difference says what the long-term temperature average will be. The hard part that seems to be occupying climatologists' time now is figuring out exactly *where* heat goes - the satellite measurements seem to clearly indicate that heat is being retained by the earth - and what effects that will have, in terms of sea levels & potential weather patterns (which will both determine whether that beach-front property was a good long-term investment or not).
    0 0
  11. We must never forget that 'sensitivity' is _not_ well-defined as the net result of a complex of mechanistic processes. It is just the expectation value of something that may be considered a stochastic process. We will eventually get to know what the realized value in our current experiment will be, but we may not know exactly how close a second, more or less identical, experiment would come in. As most estimates of pdfs for the sensitivity seem to have rather fat upper tails, we might expect the observed results to differ quite a bit from case to case - but we will never be able to repeat the current experiment even approximately. This is not a weakness of AGW theory, it is a strength. And one consequence, is that if somebody should come up with an analysis showing another decomposition in natural and anthropogenic components than Meehl's estimate presented here, it would actually -in principle- strengthen the case for AGW. The more models consistent with physics and with the observations, the more robust the paradigm. Surely, the denialosphere will be thick with statements about "debunking" whenever an alternative reconstruction is introduces (just see what happened to Knorr's paper). But that will be like someone triumphantly saying: "Got you! Yesterday, you tried to tell me that nine is six plus three. But now, I can prove you wrong. Here I have obtained conclusive evidence that NINE IS FOUR PLUS FIVE."
    0 0
  12. RSVP and SNRatio, My comment is not considered about how well models are at making a curve fit with actual measurement or why the measured curve has the shape it has. What I am asking about is how well our understanding is of the behavior of the actual measured signal. There is no rocket science involved in this really and no reference need to be done to reality for this, but just a couple of standard test. Bern , Why do you think it is meaningful to compare variations in global mean with variations in temperatures for local weather?
    0 0
  13. batsvensson, what you call bandwidth (i'd call it variability) is not known a priori but can be extracted from the measurements. The signal, again, is not know a priori but can be extracted from the measurements. In practice, take the temperature data, smooth with the algorithm of your choice, take the residuals. The standard deviation of the residual is the bandwidth, the smoothed line is the signal.
    0 0
  14. Re 3 and 4 - I had tried to read Svalgaard too or at least his comments on his work on another blog. If he is right (little solar variation in the last 165 years)and Riccardo is right that climate cannot be so very highly sensitive it leaves me still scratching my head as to what ended the LIA. I note John has said on on a different thread that he was working on a post on ice age/inter-glacial mechanisms.
    0 0
  15. My feeling is that the LIA and its ending are more straightforward. Some points: 1. Meehl et al don’t really address the end of the LIA. They address attributions to global warming since the mid-19th century, and the evidence indicates that the LIA had pretty much ended by then (see 5). 2. In relation to Meehl et al., since their paper was submitted, there’s been a pretty substantial re-evaluation of the solar contribution to temperature variation of the last several hundred years. The scientists that study solar outputs and its proxies (Lean, Foukal, Solanki), indicate that the contribution of enhanced solar output since the Maunder Minimum (MM; bottom of the LIA) to the mid-20th century is around 1-1.4 W/m2, equivalent to a warming at equilibrium of up to 0.2 oC [*]. This is a bit more than the Svalgaard estimated that DeNihilist refers to in post #3 above, but I find it hard to believe that a pretty well established surface warming/cooling contribution of ~ 0.1 oC through the solar cycle, doesn’t indicate that the complete absence of sunspot activity through a few cycles at the time of the MM wouldn’t have been associated with a cooling effect of at least 0.1 oC. 3. Referring to Meehl et al again, a more recent attribution study of natural and anthropogenic contributions to global temperature since the mid 19th century, indicates that all natural contributions (solar included) have produced essentially zero nett contribution since the mid-19th century. This study (Ammann et al. (2007) [**], is very similar to Meehl et al in its methodologies, but uses the more up to date solar parameterizations. 4. If one examines CO2 levels through this period [***], the atmospheric CO2 levels rose from around 276 ppm at the bottom of the LIA to 300 ppm by 1900 to 310 ppm by 1940. It’s likely that the small reduction of CO2 from the pre-LIA values near 280 ppm to 276 ppm was the atmospheric response to reduced temperatures (as discussed on the “Why does CO2 lag temperature” current thread). But the 280-310 ppm rise is anthropogenic and should give a global equilibrium temperature rise of 0.3 oC by 1900 and 0.45 at 1940 values (assuming the medium value of the climate sensitivity of around 3 oC of surface warming per doubling of atmospheric [CO2]. Since this occurred over a long time, we’d expect quite a lot of this to have been “realized” by the mid 20th century (say 0.35 oC). 5. So what ended the LIA? If you look at the most variable temperature reconstruction (Moberg et al, 2005 [****]; a N. hemisphere one, remember), the temperature anomaly was around -0.4 oC (relative to mid 20th century values) for several hundred years before the Medieval Warm Period (MWP), rose to around 0.0 oC at the height of the MWP, and then dropped to near -0.7 oC between around 1100 AD and 1600 AD at the bottom of the LIA. So recovery from the LIA really constitutes recovery from an anomaly of -0.7 oC back to the pre-industrial -0.4 oC (it helps to look at Moberg’s reconstruction!). This was largely a recovery of the solar irradiance (say 0.2 oC, and from the enhanced volcanic activity that likely made a small contribution to LIA cooling – say 0.1 oC). 6. So there are really two questions: What caused the recovery from the LIA? …. and What has caused the marked warming during the last 150 years. Considering the total (NH) temperature rise from the bottom of the LIA to the mid 20th century (~ 0.7 oC, and to now (~ 1.2 oC), I’d say the evidence is consistent with around 0.3-0.4 oC of natural “recovery” which was largely realised by the mid 19th century, and ~0.3-0.4 oC of anthropogenic contribution up to the mid 20th century, and more like 0.7-0.9 oC anthropogenic contribution to the present, with some of the natural and anthropogenic contribution “offset” by anthropogenic aerosols. [*] Y.-M. Wang, J. L. Lean and N. R. Sheeley, Jr. (2005) Modeling the Sun's Magnetic Field and Irradiance since 1713 Astrophysical J. 625 522-538 P. Foukal, G. North, Tom Wigley (2004) A Stellar View on Solar Variations and Climate Science 306, 68-69 Lean, J. L., and D. H. Rind (2008), How natural and anthropogenic influences alter global and regional surface temperatures: 1889 to 2006 Geophys. Res. Lett., 35, L18701 http://www.atmosp.physics.utoronto.ca/~jclub/journalclub_files/LeanGRL2008.pdf [**] C. M. Ammann et al. (2007) Solar influence on climate during the past millennium: Results from transient simulations with the NCAR Climate System Model Proc. Natl. Acad. Sci. USA 104, 3713-3718 http://www.pnas.org/content/104/10/3713.abstract (open access – so should be downloadable from this link) [***][ D. M. Etheridge et al (1996) "Natural and anthropogenic changes in atmospheric CO2 over the last 1000 years from air in Antarctic ice and firn J. Geophys Res. 101, 4115 -4128 [****] A. Moberg et al. (2005) Highly variable Northern Hemisphere temperatures reconstructed from low- and high-resolution proxy data Nature 433, 613-617 coast.gkss.de/staff/storch/pdf/moberg.nature.0502.pdf
    0 0
  16. Thank you for an excellent post Chris. John your site is a wonderful model of how knowledgeable lay people and scientists should interact with ordinary inquisitive folk such as myself whose initial approach to the subject is skeptical.
    0 0
  17. Riccardo, thank you for taking time to make the answer in comment #13, however I am well aware of the techniques on how to calculate a bandwidth or variability or whatever label is preferred to use for this. What I am asking about is our knowledge of the variability in the past. Because the "conclusion" that "Meehl 2004 is also confirmation that past climate change tells us how sensitive climate is to radiative forcing." which is not a conclusion at all is a nonsense statement unless we can put into a perspective of past variability or "sensitiveness" (which is yet another label for the same thing).
    0 0
  18. Riccardo you wrote in #4: "if a small sun variation can induced detectable increases in temperature it can only mean that climate sensitivity is much larger than expected ..." I assume "sensitivity" and "variability" in above are the same, and want to ask: "larger than expected" than what? Yuo also wrote: "it would be hard to explain the temperature difference between glacial and interglacial with such a huge sensitivity" Why would this be hard to explain with an increased sensitivity/variability? Statement like this sound to me like "since I can not imagine how it can happen then it can not have happen." What reason do we have to believe this to be true?
    0 0
  19. batsvensson, #17 it looks to me that you are taking the data "as is" without adding the physics of the processes involved in climate variations. We are not analizing an unknown signal, we are looking for the link between forcings and temperature. This is what "put into a perspective" present and past climate. #18 "larger than expected" refers to what is now widely accepted as the best estimate. And it does not come from nowhere, it comes from the analisys of many different phenomena. Climate sensitivity is not an abstract concept, it's the physical link between forcing and temperature variation. It can not take any value, it need to be contrasted with what we know had happend. Explaining the glacial cycles requires the knowledge of forcing and feebacks which, together with the climate sensitivy, gives you the temperature variation. Given the forcings and feedbacks (crudely, Milankovich cycles and ice and CO2 feedbacks) a increased sensitivity would results in a temperature variation higher than obeserved. So the problem is not that "I can not imagine how it can happen", it is that a high sensitivity cannot explain the glacial cycles.
    0 0
  20. Riccardo, Yes I take the measurement data “as is”, because it is a quiet common practice as a method of basic scientific investigation to first collect, statistical analyze, inter compare and then synthesize data, not to do it the other way around by interpreting data in a context, which is the method know as positive confirmation, or “data fitting”. However if you think my approach of investigation is incorrect, then please explain why you think that is not recommended to do. In the same comment you also wrote, "we are looking for the link" which, if one bases evidence on negative confirmation, suggests that the null hypothesis must be false or else there exists no special reason to “look” for anything particualar at all in a data set, except to test different model to see if data can be fitted or not, and if it can be fitted this is, of course, interesting but not conclusive unless the null hypothesis is falsified. Is there any studies published that has falsified the null hypothesis? When I asked a definition of "larger than expected" I did suspect to get some kind of reference to a quantitative measure which shows it is larger than some other numerical “expected” value and not “It can not take any value” that it is the " the best estimate" of "many different phenomena" which are "physical". Such sweeping answer doesn’t make me, or anyone else for that matter that reads this, more enlightened about what you do mean with "larger than expected" except that it may be taken as you wanted to say “I don’t know, but I have heard it said to be so”. Unless I grant myself to believe in some kind of authority wisdom, which I will not, then this type of answers is complete and utterly nonsense. To address the last point, you wrote the reason to believe why this is hard to explain is that “a high sensitivity cannot explain the glacial cycles”, but this is just another way of saying “given what is known it cannot be explain in another way”, which is the same thing as saying “given what is known it can not be imagine in another way” so when you claim it “is not that "I can not imagine how it can happen"”, you are not only assuming in the premises what you are to explain but you are also contradiction your own beliefs. So again you answer is utter nonsense as to what the reason are for use to the believe this to be true.
    0 0
  21. batsvensson, since DeNihilist and I were talking about climate sensitivity and you commented, i assumed you had a knowledge of the subject. I always assume that people commenting on a topic have at the very least the basic knowledge. I was wrong, apologize; i guess there's no need to point you to wikipedia for a general introduction to climate sensitivity. Anyway, your ignorance of the subject does not allow you to presume mine, just explicitly ask for a reference. I probably made the same mistake assuming you are aware of the basic statistical analisys on the temperature time series. This would explain your (wrong) reasoning on my negative confirmation procedure, it's the opposite indeed. It's the analysis of past climate forced variability one of the strong point of AGW theory. And, for example, it's the statistical analysis of unforced variability that strongly contrast the claims of the halting of global warming. Similarly, the fact that a low climate sensitivity can not explain glacial cycles is *not* negative confirmation but analysis on data already statistically assessed. You know, physics works this way, at least if we stick to physics and not to the metaphysics of all the possible worlds.
    0 0
  22. Most of the discussion went over my head. I get stumped when schoolboys ask me: *There were ice ages earlier. *Warming took place and they went away. *There were no contributory factors as we know them - no aerosol sprays, no fossil fuel burning, no automobiles and so on. Why then is there such a to-do about Global Warming now? Shall be grateful if someone can give me a jargon-free explanation which I can communicate to them.
    0 0

You need to be logged in to post a comment. Login via the left margin or if you're new, register here.


The Consensus Project Website

THE ESCALATOR

(free to republish)


© Copyright 2024 John Cook
Home | Translations | About Us | Privacy | Contact Us