Climate Science Glossary

Term Lookup

Enter a term in the search box to find its definition.

Settings

Use the controls in the far right panel to increase or decrease the number of terms automatically displayed (or to completely turn that feature off).

Term Lookup

Settings


All IPCC definitions taken from Climate Change 2007: The Physical Science Basis. Working Group I Contribution to the Fourth Assessment Report of the Intergovernmental Panel on Climate Change, Annex I, Glossary, pp. 941-954. Cambridge University Press.

Home Arguments Software Resources Comments The Consensus Project Translations About Support

Bluesky Facebook LinkedIn Mastodon MeWe

Twitter YouTube RSS Posts RSS Comments Email Subscribe


Climate's changed before
It's the sun
It's not bad
There is no consensus
It's cooling
Models are unreliable
Temp record is unreliable
Animals and plants can adapt
It hasn't warmed since 1998
Antarctica is gaining ice
View All Arguments...


Username
Password
New? Register here
Forgot your password?

Latest Posts

Archives

Why does CO2 lag temperature?

Posted on 9 January 2010 by John Cook

Over the last half million years, our climate has experienced long ice ages regularly punctuated by brief warm periods called interglacials. Atmospheric carbon dioxide closely matches the cycle, increasing by around 80 to 100 parts per million as Antarctic temperatures warm up to 10°C. However, when you look closer, CO2 actually lags temperature by around 1000 years. While this result was predicted two decades ago (Lorius 1990), it still surprises and confuses many. Does warming cause CO2 rise or the other way around? In actuality, the answer is both.
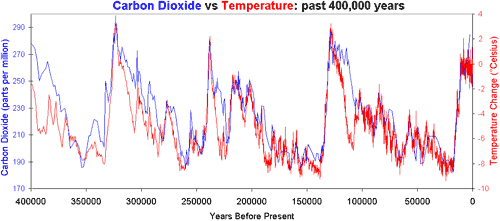
Milankovitch cycles: CO2 vs Temperature over past 400,000 years
Figure 1: Vostok ice core records for carbon dioxide concentration (Petit 2000) and temperature change (Barnola 2003).

Interglacials come along approximately every 100,000 years. This is called the Milankovitch cycle, brought on by changes in the Earth's orbit. There are three main changes to the earth's orbit. The shape of the Earth's orbit around the sun (eccentricity) varies between an ellipse to a more circular shape. The earth's axis is tilted relative to the sun at around 23°. This tilt oscillates between 22.5° and 24.5° (obliquity). As the earth spins around it's axis, the axis wobbles from pointing towards the North Star to pointing at the star Vega (precession).
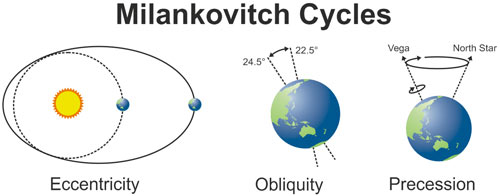
Milankovitch cycles: orbital changes in eccentricity, precession and obliquity
Figure 2: The three main orbital variations. Eccentricity: changes in the shape of the Earth’s orbit.Obliquity: changes in the tilt of the Earth’s rotational axis. Precession: wobbles in the Earth’s rotational axis.

The combined effect of these orbital cycles cause long term changes in the amount of sunlight hitting the earth at different seasons, particularly at high latitudes. For example, around 18,000 years ago, there was an increase in the amount of sunlight hitting the Southern Hemisphere during the southern spring. This lead to retreating Antarctic sea ice and melting glaciers in the Southern Hemisphere.(Shemesh 2002). The ice loss had a positive feedback effect with less ice reflecting sunlight back into space (decreased albedo). This enhanced the warming.

As the Southern Ocean warms, the solubility of CO2 in water falls (Martin 2005). This causes the oceans to give up more CO2, emitting it into the atmosphere. The exact mechanism of how the deep ocean gives up its CO2 is not fully understood but believed to be related to vertical ocean mixing (Toggweiler 1999). The process takes around 800 to 1000 years, so CO2 levels are observed to rise around 1000 years after the initial warming (Monnin 2001, Mudelsee 2001).

The outgassing of CO2 from the ocean has several effects. The increased CO2 in the atmosphere amplifies the original warming. The relatively weak forcing from Milankovitch cycles is insufficient to cause the dramatic temperature change taking our climate out of an ice age (this period is called a deglaciation). However, the amplifying effect of CO2 is consistent with the observed warming.

CO2 from the Southern Ocean also mixes through the atmosphere, spreading the warming north (Cuffey 2001). Tropical marine sediments record warming in the tropics around 1000 years after Antarctic warming, around the same time as the CO2 rise (Stott 2007). Ice cores in Greenland find that warming in the Northern Hemisphere lags the Antarctic CO2 rise (Caillon 2003).

To claim that the CO2 lag disproves the warming effect of CO2 displays a lack of understanding of the processes that drive Milankovitch cycles. A review of the peer reviewed research into past periods of deglaciation tells us several things:

  • Deglaciation is not initiated by CO2 but by orbital cycles
  • CO2 amplifies the warming which cannot be explained by orbital cycles alone
  • CO2 spreads warming throughout the planet

Many thanks to Ari Jokimäki who has been tirelessly tracking down papers on Milankovitch cycles.

0 0

Printable Version  |  Link to this page

Comments

1  2  Next

Comments 1 to 50 out of 65:

  1. Well that's certainly how I've always understood it, but it still leaves us with the question the skeptics have failed to answer-why are CO2 levels rising this time around, & why do they appear to *precede* the warming trend this time around? It can't be due to the Milankovitch Cycle, because the next one isn't due for around another 70,000 years (&, anyway, will generate cooling, not warming). It could be due to the warming from the 19th & early 20th century-except that ice core data shows that CO2 levels remained largely at around 280ppm throughout that entire period (unless you believe the "data" compiled by Beck-which shows CO2 levels of around 300ppm (+/-200ppm) throughout the 19th century). This 2nd theory is further debunked by the change in the C-13/C-12 ratio of the CO2 which has entered the atmosphere, post-1950. Either way, there is little doubt that CO2 levels started rising a good 20 years *prior* to the much more accelerated warming trend we've seen since 1979. Indeed, if you look at the post-1950 warming trend in 20-year intervals, you see a very slow warming in the first interval (barely +0.02 degrees per decade), followed by a rise to +0.15 degrees per decade for the second interval, & a rise of +0.18 degrees for the final interval-suggesting an acceleration in the warming trend which *trails* the measured rise in CO2.
    0 0
  2. The first link to "Shemesh 2002" is broken, at least for me..
    0 0
    Response: Fixed the link, thanks for pointing that out. I've linked to the AGU site which is the safest option. There was another PDF online found in google scholar but it also had loading problems.
  3. What causes me added concern is this-at the moment around 40% of all man-made emissions are being absorbed by the Oceans. Yet if increased warming causes the oceans to become net *emitters* of CO2-as it has in the past-then what impact will that have on the future global warming?
    0 0
  4. Marcus: afaik the solution of CO2 should, in principle, be governed by Henry's Law: http://en.wikipedia.org/wiki/Henry%27s_Law For the constant you get your typical Boltzmann exp(-A/T) form, and if 5C of global warming does occur then that's something like a 0.7% increase in the ratio. Meanwhile the partial pressure should be increasing linearly with atmospheric concentration, which will probably increase by at least 100% (and for 5C warming would likely need to go up by ~300%). So oceans should continue to absorb CO2, hence the fears about ocean acidification. Time for me to go look more in the literature I guess, but quick calcs suggest that airborne fraction will increase, but not by a huge amount?
    0 0
  5. Is it possible to know in detail how the Milankovitch cycle affected temperature in the past? Analogously to comparing the phases of the temperature and CO2 cycles, it should be possible to do the same involving the milankovitch cycles. This picture from wikipedia show the milankovitch-related insolation at 65 deg north superpositioned on proxy temperaures from the vostok (Antarctica) ice core: http://en.wikipedia.org/wiki/File:Vostok_420ky_4curves_insolation.jpg 65 deg north is far from Antarctica, but assuming that it is globaly relevant (lowest-albedo latitude?) I tried a comparision of the cycles based on the picture. In the picture we see four major temperature/CO2 peaks, at roughly 320k, 230k, 120k and 1k years from now. Looking on the lowest temperature dips before these peaks (the points where the respective warmings starts) I read that two oldest dips (at -340k and -245k years) actually coincides with peaks in insolation, each followed by a period where the insolation (at 65N) declines but the temperature (in the antarctic) rises. In these cases the temperature trends does not start to decline until we have reached the insolation's next local minimum. This would possibly indicate that the milankovitch cycle can only explain the onset of the warming, leaving the rest to be explained by CO2 only. However, this does only hold for two of four warming periods that we can see in the core (the others being more in phase with the milankovitch cycles), Antarctica is not near the 65N latitude, and I do not know how the milankovitch-related insolation varies globally (apart from 65N). Are there better models on how the fluctuations in insolation due to the milankovitch cycles affects the southern hemisphere, and antarctica in particular, more specifically? In that case such models would be a better starting point.
    0 0
  6. Andreas, the answers to your good questions haven’t been worked out yet, but recent research provides some very plausible (in my opinion!) scenarios. One of the most powerful hypotheses for providing insight into climate variation on centennial, millennial, and the longer timescales relevant to Milankovitch cycles is the variations in the Atlantic Meridonial Overturning Circulation (AMOC), the most well know aspect of which being the Gulf Stream, that transports heat from the equator to the high Northern latitudes. There is evidence that changes in the intensity of the AMOC made contributions to the Little Ice Age and the Medieval Warm period, both episodes (especially the MWP) having indications of a “focus” in the high N. latitudes. It’s easy to see that if the AMOC is strengthened (weakened), heat transfer to the high N latitudes in enhanced (reduced). The evidence indicates that variations in the AMOC may have been very dramatic in the past, and recent studies support a role for this in ice age terminations and the anomalous differences in the N and S hemisphere responses to Milankovitch insolation variations that you refer to in your post. The idea is as follows: 1. The AMOC [*] can (in principle) be completely “switched off” by large scale melt of Arctic ice, which dilutes the cooling dense high salinity portion of the current as it sinks in the high Atlantic regions between ~ Greenland-Iceland - after having left some of its heat to the grateful occupants of the Western European fringes! [*]http://en.wikipedia.org/wiki/Thermohaline_circulation Weakening, or cessation of the AMOC results in cooling of the high Northern latitudes, but warming of the S. hemisphere, since less heat is transferred northwards – it remains in the S hemisphere and low latitudes. This is a likely explanation for a large amount of data that supports a northern, southern hemisphere bipolar “see-saw”, where evidence from ice cores, for example, shows an asynchronicity in temperature variations between Greenland and Antarctica. Likewise, temperature reconstructions from ice cores, shows (in Greenland cores) some extremely abrupt large scale temperature rises and falls (due likely to switching on and off of the AMOC), which are barely visible or highly damped in Antarctic cores. 2. The “see-saw” is apparent in glacial terminations, and a detailed examination was recently published in Nature [**] (a good commentary accompanies the article [***]). The progression of events is proposed to be: a. The gradual Milankovitch-induced change in summer insolation at 65 oN resulted in retreat of the N. ice sheets, lowered albedo and enhanced high NH warming, which is observed in Greenland (but not really in Antarctic) cores between around 21000-19000 years ago. b.The meltwater from this ice sheet retreat is proposed to have switched off the AMOC (as in 1. above) about 18000 years ago, switching the bipolar “see-saw” to its “warm-south” mode, resulting in significant Antarctic and Southern ocean warming (observed in Antarctic cores). c. The warming of the Southern oceans resulted in a lagged release of CO2, which produced slow warming on a global scale, which promoted N. hemisphere ice retreat, the melt-water from which kept the AMOC in its “warm-south” mode, increasing CO2 further, and driving the termination towards completion. d. It’s thought that the AMOC switched on again around 14700 years ago where there is an abrupt rise in temperatures in the Greenland cores, and a slower cooling in the Antarctic cores, and the termination was effectively brought to completion by as combination of high insolation, high CO2, reduced albedo and the resumption of massive heat transfer to the high N. latitudes by the resumption of the AMOC. That scenario (there are other possible explanations [****]) provides an explanation of how Milankovitch insolation changes manifest largely in the high Northern latitudes can result in glacial terminations that seem to be led by events in the Southern hemisphere. [**] Barker S et al. (2009) Interhemispheric Atlantic seesaw response during the last deglaciation Nature 457, 1097-0111 http://www.nature.com/nature/journal/v457/n7233/abs/nature07770.html [***] Severinghaus, JP (2009) Southern hemisphere see-saw Nature 457, 1092-1094 [****] Stott et al. (2007) Southern hemisphere and deep-sea warming led deglacial atmospheric CO2 rise and tropical warming Science 318, 435-438 linked in John Cook’s top article [****] e.g. H. Cheng et al. (2009) Ice Age Terminations Science 326, 248 – 252 http://www.sciencemag.org/cgi/content/abstract/326/5950/248 P. Huybers & G. Denton (2008) Antarctic temperature at orbital timescales controlled by local summer duration Nature Geoscience 1, 787 – 792 http://www.nature.com/ngeo/journal/v1/n11/abs/ngeo311.html E. W. Wolff et al. (2009) Glacial terminations as southern warmings without northern control Nature Geoscience 2, 206 – 209 http://www.nature.com/ngeo/journal/v2/n3/abs/ngeo442.html
    0 0
  7. chris: Thank you, that was interesting. So that will imply a local negative feedback mechanism related to warming in the NH, but which on the global scale just rearranges heat so that the SH warms even more. I have heard elsewhere about the see-saw NH/SH pattern, the explanation you provide seems quite plausible. What you are arguing, I take it, is that the insolation at 65N is the most interesting in order to predict milankovitch-related warming even at the SH, due to circulatory mechanisms such as the AMOC. That is also what I after some doubt assumed in my post, so I do appreciate that argument. (although I'm not sure how the milankovitch-related insolation varies depending on latitude, or if it does it in a way that is at all significant on the timescales in question here. This might even be a non-issue?). However, do you suggest that differences in how the AMOC responds to insolation changes may explain why we see different phase patterns (between insolation and warming) at the different warming periods present in the vostok ice core data? Or are we still clueless on that account?
    0 0
  8. One of the papers in the link above to papers on Milankovitch cycles (link at end of article) argues that the relationship between ice ages and the Milankovitch cycles is very weak and doesn't really explain anything. "Quantitative estimate of the Milankovitch forced contribution to observed Quaternary climate change", Wunsch 2004
    0 0
  9. Non-scientist asking a scientific question here. The chart showing CO2 and temperature changes for the past 400,000 years shows CO2 lagging. I would assume that the level of uncertainty in our measurement of the number of years increases as we increase the number of years we go back in time. For example, we can confidently compare data that's measured decades back, but I would suspect that thousands of years back (as we see above) have a much greater margin of error. This would suggest to me that CO2 may not lag temperature and may even be a driver in the increase. What data disproves that and why can we be confident with that? My thinking is that, e.g., while we may say that a particular ice core sample used to measure CO2 is 400,000 years old -- perhaps that plus or minus 10,000 years?
    0 0
  10. Henry's Law is not appropriate for the solubility of CO2 in sea water. See here for more details: http://cdiac.ornl.gov/oceans/co2rprt.html
    0 0
  11. Dennis, the uncertainty on lag of CO2 is of the order of some centuries, not thousands of years. The precision in the absolute dating of the air bubles depends on many factors, including accumulation rate and temperature, so it strongly depends on the geographic location of the ice core. Whenever possible the dating of the ice core (or part of it) is calibrated using known and well defined events.
    0 0
  12. Dennis, you are correct that there is large uncertainty in measurements, and there is additionally the fact that datapoints for carbon dioxide are typically separated by thousands of years which adds to the measurement uncertainty. This leads to the situation where you can't usually say on individual moments for sure that there's temperature leading. However, the lead/lag situation has been determined statistically from the whole datasets, not from individual events. So, I would say that the temperature leading is real phenomenon but we can't rule out that there might be some individual events where CO2 leads. Here's an example data for carbon dioxide (from Vostok ice core) where you can get the feel of the thing yourself: http://cdiac.ornl.gov/ftp/trends/co2/vostok.icecore.co2
    0 0
  13. First I’d like to commend John for a great blog. This is a fabulous resource and your careful, thorough, and prompt explanations of new science papers is very impressive. Thanks! Temperature’s lead over CO2 in Antarctic ice core records keeps getting mentioned as proof against human impacts on climate, so it’s good to have an objective discussion of the issue. Here I present some additional perspective from the paleoclimate community I’m sorry this comment is so long, but it’s a complex issue. John - It seems that the link to Shemesh et al., 2002 is still broken. At least I get a damaged file. Presumably this is: Shemesh, A., Hodell, D., Crosta, X., Kanfoush, S., Charles, C. and Guilderson, T., 2002. Sequence of events during the last deglaciation in Southern Ocean sediments and Antarctic ice cores. Paleoceanography, 17(4): 10.1029/2000PA000599. Turboblocke - Henry’s law absolutely applies to CO2, as it does to all gases. The CO2SYS document from the CDIAC web site doesn’t support that claim. The main difference between CO2 and other gases is that once CO2 dissolves from air into seawater it undergoes further reactions, dissociating into bicarbonate and carbonate ions. This makes the chemistry of carbon dissolved in seawater complex, but CO2 gas still obeys Henry’s Law. Dennis, Riccardo - Yes, the uncertainty in the overall age model for an ice core gets larger further back in time, as does the uncertainty in the difference between the ages of gas and of ice at any given depth. For those who aren’t familiar, at any given depth in an ice core the ice is at least a few hundred years, and sometimes a few thousand years, older than the gas. This is because gases diffuse through firn (packed snow) before it is sealed off as ice. The age offset between gas and ice increases as the accumulation rate of snow decreases. Therefore, the ice-gas age difference is much greater during ice ages, when there is less snow accumulation, than during interglacials. Uncertainty in the ice-gas age difference has been a big problem in establishing reliable lead-lag relationships between temperature and CO2. People have done statistical analyses of gas-ice age differences, but the best statistics still produce meaningless results if the age models for ice and/or gas are inaccurate. This applies to the data set cited by Ari Jokimäki. Age models for ice cores are constantly being revised. See: Bénédicte et al., Consistent dating for Antarctic and Greenland ice cores. In Press, Quaternary Science Reviews, Available online 3 December 2009 The uncertainty between gas age and ice age can be virtually eliminated at glacial terminations (i.e., at the end of an ice age) when the initial warming is recorded by the isotopic composition of argon gas, which can then be compared directly against CO2 concentration. Since both temperature and CO2 come from the gas phase, there is no age offset in need of correction. This is how Caillon et al. 2003 (cited by John) was able to show that temperature started to rise in Antarctica before CO2 began to increase. This direct evidence is more robust in my opinion than the statistical comparison of CO2 and temperature on different age models, each with their own uncertainty. I think Caillon et al convinced paleoclimate scientists that the initial increase in temperature in Antarctica leads the initial rise in atmospheric CO2 at the end of an ice age by several hundred years. This leads to the main point that I wanted to make, namely: Why did temperature start to rise in Antarctica before concentrations of CO2 began to increase at the end of an ice age? Does this mean that CO2 does not have an impact on climate? Two hypotheses have already been described. I will summarize those and add a third. The first hypothesis invokes changes in earth’s orbit (Milankovitch) and its effect on spring insolation around Antarctica. Increasing insolation in spring is suggested to cause sea ice to melt back earlier in the year, which allows more CO2 to escape from the ocean to the atmosphere. A scenario like this was invoked by Shemesh et al. (2002) and would follow from the conclusions of Huybers and Denton (2008; cited by Chris). The general principles are described in a paper by Stephens and Keeling: (Stephens, B.B. and Keeling, R.F., 2000. The influence of Antarctic sea ice on glacial-interglacial CO2 variations. Nature, 404(6774): 171-174.). However, if you read the papers that comment on Stephens and Keeling, you will find skepticism in the paleoclimate community about whether or not sea ice can truly serve as a “lid” holding CO2 in the ocean. Second, Chris described a hypothesis that is commonly invoked for the sequence of events at the end of an ice age, namely: 1) Changes in Earth’s orbit (Milankovitch again) led to warmer summers in the Northern Hemisphere. 2) Warmer summers started melting the large northern ice sheets that built up during the ice age. 3) Freshwater from melting ice flowed into the North Atlantic. Because of its lower density, the freshwater slowed or stopped the overturning circulation that transports heat northward. 4) This had a global impact, but here some hypotheses diverge (denoted A and B below). According to the ocean bi-polar seesaw hypothesis described by Chris: A5) Reduced northward flow in the Atlantic allowed heat to build up in the Southern Hemisphere, a phenomenon known as the bipolar seesaw. A6) Warming of the Southern Ocean caused CO2 to be released from the ocean due to the lower solubility of gases in warmer water. Rising CO2 followed the initial warming of the Southern Ocean and of Antarctica, and also contributed to warming of the Earth as a positive feedback. (See Chris - Post 6, point 2c) A problem with this hypothesis is that the temperature dependence of CO2 solubility in seawater is well known, and the rise in ocean temperatures during deglaciation is not nearly large enough to have caused the observed rise in CO2. This was pointed out long ago by Broecker and others. The principle is firmly established in the scientific literature. Broecker, W.S., 1982. Glacial to interglacial changes in ocean chemistry. Progress in Oceanography, 2: 151-197. Something other than warming must have caused CO2 to be released from the oceans. This is why some people invoke the melting of sea ice to allow more CO2 to escape (see above). However, (a) as noted above, others have argued that sea ice is not sufficiently effective as a barrier to gas exchange and (b) changes in sea ice driven by orbital forcing cannot explain the tight correlation between CO2 and Antarctic temperatures on the millennial time scales that are shown in Figure 1 of: Ahn, J. and Brook, E.J., 2008. Atmospheric CO2 and climate on millennial time scales during the last glacial period. Science, 322(5898): 83-85. A third hypothesis not yet described in this thread of comments involves a reorganization of global wind systems toward conditions more favorable for mixing in the Southern Ocean that drives CO2 from the ocean to the atmosphere. The process begins as above, with changes in Earth’s orbit melting northern ice sheets and slowing Atlantic overturning circulation (Points 1 - 4). Then the emphasis switches from the ocean to the atmosphere: B5) When freshwater shuts down Atlantic overturning circulation, winter sea ice expands over the North Atlantic, causing severely cold winter conditions. B6) Cold winters cause changes in atmospheric circulation, which are well documented for the Intertropical Convergence Zone and for the Asian Monsoons (see Cheng et al., 2009, cited by Chris, and references therein). B7) Reorganization of the winds extends all the way to Antarctica, strengthening the Southern Hemisphere westerlies so that they are more effective at driving CO2 out of the ocean. According to this hypothesis, intense cooling in the northern hemisphere causes warming in the southern hemisphere by changing wind patterns. The initial warming in Antarctica is caused more by a redistribution of heat from north to south than by a global rise in temperature. The winds then drive CO2 out of the ocean so that the observed rise in CO2 lags slightly the initial warming detected in Antarctic ice cores. It takes a few thousand years to melt the northern ice sheets. During this time when meltwater is being dumped onto the North Atlantic, the winds are shifted and CO2 is being driven out of the Southern Ocean. These conditions can experience brief reversals, as happened 14,500 years ago during the Bolling period. After the Bolling warm period, the conditions resumed during the Younger Dryas period. Increased atmospheric CO2 together with reduced albedo following the meltback of the northern hemisphere ice sheets provided the feedbacks to Milankovitch forcing that brought the earth out of the last ice age into a warmer interglacial period. The principles underlying the forcing of CO2 by shifting winds over the Southern Ocean are described by Toggweiler (2006). Evidence to support the principles, but modifying the timing, are described by Anderson (2009). See also comment by Toggweiler (2009). Toggweiler, J.R., Russell, J.L. and Carson, S.R., 2006. Midlatitude westerlies, atmospheric CO2, and climate change during the ice ages. Paleoceanography, 21(2): doi10.1029/2005PA001154. Anderson, R.F., Ali, S., Bradtmiller, L.I., Nielsen, S.H.H., Fleisher, M.Q., Anderson, B.E. and Burckle, L.H., 2009. Wind-driven upwelling in the Southern Ocean and the deglacial rise in atmospheric CO2. Science, 323(5920): 1443-1448. Toggweiler, J.R., 2009. Shifting Westerlies. Science, 323(5920): 1434-1435. These hypotheses all need to be investigated further. Each has strengths and weaknesses. Given the complexity of Earth’s climate system and its connection to the global carbon cycle, the correct answer is likely to be “all of the above”.
    0 0
  14. Boba, interesting comments. I've always felt that CO2 coming from warming oceans didn't seem quite right from a simple chemistry view point (it seemed to me that it was unlikely that the oceans would be saturated because of various cycles). Have you considered that the increase in CO2 during deglaciation periods could be from methane released by the retreating ice and permafrost? The methane will then be oxidized both biologically and photochemically to CO2.
    0 0
  15. According to the graph presented here and in a previous article: http://www.skepticalscience.com/The-correlation-between-CO2-and-temperature.html (figure 2) a 10 degree change in Earths temperature causes a change of 90 ppm CO2, while a change of 60 ppm CO2 could possibly have partially effected 1 degree of change in the Earths temperature. This data indicates that temperature drives CO2 much stronger than CO2 drivers temperature.
    0 0
  16. re #7 Andreas As I mentioned in the post above, there are some other scenarios that involve a more direct S. hemisphere response to Milankovitch-driven insolation changes. It does seem clear that glacial termination is driven by Milankovitch cycles; however Milankovitch driven insolation variation obviously applies to the S. hemisphere as well (see below). It’s likely that the AMOC underwent quite abrupt ice melt driven cessations (and re-establishments); it’s difficult otherwise to explain the sharp temperature drops/rises in the Greenland core (and their lack of appearance in the Antarctic cores). But whether these were active/causal or passive/responsive phenomena is still an open question I believe, ‘though I find the scenario outlined by Barker/Broecker (paraphrased in my post #6) plausible. And one could substitute the enhanced Westerly-driven Southern ocean-destratification mechanism that boba describes (Anderson et al, 2009; Toggweiler 2009 cited in boba’s post) as the warming-driven proximate cause of CO2-outgassing from the Southern oceans, within the same ultimate scenario of Barker/Broecker. In this case the Arctic melt-water induced weakening/shut-down of the AMOC warmed the Southern oceans at the expense of Northern latitude warmth, and shifted the Intertropical Convergence Zone southwards, pushing the Southern westerlies closer to Antarctica and “stirring up” the deep Southern oceans to promote CO2 release. Looking at the alternative proposals, Stott et al (2007) consider that the glacial terminations might be driven by direct Southern ocean ice sheet responses to austral spring insolation variation (Milankovitch), and that the warming-induced CO2 release from the Southern oceans transmits the warming to the N. hemisphere, to give the Antarctic warming > CO2 release > Greenland warming sequence at the terminations. Their plot of the Milankovitch variation of austral spring insolation varies in synch with the N. hemisphere summer insolation at 65 oC… ..and Huybers and Denton, consider that it is the Milankovitch-forced variation of the duration of the S hemisphere summer (which covaries with the Milankovitch-forced variation of the intensity of the N. hemisphere summer), that is important…. If I understand your last question (different phase patterns between insolation and warming) it could be that this is a result of different response of AMOC. Since the insolation variation is extremely regular (and predictable), any non-regular/variable consquences should have their origins in less predictable responses to the regular insolation variation. If the AMOC responds to ice-melt intensity, presumably this has rather non-regular features and will impose a more stochastic pattern onto the insolation-driven changes. But more generally, if (by whatever scenario), N. hemisphere warming is ultimately driven by CO2-release from the vast S. oceans in response to S. latitude warming/reduced S-N hemisphere temperature gradients, the very slow warming, with associated very slow CO release, may, by itself, result in a phase difference between insolation patterns, and warming responses. While there are still some issues with matching the timings exactly between Greenland and Antarctic cores, it seems clear that Antarctic warming precedes Greenland warming during terminations, and even during some of the periodic warming transitions within glacial periods…again variations in the AMOC seem to be implicated in these events…
    0 0
  17. re #14 Ian, the paper by Ahn and Brook that bobo cites [*] has a very intersting overlay of CH4 levels in Greenland and Antarctic cores, together with Greenland and Antarctic temperature proxies (delta 18-O2) and Antarctic CO2 levels (see Figure 1). Several things are striking (to me)...boba might have some further insight: 1. Within the last glacial period small variations in CO2 levels follow Antarctic temperature variation pretty faithfully, but the large CO2 rise at the termination from ~17000 to ~11000 years ago lags Antarctic warming quite markedly (as described in the top article). 2. Methane levels follow Greenland temperature variation very faithfully indeed, and are non-synchronous with Antarctic temperature change until the termination. The simple explanation would be that methane levels follow high N. latitude warming (perhaps associated with methsane release from tundra melt??). 3. This is very striking. The very sharp warming/cooling pulses in the Greenland cores associated (likely) with on-off shifts in the AMOC have totally synchronous sharp rises/falls of methane levels that are observed (synchronously) in Greenland and Antarctic cores. 4. At least within glacial periods, the slow CO2 rises and falls (of around 20 ppm over several thousand years) associated with slow Antarctic temperature rise and fall, occur well in advance of the methane spikes associated with Greenland warming spikes. That would imply that the enhanced CO2 is not a result of enhanced methane release and oxidation to CO2. Even during the termination where the Antarctic temperature rose rather steadily between ~20-10,000 years ago, the Greenland warming has a cold interval (Younger Dryas) which has a synchronous coincident drop in methane (observed in Greenland and Antarctic cores). So it really does look like methane levels match events in the N. hemisphere. J. Ahn and E. J. Brook (2009) Atmospheric CO2 and Climate on Millennial Time Scales During the Last Glacial Period Science 322, 83-85 http://www.sciencemag.org/cgi/content/abstract/322/5898/83
    0 0
  18. re #15, there's a less than logical element to your description of temperature>CO2 and CO2>temperature causalities RSVP. This relates to the likely accessible range of temperature and CO2 variations. So, in fact during glacial-interglacial transitions the global temperature change of around 5-6 oC results in a repartitioning of CO2 between the oceans/terrestrial environment and atmosphere equivalent to around 90 ppm (i.e. something like 15-18 ppm of atmospheric CO2 rise per oC of global warming at equilibrium). However the potential for CO2 rise from non-temperature-dependent repartitioning (e.g. from extraterrestrial impact into carbonate-rice sediments, or massive tectonic events like flood basalt release, or anthropogenic burning of fossil fuels) is much larger than the 90 ppm of [CO2] repartitioned to the atmosphere during glacial-interglacial transitions. So whereas a 90 ppm CO2 rise is near the limit of any realistic temperature-induced enhancement of atmospheric CO2 probably during the past 100's of millions of years, it is very easy for non-temperature-dependent drivers of [CO2] to push CO2 concentrations above 1000-2000 ppm (we could easily manage to reach 1000 ppm during the next 150 years). So in the real world, [CO2] variation is, and always has been, a major effector of global temperature variation, whereas global temperature change is a rather minor effector of atmospheric [CO2] variation. One could look at specific examples. During the Medieval Warm Period, atmospheric CO2 levels seem not to have risen more than a few ppm above pre-MWP levels. Now that likley means that the MWP didn't result in very much global scale warming. The drop in atmospheric CO2 during the Little Ice Age (LIA) from ~ 280-276 ppm was seemingly also very small. That's because the atmospheric CO2 levels respond to a rather small extent to changes in global temperature. On the other hand global temperatures are responding much more significantly to the raised anthropogenic CO2 levels. One can easily be fooled by numbers. It's not the magnitudes of the numbers, as such, that are relevant, but the accessible ranges of likely variation...
    0 0
  19. Interesting, I hadn't realised there was a considerable dating uncertainty in the ice record of CO2. I had assumed, because these are long continuous and fine-scaled records, that the dating was something equivalent to tree rings or mud varves. The error margin puts into perspective the constant refrain - "oh, but CO2 increase lags temp rise, how can it be cause and effect?" Seems to me that if there is an error margin on age, then the record should just be read as showing a very close (indeed astonishingly close as such things go) correlation between CO2 and temps over a very long time period as John's graph illustrates. Whether CO2 increase "leads" temp increase (as it is doing in modern times) or whether it is working as a feedback and amplifying mechanism seems irrelevant. Of no more than academic curiosity when we are considering the distant past. The close correlation shows that the two mechanisms are effectively just one, and that is the frightening conclusion as we continue to pump CO2 into the air in a never ending experiment to see just how far we can go before catastrophic change ensues.
    0 0
  20. chis From what I can tell from the curves above, CO2 tracks Earth temperature like a flea rides on an elephant. Its hard for me to be "less than logical" faced with something so obvious, but I guess you must have some kind of point.
    0 0
  21. Well yes, RSVP but I think you're falling for exactly the mistake that John Cook highlights in his top post. There's little doubt that during the glacial cycles of about the last million years or so, that CO2 concentrations tracked (and amplified) earth temperature changes that resulted from Milankovitch cycles. However it would be illogical to conclude from this that atmospheric CO2 levels respond to earth temperature changes in a more significant manner than earth temperatures respond to changes in CO2 levels. One could look at the last 1000 years for example [tiny changes in atmospheric CO2 during the temperature variations associated with the MWP and LIA, compared to the mach larger earth temperature rise in response to changes in (anthropogenic) CO2 levels)]. Likewise, inspection of the Phanerozoic temperature/CO2 record indicates that the Earth has responded in a very significant manner to changes in atmospheric CO2 levels. In fact the reason that we now inhabit an earth with very significant polar ice caps is the result of the decrease of atmospheric CO2 levels during the late Eocene/early Oligocene. Just because CO2 tracked earth temperature during a particular set of specific and rather well-understood climate phenomena (Pliestocene glacial transitions), it's illogical to conclude that earth temperature variations are the dominant cause of CO2 variations. In fact the evidence supports the opposite conclusion, namely that changes in greenhouse gas levels dominate earth temperature variations. We're experiencing an example of that during the present era....
    0 0
  22. A couple of things to add to what Chris has posted: Ian - If the CO2 were coming from methane, then it would have a strong isotopic signature characteristic of the methane. Natural sources of methane are strongly depleted in carbon-13 relative to carbon-12. During the deglaciation there is a small excursion in the isotopic composition of CO2 recovered from ice cores (Smith et al., 1999), but much smaller than would be expected of the CO2 were produced by oxidation of methane. Rather, the carbon isotope signature of CO2 during deglaciation is consistent with the release of CO2 from the deep ocean (Spero and Lea, 2002). Smith, H.J., Fischer, H., Wahlen, M., Mastroianni, D. and Deck, B., 1999. Dual modes of the carbon cycle since the Last Glacial Maximum. Nature, 400(6741): 248-250. Spero, H.J. and Lea, D.W., 2002. The cause of carbon isotope minimum events on glacial terminations. Science, 296(5567): 522-525. David - In Greenland the annual layers of ice can be counted back for about 40,000 years. In older ice they become squeezed so much by the pressure of the overlying ice that they can no longer be identified. (I don’t remember exactly how far back people have counted annual layers, but it’s roughly 40,000 years). In Antarctica the annual layers cannot be counted so far back in time because the annual snow accumulation is generally much less than in Greenland. Therefore the layers start out thinner and it takes less time before they become indistinguishable.
    0 0
  23. Thanks all for the wonderfully informative posts & comments. I've learned a lot just from reading this one page!
    0 0
  24. Chris, The CO2 level lagging suggests, CO2 is subject to the Milankovitch cycles and not the other way around. As concerns eccentricity, obliquity, and precession, it would seem that precession would not affect climate at all, except in shifting seasons with respect to their relation to the stars. Furthermore, depending on the phase relation of eccentricity and obliquity, you could either have a reinforcing or cancelling effect. I did not see any mention of this in the article, however based on the sawtooth waveform, where the temperature rise is punctuated after a long and slow dropoff, this would seem to indicate a reinforcing where the orbital minimum coincides with less tilting. In any event, I agree that my perception appears "less than logical" to anyone who is bent on proving AGW.
    0 0
  25. RSVP: "The CO2 level lagging suggests, CO2 is subject to the Milankovitch cycles and not the other way around." It works both ways. If you force a temperature change first, CO2 will follow (and amplify the temperature change). If you force a change in CO2, temperature will follow (and amplify the CO2 change). Milankovich cycles are an example of the former. But there are plenty of examples of the latter, too, including: [a] Weathering during tectonic uplift (which removes CO2 and cools the planet; see, e.g., Ruddiman 1997). [b] Chris's examples of the vaporization of carbonate-rich rocks from a bolide impact, or outgassing of CO2 during massive flood basalt episodes, both of which add CO2 and warm the planet. [c] Rapid release of fossil carbon from methane clathrates, or from combustion of coal and oil. With all due respect, RSVP, there are commenters on this site who have a great deal of expertise in earth system science. I for one really appreciate their taking the time to participate here -- it's what makes this site stand head-and-shoulders above most other climate blogs. You could learn a lot by paying more attention to what some of those commenters have to say, rather than just tossing out one argument after another.
    0 0
  26. Ned I dont think I have introduced anything tangentially into the discussion, and any comments, opinions, or deductions have been based on the material as presented on this website. Usually these comments address aspects of the apparent "fundamental harmonic" of what is being presented. For instance, in #15, using the data as given, I imply Milankovitch cycles have tens times the weight of CO2 in affecting climate. I am not inventing anything here, just commenting on what the data seems to suggest. Is that so out of order?
    0 0
  27. CO2 lags temperature change for one obvious reason. The ocean contains 93% of all of the CO2 in our biosphere in one form or another. Some of the CO2 which is locked up in the ocean in the form of soluble gas is exhausted into the atmosphere when the ocean warms and it is reabsorbed by the ocean when the ocean cools. Out-gassing... This phenomenon of the change in the solubility of gases in liquids as a function of temp and pressure has been of course been measured many times over and can be proven with the simplest lab experiments. In other words, on this issue, the science is really truly and honestly "settled". This phenomenon is also the reason that ocean CO2 concentrations are greater in the polar regions than in the tropics and this is why tropospheric concentrations of CO2 in the atmosphere are greater in the tropical regions than in the polar region. As my daughter would say, its a "Henry's Law" thingy... http://en.wikipedia.org/wiki/Henry's_law That is why warmer climactic periods usually result in higher levels of atmospheric CO2. Of course, that is not necessarily true. Periods of exceptional volcanism can temporarily create a climate which is simultaneously cold and rich with CO2.
    0 0
  28. An interesting article which explains why a period of extreme global glaciation could also be simultaneously a period of extremely high levels of atmospheric CO2. There is one point which the article does not make as clear as possible. When the earth is extremely cold, humidity is also extremely low. What happens in a cold climactic setting is that the effect of CO2 as a greenhouse gas is amplified simply because CO2 and H2O both absorb energy from the two of the same spectral bands. Currently H2O exists at levels 50 times greater that CO2 (20-25,000 ppm vs 387 ppm). So, now, most of the IR energy for the overlap bands is absorbed by H2O. However, if the air was nearly bone dry while CO2 concentrations were in the range of say 10,000 ppm, CO2 could actually become a much more influential greenhouse gas. To view the overlap spectra of CO2 vs H2O use this link... half way down the article shows a graph of the impact of various greenhouse gases on the IR spectra of energy that is reflected from the earths surface .. http://forthegrandchildren.blogspot.com/2009/03/best-global-warming-discussion-ever.html Link to the entire article http://www-eps.harvard.edu/people/faculty/hoffman/snowball_paper.html “”In the late 1980s, Joe Kirschvink at the California Institute of Technology pointed out that during a global glaciation, what he termed a "snowball" Earth, the supply of carbon dioxide to the atmosphere and oceans from volcanism would continue because of plate tectonics. However, if the Earth were so cold that there were no liquid water on the continents, weathering reactions would effectively cease, allowing carbon dioxide to build up to incredibly high levels. Eventually, the carbon-dioxide-induced warming would offset the ice albedo, and the glaciation would end. Given that solar luminosity 600-700 million years ago was about six percent lower than today due to stellar evolution, Ken Caldeira and Jim Kasting at The Pennsylvania State University estimated that roughly 0.12 bar of carbon dioxide (about 350 times the present concentration) would have been required to overcome the albedo of a snowball Earth. Assuming current rates of volcanic carbon dioxide emissions, a Neoproterozoic "snowball" Earth would have lasted for millions to tens of million of years before the sea ice would begin to melt at the Equator. A "snowball" Earth would not only be the most severe glaciation conceivable, it would be the most prolonged.””
    0 0
  29. You know, I wish this thread had a different title. CO2 lags temperature sometimes. See, e.g., Milankovich cycles. CO2 leads temperature sometimes. See, e.g., flood basalt episodes, vaporization of carbonate rocks during bolide impacts, and combustion of fossil fuels. Somebody or other once compared CO2 and temperature to two individuals handcuffed together. Wherever one goes, the other has to follow. Right now, we're very much in a situation where CO2 leads temperature.
    0 0
  30. It is I think important to remember that prior to human industrial activity CO2 was, for all practical purposes, a feedback not a forcing. Given that we know that the CO2 increase by ~15ppm per deg C., we can calculate that at the depths of the ice age there was a CO2 feedback of 1.12(assuming CO2 concentrations of 205 and 190 respectively). (ln(205/190)/ln2)*3.7w/m2 gives ~ 0.4/W/m2 ~temp increase is ~.11+ .11^2+.11^3.... is approximately equal 1.12. IOW if the sensitivity of the climate not counting CO2 was 3 deg. K/W/m2, the sensitivity of the climate including CO2 should be ~3.36K/W/m2. Cheers, :)
    0 0
  31. "•Deglaciation is not initiated by CO2 but by orbital cycles •CO2 amplifies the warming which cannot be explained by orbital cycles alone •CO2 spreads warming throughout the planet". Inconvenient fact No. 1, not mentioned. On any normal day which warms after a cool night/period, cloud cover decreases, which amplifies the warming substantially. None of the papers you refer to mention this simple fact. If the earth warms, cloud cover, especially in temperate zones, decreases. There are numerous papers on this subject. It's therefore not all c02 amplifying and spreading the warming after ice ages. Inconvenient fact No.2, not mentioned. When ice cover decreases after an ice age, the amount of reflected sunlight substantially decreases; this happens in a relatively short time once the ice cover thins from widespread but thin cover over Eurasia and North America early in the warming trend, to vast areas which rapidly thin to next to nothing, causing a tipping point reduction in reflected sunlight over large areas, further reduced cloud cover and amplifying the warming trend. Inconvenient Fact No.3, not mentioned. Oceans take many centuries/thousands of years to warm after an ice age. Once ocean current patterns begin to change, also associated with ice break ups, the redistribution of heat leads to relatively rapid earth warming. Such factors as above can account for amplifying warming at the end of the ice age without the usual 'insertion' of greenhouse gas forcings favoured by some academics. C02 and other greenhouse gases are not the only driver of warming after an ice age as you fail to mention; apart from orbital changes, other natural earth factors than a small rise in greenhouse gases substanitally amplify the warming.
    0 0
  32. "the usual 'insertion' of greenhouse gas forcings favoured by some academics", and, um, favoured by physics.
    0 0
  33. RE$ thingadonta Care to back it up with the actual papers that support your hypothesis?
    0 0
  34. I could not find anywhere in the post the claim that CO2 in the *only* feedback ... probably thingadonta missed the title of this post.
    0 0
  35. Also not mentioned is the increase in WV caused by warming, which will have a greater effect than CO2 released by warming oceans. During a glacial period the atmosphere will be pretty dry - as warming proceeds via the Mkz cycle the tropics will warm substantially with subsequent increase in WV. Czaja & Marshall (2005) estimate that 90% of the heat moved polewards ( above 30 lat) is transported by the atmosphere - which also suggests that warming in a glacial period would be via the atmosphere as during such a period the ocean circulation would be restricted. Which would account for the 'lag' between temp and CO2 levels.
    0 0
  36. re#32, #33, #34 It is widely known within the scientific literature that the onset of ice ages from around 4+ million years ago was largely caused by oceanic circulation changes, particularly the closing of the Isthmus of Panama between N and S America. The increase in the Southern Ocean from the widening gap between Antartica and Australia is also believed to enhance cooling, becuase the development of a strong Southern Polar wind/ocean belt restricts transfer of cooler water to northern cimes. All of this has nothing to do with c02. A general rule of thumb is: restricted ocean circulation means cooler periods, enhanced ocean circulation means warmer periods. C02 lags follows these temerpature changes due to the strong relationship between ocean temperature and c02 solubility. Oceans dwarf the effects of c02 and greenhouse gases, and plate tectonics and oceanic circulation has nothing to do with c02 and the greenhouse effect. Much the same goes for the end of ice ages. Ice break up caused by orbital changes enhances oceanic circulation causing enhanced warming. This has nothing to do with C02. c02 is 1/10,000 parts per million by volume of the atmosphere (which is a statistic you wont read at green websites), and the relatively small effect of c02 greenhouse warming is dwarfed by oceanic circulation changes on earth temperature. To state simply that 'c02 did it' (ie largely causing the end of ice ages), is not only putting the cart before the horse, but also making the cart pull the horse up the mountain. No one is disputing the 'physics of c02' and greenhouse effect, the issue is one of relative effect; c02's physical effects are dwarfed by oceanic circulation changes on temperature intiated by solar variations and ocean current changes, and c02 follows these changes, it does not cause them.
    0 0
  37. thingadonta at 06:52 AM on 16 January, 2010 "No one is disputing the 'physics of c02' and greenhouse effect, the issue is one of relative effect; c02's physical effects are dwarfed by oceanic circulation changes on temperature intiated by solar variations and ocean current changes..." Could you explain that a little more fully? Is this heat energy you're speaking of, sequestered in the oceans for long periods of time, stored up, isolated somehow? How does that work, exactly? Or are you saying ocean actually add thermal energy to the planet, somehow converting kinetic energy into heat? Are we speaking of magnetohydrodymamics? Solar variations are not enough to drive the sort of thermal changes we see in the history of the planet, and meanwhile the energy has to come from somewhere. If it's not some kind of change in the amount heat retained from sunlight striking the planet, it must have some internal source, or it must have been stored by some means. You apparently do not think the temperature of Earth's surface has much to do with the atmosphere. Or do you? Your explanation does not seem complete.
    0 0
  38. Thingadonta, I don’t think the science supports your assertions, namely: “It is widely known within the scientific literature that the onset of ice ages from around 4+ million years ago was largely caused by oceanic circulation changes, particularly the closing of the Isthmus of Panama between N and S America.” and “All of this has nothing to do with c02” I’m curious to see what scientific literature you consider supports those, and perhaps you could give us some insight. I’d say that the science supports pretty much a diametrically opposite conclusion: 1. The difficulty with the closing of the Isthmus of Panama hypothesis for the instigation of N. hemispheric glaciations around 2.7 MYA is that the major effect on the high Northern latitudes was to increase the transport of warmth via intensification of the thermohaline circulation (aka Gulf Stream). So this would act to suppress Arctic glaciation, competing against the potential positive contribution to glaciation of enhanced heat transport, namely enhanced evaporation/precipitation. There’s been quite a bit of analysis of which of these might prevail, and the conclusions seem to be that the net effect of closure of the Isthmus of Panama would be either in the direction of suppressing Arctic glaciations [*] or more or less neutral in its effects on Arctic glaciation [**], [***]. [*] Klocker A, Prange M, Schulz M (2005) Testing the influence of the Central American seaway on orbitally forced Northern Hemisphere glaciations Geophys Res Lett 32:L03703 http://www.agu.org/pubs/crossref/2005/2004GL021564.shtml [**] Lunt D J et al. (2008) Closure of the Panama Seaway during the Pliocene: implications for climate and Northern Hemisphere glaciations Climate Dynamics 30, 1-18 http://www.springerlink.com/content/771146124678817l/?p=b0dbbbc2123c4f60832443d41ad386f8&pi=0 [***] Lunt D J et al. (2008) Late Pliocene Greenland glaciation controlled by a decline in atmospheric CO2 levels Nature 454, 1102-1105 http://www.nature.com/nature/journal/v454/n7208/abs/nature07223.html 2. As suggested by the title of the Lunt (2008) Nature paper above, the evidence increasingly supports slow reductions in atmospheric CO2 concentrations as the major driver of reduced temperatures that forced the onset of glaciations. This applies both to the Arctic glaciations of the late Pliocene [**], [***] (see above), [****],[*****] and also the onset of Antarctic glaciations 33-34 MYA [******]: [****] R. Bintanja and R. S. W. van de Wal (2008) North American ice-sheet dynamics and the onset of 100,000-year glacial cycles Nature 454, 869- 872 http://www.nature.com/nature/journal/v454/n7206/abs/nature07158.html [*****] Tripati AK et al. (2009) Coupling of CO2 and Ice Sheet Stability Over Major Climate Transitions of the Last 20 Million Years Science 326, 1394-1397 http://www.sciencemag.org/cgi/content/abstract/1178296 [******] DeConto R. M. et al. (2008) Thresholds for Cenozoic bipolar glaciations Nature 455, 652-655 http://www.nature.com/nature/journal/v455/n7213/full/nature07337.html
    0 0
  39. #38 Chris I like someone like yourself who at least keeps to the science. When I was at university, these were the things we were taught back in the 1980s-1990s. I am not nearly as familiiar with more recent papers as I am not an active researcher, maybe I could drag up some papers from my uni days. "the evidence increasingly supports slow reductions in atmospheric CO2 concentrations as the major driver of reduced temperatures that forced the onset of glaciations. This applies both to the Arctic glaciations of the late Pliocene [**], [***] (see above), [****],[*****] and also the onset of Antarctic glaciations 33-34 MYA [******]:" I am not a fan of this statement at all. C02 lags and follows temperature changes (e Vostok ice core) it does not intitiate them. It seems to me to be the recent scientific fad to attribute everything to magical C02. C02 also lags changes in oceanic circulation because these drag down temperature which then drags down c02 due to increased solubulity with cooler water, whether on decadal, millenial or million year timescales. The reverse largely occurs with increased oceanic circulation. This is why c02 follows T change in earth history (and also continental configurations eg Permo Carbonifeous glaciation, etc), but it does not cause it. The earth cooled around 33-34 MYA (Ive read elsewhere is was 37Ma) largely because of slow ocean circulation changes eg: 1. -the gradual closing of the Tethys Sea between Africa and Asia, which is still going on today with the gradual closure of the Mediterranean-the Tethys sea remnant-which will dry up completely in the next few million years- cooling things further as Africa and Asia completely join-which incidentally might initiate cause widespread glaciation similar to the Permo carboniferous, and also this gradual closing has cooled Africa from several mllion years ago leading to more Savannah, and the evolution of a upright ape on the plains-us-but that is another story. 2-The gradual increase in the Southern Ocean beneath Australia creating a strong polar belt which does not transport heat northwards.(I think the southern tip of South America also has somehting to do with this). The Isthmus of Panama closing and dragging down earth temperature was common knowledge when I studied at uni, I dont know where this common knowledge has gone since then. Scientific preoccupation with c02? re#37 The oceans do not 'add thermal energy to the planet', they simply distribte it differently depending on plate tectonic configurations and sea levels, which can change markedly over short geological time due to eg closure at the continental scale eg Isthus of Panama, joining of Arabian Peninsula and Africa etc, break up and formation of ice caps etc.
    0 0
  40. RE# 39 thingadonta I don't think it's a preoccupation at all, it is the strongest link as to why there is a temperature anomaly over the last 50 years. And to keep making sure of this, more and more measurements and analysis are performed to verify it.(And lets not forget methane) It's fantastic that scientists can recreate past climates and find the causes as to why there was sudden shifts in atmosphere composition or biodiversity to major geological events, Earth's precession or even meteorites. Examples like the closing of the Isthmus of Panama are on the millions of years (geological) time scale. On the much much shorter climate age time scale, things like the general circulation or the pattern of the ocean conveyor belt are relatively stable compared to the geological events you have mentioned. In the context of climate ages, with CO2 being very strongly infrared active, , the sudden recent spike in CO2 ppm in the atmosphere, the sudden recent spike in globally averaged temperatures, empirical data showing CO2's effect on radiative forcing, (and temperature in this case not lagging CO2)it is impossible to overlook the villain.
    0 0
  41. oops I meant CO2 in this case not lagging temperature :$
    0 0
  42. re #39: thingadonta, the evidence tends not to support the interpretation of inception of polar ice sheets in Antarctica, and Greenland (see my post #38) that may have been the dominant theory in your uni days! In the intervening 20 or so years, that theory has been tested both for the N. hemisphere polar ice cap (see post #38) and the Antarctic ice cap (see following). In each case the evidence indicates that glaciations only occurred when CO2 levels dropped below thresholds that forced sufficient global cooling (these are thought to be of the order of ~ 700 ppm for Antarcic glaciations and ~ 300 ppm for Greenland glaciations). It’s possible that ocean circulation changes made some contribution (as likely did earth orbital properties). But greenhouse gas concentration seems to be the major player: (i) CO2 changes and temperature changes during the Phanerozoic (last 500-ish million years). The problem with the idea that changes in atmospheric CO2 concentrations in deep time are the response to earth temperature change is that these CO2 variations are simply too large. We can determine, for example, that during ice age glacial-interglacial-glacial transitions, atmospheric CO2 levels cycle rather faithfully between ~270 (interglacial) and ~ 190 (glacial ppm). These are slow (~5000 year) transitions (so CO2 re-partitioning between ocean/land and atmosphere will have come close to equilibrium), involving global temperature changes of around 5-6 oC. Therefore temperature-induced CO2 rises/falls are of the order of 13-15 ppm per oC of warming/cooling. Since the entire Phanerozoic temperature variation was likely no more than 10 oC overall, we don’t expect to see temperature-induced variation in CO2 levels of more than 150 ppm. However the CO2 changes observed in the record are much larger than this. The slow fall of atmospheric CO2 from 1000-1500 ppm during the mid to late Eocene to around 700 ppm at the Eocene-Oligocene boundary around 33.5 MYA and further to ~300 ppm and below by around 24 MYA (and ever since until now) are simply incompatible with temperature-induced changes in atmospheric CO2. (ii) Timing The steady long term cooling from the Eocene maximum global temperature at around 50 MYA began far in advance of any ocean circulation change resulting from isolation of Antarctica and possible effects on ocean currents. And the opening up of the Tasmanian gateway preceded the Eocene-Oligocene transition that heralded major Antarctic polar ice sheet growth by ~ 2 million years [*]. The steady cooling right through the middle-late Eocene to the onset of Antarctic glaciations ~ 33.5 MYA is associated with a long slow drawdown of atmospheric CO2 from 1500 ppm or greater to ~700 ppm [**]. As indicated in (i) the extremely large drops in atmospheric CO2 concentrations are incompatible with the idea of temperature-induced repartitioning of CO2 between oceans and atmosphere. Most likely the slow drop in atmospheric CO2 was due to enhanced weathering (possibly a result of the drifting of the highly weatherable volcanic Deccan Traps into the equatorial humid belt as the Indian subcontinent shuddered remorselessly Northwards for its eventually intimate rendevouz with Asia [***]). (iii) <>Attribution There are a number of studies that indicate that the ocean circulation effects associated with the isolation of the Antarctic continent are minor contributions compared to the effects of reduced-greenhouse-induced global cooling. Some of these are: a. The temperature changes associated with the cooling during the Eocene-Oligocene transition ~ 33.5 MYA and the onset of build up of a permanent ice cap in Antarctica, were global, and poorly compatible with the regional effects associated with changes in ocean gateways [****] b. As well as the timing mismatch in (ii), a number of studies have reconstructed and/or modelled the effects of ocean circulation changes involving isolation of the Antarctic continent, and concluded that the ocean circulation changes are simply not able to produce the localized cooling required for onset of Antarctic glaciations. This can have only occurred when atmospheric greenhouse gas levels dropped below thresholds that maintained the earth in a state without a significant permanent Antarctic ice cap [*****]. [*] Stickley, C. E et al. (2004) Timing and nature of the deepening of the Tasmanian Gateway, Paleoceanography, 19, PA4027 http://web.ics.purdue.edu/~huberm/STICKLEY.HUBER.PDF [**] P.N. Pearson et al. (2009) Atmospheric carbon dioxide through the Eocene-Oligocene transition Nature 461, 1110-1113 http://www.ncdc.noaa.gov/paleo/pubs/pearson2009/pearson2009.html http://www.nature.com/nature/journal/v461/n7267/abs/nature08447.html M. Pagani et al. (2005) Marked decline in atmospheric CO2 concentrations during the Paleogene Science 309, 600-603 http://earth.geology.yale.edu/~mp364/data/Pagani.Science.2005.pdf [***] D. V. Kent and G. Muttoni (2008) Equatorial convergence of India and early Cenozoic climate trends Proc. Natl. Acad. Sci. USA 105, 16065-16070 http://www.pnas.org/content/105/42/16065.abstract [****] Z. Liu et al. (2009) Global cooling during the Eocene-Oligocene climate transition Science 323, 1187-1190 http://www.sciencemag.org/cgi/content/abstract/323/5918/1187 E. Thomas (2008) Descent into the Icehouse Geology 36, 191-192 [*****] R. M. DeConto et al. (2003) Rapid Cenozoic glaciations of Antarctica induced by declining atmospheric CO2 Nature 421, 245-249 http://www.geo.umass.edu/faculty/deconto/deconto_nature.pdf Huber M et al. (2004) Eocene circulation of the Southern Ocean: Was Antarctica kept warm by subtropical waters? Paleoceanography 19, PA4026 http://doos.misu.su.se/pap/paleo2004.pdf M. Huber and D. Nof (2006) The ocean circulation in the southern hemisphere and its climatic impacts in the Eocene Palaeogeog., Palaeoclim., Palaeoecol. 231, 9-28 http://web.ics.purdue.edu/~huberm/huber+nof.pdf
    0 0
  43. Would somebody please help me understand the fallacies in T.J. Nelson's web page, "Cold Facts on Global Warming" available at http://brneurosci.org/co2.html I've seen some rebuttals dating back to 2005, but this guy seems to update his page quite frequently. His major premise (and the one that denialists seem to grab at) seems to be that the warming response to increased CO2 is logarithmic, and that we are "far out" on the curve, so greater increases in CO2 would result in less and less warming, to the point of being insignificant.
    0 0
  44. I am impressed with the quality of the contributions to this topic but it is a struggle for a non-scientist like myself to fully grasp the complexity involved. Apologies therefore for my question from ignorance but it is this: if temperature leads CO2 AND CO2 leads temperature, what stops this being an endlessly self-reinforcing cycle?
    0 0
  45. jdevlin, it comes down to the relative strength of the forcings and feedbacks. One also has to be careful with the use of the term "feedback", which in engineering terms can (but needn't!) convey a situation encompassing a self-reinforcing ramping of a system towards instability. In climate the feedbacks are perhaps more appropriately considered as "amplifications", and they tend to move the situation (earth average temperature) towards a new equilibrium state. So focussing specifically on the earth temperature -> CO2 -> temperature relationships. (a) empirical evidence supports a response of atmospheric CO2 levels to earth temperature changes, that is of the order of 13-15 ppm atmospheric [CO2] response per 1 oC of change in earth surface temperature. That can be determined from the well-characterized response of atmospheric [CO2] to earth temperature changes during glacial-interglacial cycles (see para 3 in post #42). (b) empirical evidence supports an earth surface temperature response to changes in atmospheric [CO2] equivalent to ~ 3 oC per doubling (or halving in a cooling direction) of [CO2]. This value includes all of the relatively short-term feedbacks associated with increased water vapour concentrations and earth albedo responses to melting ice [see *] below. In the long term (many hundreds or thousands of years), the earth's response to changes in [CO2] levels may be larger than this. (c) So we could consider the glacial to interglacial transition during the period 15000 to 10000 years ago. The earth temperature rose by around 5-6 oC globally, and the atmospheric [CO2] levels responded by rising from around 190 ppm (glacial) to 270 ppm (interglacial). One can calculate from a 3 oC earth surface temperature sensitivty to enhanced CO2, that the CO2 should give a "feedback" warming of ~1.5 oC [**]. (d) This is all mixed in together, since the slow release of [CO2] from the oceans during the ice age transition reinforced the warming during the entire slow transition. The ~1.5 oC from the [CO2] feedback, is mixed into the 5-6 oC of total temperature rise. (e) However if we were to seperate out (in time) the warming from the CO2 response, we might imagine the situation where we had a sudden earth temperature response of 3 oC (say) at the end of a glacial period. The atmospheric CO2 levels would rise slowly (as CO2 was "flushed" out of the oceans) and would rise from 190 ppm to around 235 ppm [15 ppm change per oC as in (a) above]. We can calculate (see [**]) that this will induce a further warming of around 1 oC, which would flush a further ~ 15 ppm of CO2 from the oceans (235-250 ppm) which would give rise to a further temperature rise of 0.3 oC, which would lead to a further 5 ppm [CO2] rise.......and so on. So you can see that this forcing/feedback response doesn't lead to a self-reinforcing "runaway" effect. It actually converges towards a new equilibrium state with both raised [CO2] and raised temperature... --------------------------------------------- [*] As the [CO2] rises the atmosphere warms, and the atmospheric water vapour concentration rises resulting in an amplification (positive feedback) of the warming. Likewise the combined [CO2]/water vapour warming of the atmosphere melts sea surface ice reducing the earth's albedo (reflectance of solar irradiance), and this additionally slightly amplifies the [CO2]/water vapour induced warming. Lumping all of these fast (water vapour)/fastish (fast ice albedo response) gives a combined climate sensitivity to raised atmospheric [CO2] of around 3 oC per doubling of atmospheric [CO2] [**]. These feedbacks can be analyzed in a similar manner as (e) above, and similarly converge to a new equilibrium temperature (rather than a "runaway" effect), such that the earth surface temperature is largely governed by the solar irradiance (largely constant), atmospheric [CO2], and ice sheet coverage, with additional influences from continental land mass arrangement and ocean/wind currents (and in the modern world, other greenhouse gases and aerosol pollutants). [**] delta T = (ln([CO2]final/[CO2]start))*3/ln(2) where delta T is the change in temperature at equilibrium in going from atmospheric [CO2]start to [CO2]final (e.g. from 190 ppm in an interglacial period to 270 ppm in an interglacial): delta T = (ln(270/190))*3/0.693 = 1.52 oC
    0 0
  46. re #43 DonMorton There are two main fallacies (and some minor, but still important, ones). (a) The first is to include a graph of temperature change resulting from enhanced [CO2] that starts at zero (i.e. zero [CO2]). The earth has never experienced [CO2] levels below around 190 ppm, and obviously for a phenomenon (earth temperature) that has an (approx) linear response to logarithmic changes in [CO2], this will massively over-exentuate effects at the irrelevant low [CO2] levels that the earth has never experienced. Graphing the full range of [CO2] from zero makes the earth response to changes at the high end (e.g. doubling [CO2] from 270 to 540 ppm, say), appear insignificant. (However we can calculate these, according to empirically-defined estimates of the climate response to [CO2] as in footnote [**] in post #45 just above). (b) The second is to pretend that the earth's temperature response to raised [CO2] is instantaneous. That's just silly (does the water in a pan instantaneously come to a new high temperature immediately you turn on the heat?). So the "fits" of curves to empirical temperature measures on that odd web page must be wrong. One can only fit the data with some knowledge of the earth response times for temperature changes resulting from enhanced forcings. These aren't easy to define, but it's likely that the slow response times due to the massive thermal inertia of the oceans means that 90% of the temperature response to enhanced [CO2] takes many decades at least. (c) Minor, but not less important, fallacies include the pretence that [CO2] is the only influence on earth surface temperature. It's very well established that man made aerosolic pollutants that reflect/scatter solar radiation back to space, are countering the warming effect of enhanced greenhouse gases. If one is trying to fit the earth temperature response to enhanced [CO2], one has to consider the other influences on earth temperature. (d) A generalized fallacy is the pretence that a relatively, but not that (!), complex system can be pared down to a level of over-simplicity such that all realistic relationship to the real world is lost...
    0 0
  47. I am looking for and I am having trouble finding a reasonable explanation for why during the onset of a glaciation sparked by milankovitch solar forcing declines that CO2 drops. I find quite a bit concerning the termination of glaciations and the lag of CO2 and I can get my head around that, but the CO2 drawdown is a bit more murky. Is it simply that you can dissolve more CO2 in the cooler water setup by the reduced solar input? This in turn further pushing the feedback loop towards further glaciation and greater CO2 uptake by the oceans? Perhaps my search is flawed, but I am not finding any peer reviewed articles that address this, any help would be much appreciated.
    0 0
  48. jisabi, read the part of the post after fig.2, it describes the mechanism of glacial termination with several links to relevant papers. In particular i'd suggest Caillon 2003.
    0 0
  49. Thanks Riccardo, I appreciate your help. I understand the mechanisms for glacial termination, but was more curious about glacial onset and CO2 drawdown. From reading a bit further I have come to sort of an understanding (reading principles of paleoclimatology by Thomas Cronin). It seems that CO2 drawdown followed diminished solar forcing for several reasons. 1.) Increased bio-productivity as ocean currents changed 2.) Increased bio-productivity through increased upwelling 3.) Fertilization of oceans from continental dust (mainly Fe), again leading to increased bio-productivity 4.) As well as increased solubility of CO2 in water at cooled temps. I was curious, because the correlation of temp and CO2 are obvious, but I was having a hard time finding a credible answer as to why cooler temps seem to drawdown CO2, I hope I have my head around it somewhat. Thanks again for your help. If I am off base, please let me know what you think. Reading Caillon was helpful for my overall knowledge of the subject.
    0 0
  50. In 2008, the Antarctic ice core record was extended back to 800,000 years ago using the bottom 200 m of the EPICA Dome C ice core. It shows a similar relationship between CO2 and temperature as the Vostok record does.
    0 0

1  2  Next

You need to be logged in to post a comment. Login via the left margin or if you're new, register here.


The Consensus Project Website

THE ESCALATOR

(free to republish)


© Copyright 2025 John Cook
Home | Translations | About Us | Privacy | Contact Us