Comparing 1940s Arctic to today
What the science says...
Monckton appears to have cherry-picked temperature data from a few stations. The full data for latitudes 64-90°N reveal the Arctic is warmer today than in 1940.
Climate Myth...
Arctic was warmer in 1940
"Temperatures in the Arctic and in Greenland were warmer by up to 3 Fahrenheit degrees in the late 1930s and early 1940s than they are at present" (Christopher Monckton)
A common misconception that is found to exist within the blogosphere is that the Arctic (hereby defined at 64 to 90 °N) was warmer than present during the early-to-mid 20th century. In particular this claim has been supported by anecdotal evidence of reduced sea ice cover and pronounced warming at *some* Arctic stations at that time. Monckton provides no evidence that he conducted an Arctic-wide analysis of air temperatures but rather seems to suggest that he selected a few stations which supported his narrative rather than examining all of the evidence. As real scientists tend to be very skeptical beasts, it is important that we assess his claim for quality to ensure that it is not based solely on a cherry-pick.
So what do the results show?

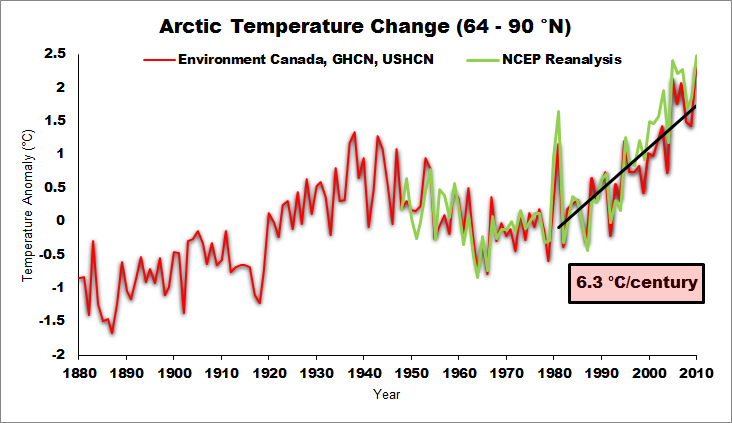
Figure 1: Temperature Anomalies (1951-1981 Baseline) for the Arctic region (64-90°N) over the past 130 years according to ccc-gistemp analysis and NCEP reanalysis.
It is evident based upon Figure 1 that the late 20th to early 21st century warming in the Arctic far exceeds the warming experienced during the 1930s and 1940s. This is supported by calculating a 10-year running means which shows that the 10-year period from 2001 to 2010 was 0.79°C warmer than the warmest 10-year period during the early-to-mid 20th century. Monckton's claim of that period being 1°C greater than the current warming is therefore proven to be incorrect. It should also be noted that the warming over the last 30 years (1981-2010) shows an extraordinarily fast rate of warming (6.3°C/century) using ccc-gistemp.
Another way of looking at the data
What about when we order the anomalies by year?

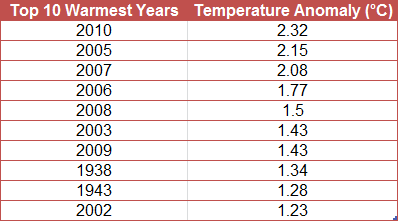
Table 1: Top 10 Warmest Years in the Arctic according to ccc-gistemp analysis.
As is readily apparent, the Arctic was NOT warmer than it is currently and in fact 2010 was the warmest year the Arctic has experienced since instrumental records began. Out of the top 10 warmest years only 2 years predate the 2000s. This post should provide a definitive answer as to whether the warming of the early century was greater in the Arctic than currently. The answer is a resounding no.
As a side note, temperature reconstructions for the Arctic are now for the most part widely accessible and I was able to run this one in 20 minutes. There is no practical reason why Monckton selects but a few stations for his analysis and ignores the overwhelming majority of evidence presented here and elsewhere. There are just no excuses.
Last updated on 11 April 2011 by robert way.


 Arguments


I`ll just leave this here to keep things balanced.
https://www.rmets.org/sites/default/files/qjcallender38.pdf
"In reply to Dr. Brooks, the author agreed that the recent rise in arctic temperatures was far too large to be attributed to change of CO he thought that the latter might act as a promotor to start a series of imminent changes in the northern ice conditions. On account of their large rise he had not included the arctic stations in the world temperature curve"
"Dr. C. E. P. BROOKS said that he had no doubt that there had been a real climatic change during the past thirty or forty years. This was shown not only by the rise of temperature at land stations, but also by the decrease in the amount of ice in arctic and probably also in antarctic regions and by the rise of sea telnperatures. This rise of temperature could however be explained, qualitatively if not quantitatively, by changes in the atnmospheric circulation, and in those regions where a change in the circulation would be expected to cause a fall of temperature, there had actually been a fall ; moreover the rise of temperature was about ten tinnes as great in the arctic regions as in middie or low latitudes, and he did not think that a change in the amount of carbon dioxide could cause such a differential effect. "
To get the true information, we as a reader should check the evidence of those analysis and compare the information in the different sources. Sometimes the headline of the article is very interesting but it isn’t true and sometimes the author hides some part of the information so the article is true only in 1 aspect. We have to aware of these false data!
Hello Napin, welcome to Skeptical Science! Your question is an interesting and important one because what we choose to do as a society depends on our understanding of the problem we’re facing. If we don’t understand the problem properly we might make decisions that fail to address it. So how can we make sure the information we’re given is correct?
One of the first steps we can take is to check the source of the information. In the case of the claim that Arctic temperatures were warmer in the 1940s, the author is Christopher Monckton and his article was published on the Science and Public Policy Institute (SPPI) website. Christopher Monckton is not a climate scientist and the SPPI is not a scientific publication. This doesn’t necessarily mean that the information is incorrect but it does mean we have to evaluate his claims carefully. If we look at his graphs on Arctic warming we notice a few things. First, there is no reference given for the graphs so it’s not possible to check whether they’re reliable. Without access to the data so that we can produce our own graph, we can’t say that this graph is accurate.
In the case of the second graph, it seems that Monckton is only looking a small selection of weather stations. It’s hard to tell because he hasn’t provided a reference to the data in question. As Robert writes in his article, Monckton doesn’t seem to an analysis that covers the whole of the Arctic. In other words, Monckton has cherry-picked a few weather stations that support his argument rather than looking at all the evidence. In the case of the third graph Monckton once again fails to provide a reference so we face the same problem as with the two other graphs. Also the graph ends just after the year 2000 so it misses out a lot of the recent warming.
So I think we have good grounds to question Monckton’s claims at this point, especially as no scientific institution agrees with him. But more broadly there are things we can do to protect ourselves against misinformation. This is important because it can help us assess the validity of all claims made about a scientific topic. Skeptical Science has produced an online course which highlights the ways in which misleading arguments are constructed. Once we understand what to look for it becomes easier to spot misinformation. For instance, Monckton implies that since Arctic temperatures have changed naturally in the past, then current warming must also be natural and we don’t need to worry about CO2 emissions. This is not a scientific position. Climate has changed in past because of a number of factors - variations in solar activity, the Earth’s orbit around the sun, volcanic activity, changes in atmospheric composition, including CO2 levels, etc. We can only understand current and future climate change by looking at what’s happening now. Past climate change can help us make predictions about what will happen in the future, but it tells us nothing about the causes of current change.
If you’d like to learn more about the various ways misleading information is used, you might be interested in our online course, which can be found here. Week 1 and Week 6 are particularly useful. Also John Cook and some fellow scientists have published a recent handbook in which you might find useful information. I hope I have answered your question and if there's anything else I can help you with, please let me know.