Climate Science Glossary

Term Lookup

Enter a term in the search box to find its definition.

Settings

Use the controls in the far right panel to increase or decrease the number of terms automatically displayed (or to completely turn that feature off).

Term Lookup

Settings


All IPCC definitions taken from Climate Change 2007: The Physical Science Basis. Working Group I Contribution to the Fourth Assessment Report of the Intergovernmental Panel on Climate Change, Annex I, Glossary, pp. 941-954. Cambridge University Press.

Home Arguments Software Resources Comments The Consensus Project Translations About Support

Bluesky Facebook LinkedIn Mastodon MeWe

Twitter YouTube RSS Posts RSS Comments Email Subscribe


Climate's changed before
It's the sun
It's not bad
There is no consensus
It's cooling
Models are unreliable
Temp record is unreliable
Animals and plants can adapt
It hasn't warmed since 1998
Antarctica is gaining ice
View All Arguments...


Username
Password
New? Register here
Forgot your password?

Latest Posts

Archives

How do we know more CO2 is causing warming?

What the science says...

Select a level... Basic Intermediate Advanced

An enhanced greenhouse effect from CO2 has been confirmed by multiple lines of empirical evidence.

Climate Myth...

Increasing CO2 has little to no effect

"While major green house gas H2O substantially warms the Earth, minor green house gases such as CO2 have little effect.... The 6-fold increase in hydrocarbon use since 1940 has had no noticeable effect on atmospheric temperature ... " (Environmental Effects of Increased Atmospheric Carbon Dioxide)

At-a-glance

To make a statement like, "minor greenhouse gases such as CO2 have little effect", is to ignore 160 years of science history. So let's look at who figured out the heat-trapping properties of carbon dioxide and when.

Experiments involving various gas mixtures had demonstrated the heat-trapping properties of water vapour, CO2 and methane in the 1850s. But those effects were yet to be quantified - there were no meaningful numbers. It was to be another 40 years before that happened.

Swedish scientist Svante Arrhenius (1859-1927) was the person who crunched the numbers. The results were presented in a remarkable paper, "On the Influence of Carbonic Acid in the Air upon the Temperature of the Ground", in 1896.

The many calculations in the 1896 paper include estimates of the amounts of CO2 increase or decrease required to drive the climate into a different state. One example used was the Hothouse climate of the Cenozoic, around 50 million years ago. Another was the glaciations of the last few hundred millennia.

To get a temperature rise of 8-9°C in the Arctic, Arrhenius calculated that CO2 levels would have to increase by 2.5 to 3 times 1890s levels. To lower the temperature 4–5°C to return to glacial conditions, he calculated a drop in CO2 was needed of 0.62-0.55 times 1890s levels.

We know CO2 levels in the 1890s from ice-core data. They were around 295 ppm. Let's do the sums. A reduction factor of 0.55 to 0.62 on 295 ppm gives 162.2-183.9 ppm. Modern ice-core measurements representing the past 800,000 years show that in glacial periods, CO2 levels fell to 170-180 ppm.

What we now know due to additional research since 1896 when Arrhenius worked on this, is that CO2 was an essential 'amplifying feedback'. That means changes triggered by long term, cyclic variations in Earth's orbit cause warming or cooling and CO2 release or entrapment in turn. Those changes in CO2 levels affected the strength of Earth's greenhouse effect. Changes in the strength of the greenhouse effect then completed the job of pushing conditions from interglacial to glacial - or vice-versa.

Arrhenius also made an important point regarding water vapour: "From observations made during balloon voyages, we know also that the distribution of the aqueous vapour may be very irregular, and different from the ideal mean distribution." This statement holds true today: water vapour is a greenhouse gas but because water exists in gas, liquid and solid forms in the atmosphere, it is continually cycling in and out of the air. It is distributed in a highly uneven fashion and is uncommon in the upper atmosphere. That's where it differs from CO2.

Once CO2 is up there, it's up there for a long time. As a consequence it has a pretty even distribution: 'well-mixed' is the term. As Arrhenius quantified all that time ago, once it's up there it constantly absorbs and re-radiates heat in all directions. That's why dumping 44 billion tons of it into our atmosphere in just one year (2019 - IPCC Sixth Assessment Report 2022) is a really bad idea.

Please use this form to provide feedback about this new "At a glance" section. Read a more technical version below or dig deeper via the tabs above!


Further details

Good scientific theories are said to have ‘predictive power’. In other words, armed only with a theory, we should be able to make predictions about a subject. If the theory’s any good, the predictions will come true.

Here’s an example: when the Periodic Table of the chemical elements was proposed in 1869, many elements were yet to be discovered. Using the theory behind the Periodic Table, the Russian chemist Dmitri Mendeleev was able to predict the properties of germanium, gallium and scandium prior to their discovery in 1886, 1875 and 1879 respectively. His predictions were found to be correct.

The effect on Earth's greenhouse effect of adding man-made CO2 is predicted in the theory of greenhouse gases. This theory was first proposed by Swedish scientist Svante Arrhenius in 1896, based on earlier work by Fourier, Foote and Tyndall. Many scientists have refined the theory since Arrhenius published his work in 1896. Nearly all have reached the same conclusion: if we increase the amount of greenhouse gases in the atmosphere, the Earth will warm up.

Where there is less agreement is with respect to the exact amount of warming. This issue is called 'climate sensitivity', the amount the temperatures will increase if CO2 is doubled from pre-industrial levels. Climate models have predicted the least temperature rise would be on average 1.65°C (2.97°F) , but upper estimates vary a lot, averaging 5.2°C (9.36°F). Current best estimates are for a rise of around 3°C (5.4°F), with a likely maximum of 4.5°C (8.1°F). A key reason for this range of outcomes is because of the large number of potential climate feedbacks and their variable interactions with one another. Put simply, some are much better understood than others.

What Goes Down…

The greenhouse effect works like this: Energy arrives from the sun in the form of visible light and ultraviolet radiation. The Earth then emits some of this energy as infrared radiation. Greenhouse gases in the atmosphere 'capture' some of this heat, then re-emit it in all directions - including back to the Earth's surface.

Through this process, CO2 and other greenhouse gases keep the Earth’s surface 33°Celsius (59.4°F) warmer than it would be without them. We have added 42% more CO2, and temperatures have gone up. There should be some evidence that links CO2 to the temperature rise.

So far, the average global temperature has gone up by more than 1 degrees C (1.9°F):

"According to an ongoing temperature analysis led by scientists at NASA’s Goddard Institute for Space Studies (GISS), the average global temperature on Earth has increased by at least 1.1° Celsius (1.9° Fahrenheit) since 1880. The majority of the warming has occurred since 1975, at a rate of roughly 0.15 to 0.20°C per decade."

The temperatures are going up, just like the theory predicted. But where’s the connection with CO2, or other greenhouse gases like methane, ozone or nitrous oxide?

The connection can be found in the spectrum of greenhouse radiation. Using high-resolution FTIR spectroscopy, we can measure the exact wavelengths of long-wave (infrared) radiation reaching the ground.
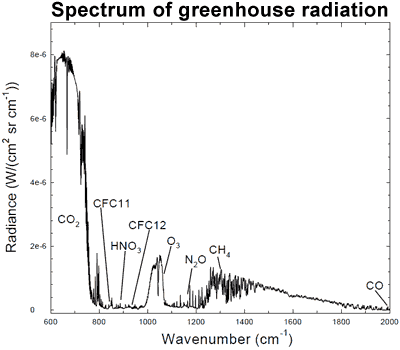
Greenhouse spectrum

Figure 1: Spectrum of the greenhouse radiation measured at the surface. Greenhouse effect from water vapour is filtered out, showing the contributions of other greenhouse gases (Evans 2006).

Sure enough, we can see that CO2 is adding considerable warming, along with ozone (O3) and methane (CH4). This is called surface radiative forcing, and the measurements are part of the empirical evidence that CO2 is causing the warming.

...Must Go Up

How long has CO2 been contributing to increased warming? According to NASA, “Two-thirds of the warming has occurred since 1975”. Is there a reliable way to identify CO2’s influence on temperatures over that period?

There is: we can measure the wavelengths of long-wave radiation leaving the Earth (upward radiation). Satellites have recorded the Earth's outgoing radiation. We can examine the spectrum of upward long-wave radiation in 1970 and 1997 to see if there are changes.
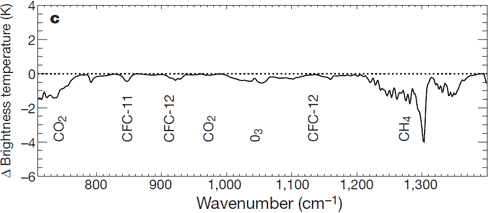
Change in outgoing radiation

Figure 2: Change in spectrum from 1970 to 1996 due to trace gases. 'Brightness temperature' indicates equivalent blackbody temperature (Harries et al. 2001).

This time, we see that during the period when temperatures increased the most, emissions of upward radiation have decreased through radiative trapping at exactly the same wavenumbers as they increased for downward radiation. The same greenhouse gases are identified: CO2, methane, ozone and so on.

The Empirical Evidence

As temperatures started to rise, scientists became more and more interested in the cause. Many theories were proposed. All save one have fallen by the wayside, discarded for lack of evidence. One theory alone has stood the test of time, strengthened by experiments.

We have known CO2 absorbs and re-emits longwave radiation, since the days of Foote, Tyndall and Arrhenius in the 19th Century. The theory of greenhouse gases predicts that if we increase the proportion of greenhouse gases, more warming will occur.

Scientists have measured the influence of CO2 on both incoming solar energy and outgoing long-wave radiation. Less longwave radiation is escaping to space at the specific wavelengths of greenhouse gases. Increased longwave radiation is measured at the surface of the Earth at the same wavelengths.

Last updated on 16 July 2023 by John Mason. View Archives

Printable Version  |  Offline PDF Version  |  Link to this page

Argument Feedback

Please use this form to let us know about suggested updates to this rebuttal.

Further reading

A good summation of the physics of radiative forcing can be found in V. Ramanathan's Trace-Gas Greenhouse Effect and Global Warming.

Denial101x video

Comments

Prev  1  2  3  4  5  Next

Comments 51 to 75 out of 121:

  1. thepoodlebites wrote : "When you get a chance, can you please point me to RC’s regularly updated model-data comparisons?" You obviously have some ulterior motive for asking that because a few seconds of searching found this, up to the end of 2010 : Real Climate 2010 updates to model-data comparisons Were you looking for something else ?
  2. #50 belay my last: too many nots, sorry. My guess is that the model temperature predictions based on CO2 rise alone will not match the observed temperature record since 2000. If that is the case then the radiative forcing components that Meehl used in 2004 were not accurate and that forcing from natural climate variability has not been properly accounted for. Or to put it another way, the temperature record for the last decade can not be reproduced in the model with anthropogenic forcing alone.
  3. #51 KMurphy Ulterior motives? Surely you're joking Mr. KMurphy. Justed wanted to access precisely what scaddenp referenced, so there would be no misunderstandings. I'm now visiting the website now, for the first time. Wow, what big error bars you have, +-0.4C.
  4. #53 Make that JMurphy, not KMurphy. A typo and a copy typo, nothing more. No conspiracy or hidden agenda, just the facts please.
  5. thepoodlebites, how do the error bars affect that black line you can see in the first graph, which is labelled 'IPCC Ensemble', and around which the actual temperature records are congregating ?
  6. "So the statement “model parameters can be adjusted to match any set of temperature observations" is not true? " Of course not. Even a brief look at papers on model parameterisation, or a look at the FAQ at realclimate would show that model parameters are not "fitted" to temperature. This is a common denialist assertion repeated without a shred of supporting evidence. If you are going to repeat it, then I do not think it unreasonable to ask for a paper showing a model parameter that was tuned to global temperature. I would also suggest looking at RC post on what IPCC models really say. You might also consider how successful Wally Broecker was at forecasting 2010 temperature in 1975, using results from a model so primitive that it didnt have parameterizations.
  7. "What big error bars you have". Yep, climate models are for forecasting climate. They are no good at shorter scales because the climate system has a lot of internal variability. They are good for 30 year trends, not next years temperature. I think this discussion belongs in models are unreliable.
  8. #56,57 scaddenp The model simulations use observed forcings up until 2000 (or 2003 in a couple of cases). This sounds like adjusting model parameters to match observations. How do the observed forcings differ from modeled forcings and how do these modeled forcings compare to Meehl’s 2004 runs? What are the observed forcings and how are these forcings measured? The modeled trend is about +0.2C per decade, which fits scenario C the best. But scenario C assumed no further emissions after 2000. Why the discrepancy? Scenario B predicted +0.27C per decade. What are the forecasts for 2020, 2050, 2100? From what I read, separating climate sensitivity to CO2 from natural climate variability is still a work in progress, especially considering the observed temperature record over the last decade. How can you say with confidence that most of the warming over the last 30 years is from CO2 rise when it seems that ENSO/PDO/AMO/AO (and solar) are playing a much more significant role in changes in global surface temperatures?
  9. Okay, some major confusion here and time for me to apologize. Parameterization is models usually refers ultimately to parts of the model where empirically determined relationships are used instead calculation directly from physics. Its a denialist meme that you can "tune" these to a desired result which is bunk. I now see that this is not what you meant. Observed forcing are just that - observed. They are the measured inputs to the model. In a really crude form a model is Output(eg temperature) = F(input) where F is the model. Input is climate state plus forcing. A forcing isnt modelled, but the measurement obviously has error bars too like any other. So forcing are: GHG, Albedo, TSI, and aerosols. GHG forcing is determined from atmospheric measurement. Confirmation of radiative change comes from both satellite and ground stations. Albedo, TSI are measured by satellite; aerosols are more complex involving sampling, satellite and ground observations. Uncertainties increase as you go back in time. For the model run, changes in albedo attributed to landuse change, change in GHG, and change in non-volcanic aerosols are anthro. Its important to realise that these are no free variables that the modellers can change at well to fit a result. The numbers are published by the relevant observing network. Meehl does not adjust model parameters to match observations. As to scenario C versus scenario B, its done to death in Hansen's 1988 prediction thread. In short, the 1988 model used by Hansen (also very primitive) had sensitivity of 4, while more recent research (IPCC models) estimate it at 3.
  10. Oh you're all going to love this...... already in the presses ready to publish, peer reviewed and from a respected climate scientist too! http://catallaxyfiles.com/2011/08/03/stop-press-climate-talk-on-cable-today/
    Response:

    [DB] Salby is essentially speaking gibberish.  In the past, temps tended to lead CO2 increases, with the notable exceptions of methane peturbations.  How things are different today is that we have injected immense quantities of previously sequestered CO2 back into the carbon cycle, turning CO2 from it's normal feedback into a forcing.

    Salby has been discussed to some degree already on RC, Open Mind and internally here at SkS. 

    There are no credible physics to support his assertions.  As a further note, his reputation within the community is less than you make it out to be.

  11. Dale - the paper is yet to be published, but I've listened to a talk which Salby gave at the Sydney Institute earlier this week - it doesn't look good for him. He seems to have it in his head that annual CO2 emissions (that is the natural flux of CO2 in and out of biological reservoirs like forests and the oceans, plus human emissions, should follow human CO2 emission trends on a year-to-year basis. He doesn't explain why he thinks that, but he's wrong anyway - El Nino/La Nina and droughts in the Amazon for instance, can drive large swings in the flux of CO2 in and out of natural systems. Human CO2 simply adds to the pool size which natural systems can draw from. The rest of his argument stems from that basic misunderstanding of the carbon cycle. Maybe he should have stuck with atmospheric physics?
  12. What do you think of Salby's work, Dale? Do you accept it, and can you defend it? Remember, you're asking people here to defend AGW. If you're curious about Salby's work and want to know more--arguments for and against--then you shouldn't present the work as if it's the Holy Sword of Scientific Truth. If you do, you'll be expected to use that Sword. Perhaps instead you should say something like, "What about this _____ chap who claims ____? He seems legit--he's got lots of titles and such."
  13. DSL@62 So often those Skeptic Silver Bullets turn out to be chrome plated brass. Yet they keep firing them and the AGW monster keeps coming.
  14. Dale, for Salby to be correct, conservation of mass has to be wrong. Now if he can come up with an theory that explains why the conservation of mass should not hold, he might have something that really would make him famous. Otherwise, he should be asking, "what could I be doing wrong here?" That's what a true skeptic does when he evaluates all the evidence. Instead, Salby simply ignores one of the most fundamental and easily understood tenets of physics as we experience it here on earth. What is depressing is that Judith Curry apparently didn't see through this immediately and shepherd her flock away fromthe road. It's also depressing (and telling) that this topic still has any legs at all among the larger community of so called "skeptics."
  15. I do not know what is worse, Salby trying to sell this ridiculous notion, or people like Curry uncritically egging him on. It is clear from the Climate Etc. thread that Curry does not know what is going on. And Salby has not published a single paper on the carbon cycle that I am aware of. Really this is just smoke and mirrors and people like Dale lap it up to reinforce their denial. For example, one of the commentators to that advertisement for his talk (50% of which was about him, not the subject he is trying to speaking to) states: "But I thought the science was settled??" Now there is a true "skeptic, not. His mission has been accomplished before the paper has even made it though peer review. This is very, very likely just another Trojan paper to make people think "the science isn't settled so we don;t have to do anything". PS: "Skeptics" claim that temperatures have not warmed since November 1996, if Salby's hypothesis is correct then why have CO2 levels continue to rise, perhaps even accelerate since then?
  16. How about we listen to what an expert, a real climate scientist, has to say: Comment from Gavin Schmidt at RealClimate: This has nothing whatsoever to do with attribution of the temperature rise. The response of the CC to temperature is a specific thing - and it doesn't matter if it is originally driven by Milankovitch and ice sheets (over the ice age cycle), solar and volcanic activity over the pre-industrial, or by human activity/martian fairies/the PDO or whatever today. ENSO is an internal source of temperature changes on short time scales, and Pinatubo is an external source of temperature change over a short time period - both are included in any modern period regression such as Salby must have used. And the sensitivity of the carbon cycle to such changes is noticeable, but small and nothing like enough to explain the 20th C change. But even without thinking about this that deeply at all, it is obvious that Salby is wrong - we have put more than twice as much CO2 into the air as has actually accumulated over the last 100 years. To posit that the rise is not anthropogenic implies finding sinks that have totally taken up the anthropogenic CO2 *and* new sources that have put half of it back again. Meanwhile, all the actual reservoirs have more carbon than they had previously. Furthermore, the 13C and 14C data (up until the bomb peak) support a predominantly fossil fuel source. And the O2/N2 levels are dropping at the rate expected (given that we are burning C, and taking O2 from the air). The idea that a poorly performed regression undermines all this is ludicrous. - gavin"
  17. from jcurry's commentary: "huge increases in carbon dioxide concentrations caused by such things as spells of warming and El Ninos, which cause concentration levels to increase independently of human emissions." I wonder how these 'spells of warming' manage to both increase and decrease CO2 in sync with human economic activity, even down to as fine a scale as the day/night differences associated with weekday traffic (also here). And I can only marvel at how these 'warming spells' know to take the weekends off. Spells? Sounds a bit like witchcraft to me.
  18. Stephen, It is not an issue of conservation of mass. Atmospheric CO2 is part of a complex equilibrium system. The CO2 that we are emitting does not remain in the atmosphere, but reacts according to the many natural chemical equations on this planet. If the amount we were adding was insignificant, then the environmental equations involving CO2 would use up the excess CO2 and form more products, keeping the atmospheric concentration relatively constant. Salby's own numbers indicate that nature is only using 45% of the excess CO2, with 55% remaining in the atmosphere. His assertion that CO2 is simply reacting to increasing temperatures would be more believable if it followed the recent temperature profile. However, temperatures have oscillated significantly during the past 130 years, while CO2 emissions have consistently increased.
    Response: [Dikran Marsupial] Atmospheric CO2 is part of a complex equilibrium system, however it is a closed system and so must obey conservation of mass. Becuase of conservation of mass, the fact that annual rise in atmospheric CO2 being always smaller than anthropogenic emissions establishes beyond reasonable doubt that the natural environment is a net carbon sink and hence is opposing the rise in atmospheric concentrations, not causing it. Unless Salby et al can refute that argument, the paper shouldn't pass review.
  19. Muoncounter @67 and EtR @68, You know, Judith should really just step away form her keyboard-- she is continuing to make an utter fool of herself. These "huge increases in CO2 concentrations" that Curry is so excited about are a) transient and b> < 2 ppmv.
  20. "Spells? Sounds a bit like witchcraft to me." Or a touch of the vapors.
  21. John N-G just posted this over at RC on Salby:
    "I was lucky enough to attend Murray Salby’s talk at the IUGG conference in Melbourne. The thesis is not quite so simple as a correlation between CO2 rise and short-term temperature variations, because he found corroborating evidence in the change of CO2 slope over time. This made the argument not so easy to dismiss out of hand, although Salby was extremely careful not to draw any conclusions in his public presentation. It was quite good sport to play “spot the flaw” in real time. Fortunately, the talk was the last of the session, and both Alan Plumb and myself chatted with him right afterwards. Aside from whether a statistical argument makes physical sense, it also must hold water statistically by being applicable beyond the time frame of model development. In discussing what his model would mean for past variations of temperature and CO2, it eventually became clear that he believed all paleoclimate data that supported his statistical analysis and disregarded all paleoclimate data that countered his statistical analysis, even though the latter collection was much larger than the former. Eventually I realized that if 0.8 C of warming is sufficient to produce an increase of 120ppb CO2, as Salby asserted, then the converse would also have to be true. During the last glacial maximum, when global temperatures were indisputably several degrees cooler than today, the atmospheric CO2 concentration must have been negative. That was enough for me."
    [Emphasis added] Good enough for me, too.
  22. It's kind of astonishing that anyone with even a rudimentary understanding of basic climate science - let alone a climate scientist like Curry - wouldn't immediately see the many obvious flaws in Salby's argument (let alone advertising his talk as some sort of major revelation).
  23. Mods, I can't defend myself now?
    Response:

    There are threads to discuss denialism vs skepticism, but this thread is not one.  If that is your wish, then please use the Search function to find one & place those comments there.

  24. Dale#73: Defend your ideas; on this thread, the topic is CO2 causing warming. Other topics = other threads.
  25. okay, 1) water vapor has a much broader absorption in more regions than any of the GHGs addressed here; it cannot be ignored!!!! H2O covers 70% of the Earth's surface (plus a lot of it in the vapor phase as well), it therefore is hit by most of the incoming solar radiation (uv or high-energy) - the H2O absorbs uv and emits it as IR, this is undeniable. therefore, the radiative energies coming from the H2O are well outside of the 298K band. so the water on the surface and in the ATM has a massive effect on the temperature. this cannot be ignored in a "model" - the biggest part of the system must be included in the model. 2) what about the interaction of the Earth's and Sun's magnetic fields (solar wind)? this effects the temperature as well. maybe we should be more worried about the things we cannot change than the ones we can. we cannot accurately study a system so dynamic and not completely understood, and ignore the major contributors to an effect while having a limited amount of sample data. we need temperature date from 1000 times more points to make a valid conclusion toward surface warming. the Earth is larger and more dynamic than the model(s) account for.

Prev  1  2  3  4  5  Next

Post a Comment

Political, off-topic or ad hominem comments will be deleted. Comments Policy...

You need to be logged in to post a comment. Login via the left margin or if you're new, register here.

Link to this page


The Consensus Project Website

THE ESCALATOR

(free to republish)


© Copyright 2024 John Cook
Home | Translations | About Us | Privacy | Contact Us