Climate Science Glossary

Term Lookup

Enter a term in the search box to find its definition.

Settings

Use the controls in the far right panel to increase or decrease the number of terms automatically displayed (or to completely turn that feature off).

Term Lookup

Settings


All IPCC definitions taken from Climate Change 2007: The Physical Science Basis. Working Group I Contribution to the Fourth Assessment Report of the Intergovernmental Panel on Climate Change, Annex I, Glossary, pp. 941-954. Cambridge University Press.

Home Arguments Software Resources Comments The Consensus Project Translations About Support

Bluesky Facebook LinkedIn Mastodon MeWe

Twitter YouTube RSS Posts RSS Comments Email Subscribe


Climate's changed before
It's the sun
It's not bad
There is no consensus
It's cooling
Models are unreliable
Temp record is unreliable
Animals and plants can adapt
It hasn't warmed since 1998
Antarctica is gaining ice
View All Arguments...


Username
Password
New? Register here
Forgot your password?

Latest Posts

Archives

How reliable are climate models?

What the science says...

Select a level... Basic Intermediate

Models successfully reproduce temperatures since 1900 globally, by land, in the air and the ocean.

Climate Myth...

Models are unreliable

"[Models] are full of fudge factors that are fitted to the existing climate, so the models more or less agree with the observed data. But there is no reason to believe that the same fudge factors would give the right behaviour in a world with different chemistry, for example in a world with increased CO2 in the atmosphere."  (Freeman Dyson)

At a glance

So, what are computer models? Computer modelling is the simulation and study of complex physical systems using mathematics and computer science. Models can be used to explore the effects of changes to any or all of the system components. Such techniques have a wide range of applications. For example, engineering makes a lot of use of computer models, from aircraft design to dam construction and everything in between. Many aspects of our modern lives depend, one way and another, on computer modelling. If you don't trust computer models but like flying, you might want to think about that.

Computer models can be as simple or as complicated as required. It depends on what part of a system you're looking at and its complexity. A simple model might consist of a few equations on a spreadsheet. Complex models, on the other hand, can run to millions of lines of code. Designing them involves intensive collaboration between multiple specialist scientists, mathematicians and top-end coders working as a team.

Modelling of the planet's climate system dates back to the late 1960s. Climate modelling involves incorporating all the equations that describe the interactions between all the components of our climate system. Climate modelling is especially maths-heavy, requiring phenomenal computer power to run vast numbers of equations at the same time.

Climate models are designed to estimate trends rather than events. For example, a fairly simple climate model can readily tell you it will be colder in winter. However, it can’t tell you what the temperature will be on a specific day – that’s weather forecasting. Weather forecast-models rarely extend to even a fortnight ahead. Big difference. Climate trends deal with things such as temperature or sea-level changes, over multiple decades. Trends are important because they eliminate or 'smooth out' single events that may be extreme but uncommon. In other words, trends tell you which way the system's heading.

All climate models must be tested to find out if they work before they are deployed. That can be done by using the past. We know what happened back then either because we made observations or since evidence is preserved in the geological record. If a model can correctly simulate trends from a starting point somewhere in the past through to the present day, it has passed that test. We can therefore expect it to simulate what might happen in the future. And that's exactly what has happened. From early on, climate models predicted future global warming. Multiple lines of hard physical evidence now confirm the prediction was correct.

Finally, all models, weather or climate, have uncertainties associated with them. This doesn't mean scientists don't know anything - far from it. If you work in science, uncertainty is an everyday word and is to be expected. Sources of uncertainty can be identified, isolated and worked upon. As a consequence, a model's performance improves. In this way, science is a self-correcting process over time. This is quite different from climate science denial, whose practitioners speak confidently and with certainty about something they do not work on day in and day out. They don't need to fully understand the topic, since spreading confusion and doubt is their task.

Climate models are not perfect. Nothing is. But they are phenomenally useful.

Please use this form to provide feedback about this new "At a glance" section. Read a more technical version below or dig deeper via the tabs above!


Further details

Climate models are mathematical representations of the interactions between the atmosphere, oceans, land surface, ice – and the sun. This is clearly a very complex task, so models are built to estimate trends rather than events. For example, a climate model can tell you it will be cold in winter, but it can’t tell you what the temperature will be on a specific day – that’s weather forecasting. Climate trends are weather, averaged out over time - usually 30 years. Trends are important because they eliminate - or "smooth out" - single events that may be extreme, but quite rare.

Climate models have to be tested to find out if they work. We can’t wait for 30 years to see if a model is any good or not; models are tested against the past, against what we know happened. If a model can correctly predict trends from a starting point somewhere in the past, we could expect it to predict with reasonable certainty what might happen in the future.

So all models are first tested in a process called Hindcasting. The models used to predict future global warming can accurately map past climate changes. If they get the past right, there is no reason to think their predictions would be wrong. Testing models against the existing instrumental record suggested CO2 must cause global warming, because the models could not simulate what had already happened unless the extra CO2 was added to the model. All other known forcings are adequate in explaining temperature variations prior to the rise in temperature over the last thirty years, while none of them are capable of explaining the rise in the past thirty years.  CO2 does explain that rise, and explains it completely without any need for additional, as yet unknown forcings.

Where models have been running for sufficient time, they have also been shown to make accurate predictions. For example, the eruption of Mt. Pinatubo allowed modellers to test the accuracy of models by feeding in the data about the eruption. The models successfully predicted the climatic response after the eruption. Models also correctly predicted other effects subsequently confirmed by observation, including greater warming in the Arctic and over land, greater warming at night, and stratospheric cooling.

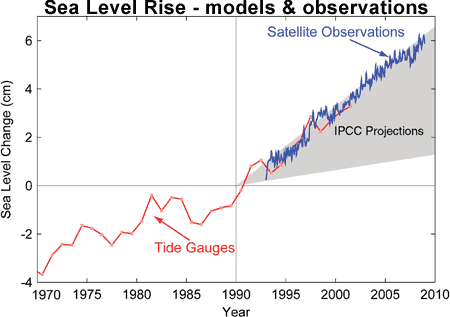
The climate models, far from being melodramatic, may be conservative in the predictions they produce. Sea level rise is a good example (fig. 1).

Fig. 1: Observed sea level rise since 1970 from tide gauge data (red) and satellite measurements (blue) compared to model projections for 1990-2010 from the IPCC Third Assessment Report (grey band).  (Source: The Copenhagen Diagnosis, 2009)

Here, the models have understated the problem. In reality, observed sea level is tracking at the upper range of the model projections. There are other examples of models being too conservative, rather than alarmist as some portray them. All models have limits - uncertainties - for they are modelling complex systems. However, all models improve over time, and with increasing sources of real-world information such as satellites, the output of climate models can be constantly refined to increase their power and usefulness.

Climate models have already predicted many of the phenomena for which we now have empirical evidence. A 2019 study led by Zeke Hausfather (Hausfather et al. 2019) evaluated 17 global surface temperature projections from climate models in studies published between 1970 and 2007.  The authors found "14 out of the 17 model projections indistinguishable from what actually occurred."

Talking of empirical evidence, you may be surprised to know that huge fossil fuels corporation Exxon's own scientists knew all about climate change, all along. A recent study of their own modelling (Supran et al. 2023 - open access) found it to be just as skillful as that developed within academia (fig. 2). We had a blog-post about this important study around the time of its publication. However, the way the corporate world's PR machine subsequently handled this information left a great deal to be desired, to put it mildly. The paper's damning final paragraph is worthy of part-quotation:

"Here, it has enabled us to conclude with precision that, decades ago, ExxonMobil understood as much about climate change as did academic and government scientists. Our analysis shows that, in private and academic circles since the late 1970s and early 1980s, ExxonMobil scientists:

(i) accurately projected and skillfully modelled global warming due to fossil fuel burning;

(ii) correctly dismissed the possibility of a coming ice age;

(iii) accurately predicted when human-caused global warming would first be detected;

(iv) reasonably estimated how much CO2 would lead to dangerous warming.

Yet, whereas academic and government scientists worked to communicate what they knew to the public, ExxonMobil worked to deny it."
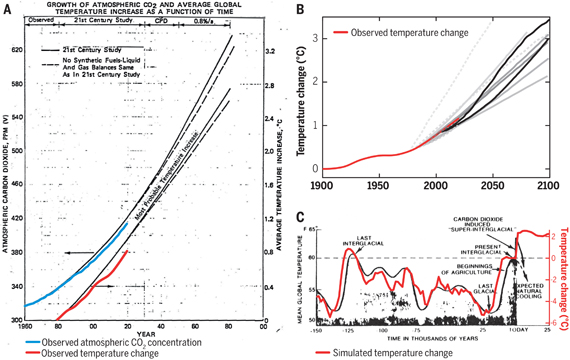

Exxon climate graphics from Supran et al 2023

Fig. 2: Historically observed temperature change (red) and atmospheric carbon dioxide concentration (blue) over time, compared against global warming projections reported by ExxonMobil scientists. (A) “Proprietary” 1982 Exxon-modeled projections. (B) Summary of projections in seven internal company memos and five peer-reviewed publications between 1977 and 2003 (gray lines). (C) A 1977 internally reported graph of the global warming “effect of CO2 on an interglacial scale.” (A) and (B) display averaged historical temperature observations, whereas the historical temperature record in (C) is a smoothed Earth system model simulation of the last 150,000 years. From Supran et al. 2023.

 Updated 30th May 2024 to include Supran et al extract.

Various global temperature projections by mainstream climate scientists and models, and by climate contrarians, compared to observations by NASA GISS. Created by Dana Nuccitelli.

Last updated on 30 May 2024 by John Mason. View Archives

Printable Version  |  Offline PDF Version  |  Link to this page

Argument Feedback

Please use this form to let us know about suggested updates to this rebuttal.

Further reading

Carbon Brief on Models

In January 2018, CarbonBrief published a series about climate models which includes the following articles:

Q&A: How do climate models work?
This indepth article explains in detail how scientists use computers to understand our changing climate.

Timeline: The history of climate modelling
Scroll through 50 key moments in the development of climate models over the last almost 100 years.

In-depth: Scientists discuss how to improve climate models
Carbon Brief asked a range of climate scientists what they think the main priorities are for improving climate models over the coming decade.

Guest post: Why clouds hold the key to better climate models
The never-ending and continuous changing nature of clouds has given rise to beautiful poetry, hours of cloud-spotting fun and decades of challenges to climate modellers as Prof Ellie Highwood explains in this article.

Explainer: What climate models tell us about future rainfall
Much of the public discussion around climate change has focused on how much the Earth will warm over the coming century. But climate change is not limited just to temperature; how precipitation – both rain and snow – changes will also have an impact on the global population.

Update

On 21 January 2012, 'the skeptic argument' was revised to correct for some small formatting errors.

Denial101x videos

Here are related lecture-videos from Denial101x - Making Sense of Climate Science Denial

Additional video from the MOOC

Dana Nuccitelli: Principles that models are built on.

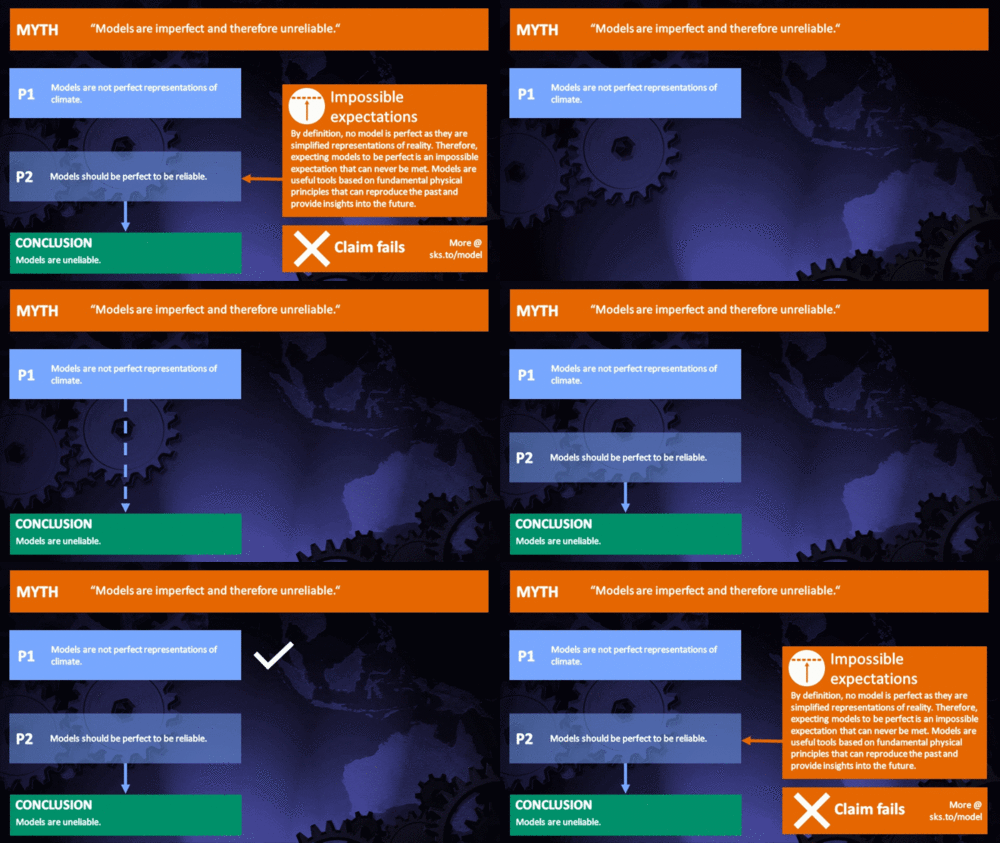
Myth Deconstruction

Related resource: Myth Deconstruction as animated GIF

MD Model

Please check the related blog post for background information about this graphics resource.

Fact brief

Click the thumbnail for the concise fact brief version created in collaboration with Gigafact:

fact brief

Comments

Prev  1  2  3  4  5  6  Next

Comments 51 to 75 out of 144:

  1. We seem to have drifted off point (as presented at 41 and 45). The Middlebury website is offered as a source for graphs of government and other credible data. Your disagreement with that data is with the government and the other sources, not me. The issue confronting humanity today is whether human produced carbon dioxide is causing global warming. The only indicator that it is comes from GCMs and then only when their users impose significant net positive feedback. Without significant net positive feedback, the GCMs do not predict significant Global Warming from increased atmospheric carbon dioxide. The proof that significant net positive feedback and therefore AGW does not exist DOES NOT USE anything from A/S. The proof that significant net positive feedback and therefore AGW does not exist DOES NOT USE anything from the Holocene. (For those interested, http://www.ncasi.org/publications/Detail.aspx?id=3025 , which uses data from many different proxies but excludes tree ring proxy data, is an assessment of the average global temperature for the last 2000 years.) This may be the source that Chris alludes to. It shows that the Medieval Warm Period, which was before the industrial revolution, probably reached higher average global temperatures than now and the steepest recent (around 1990) rate-of-change trend is about the same as it was at 4 other times in the last 800 years. A temperature trend direction change proves that there is no significant net positive feedback. Temperature data have been extracted from ice cores and are reported by NOAA and ORNL. All that is needed to determine if there is net positive feedback is a temperature trace for a long enough time to average out cyclic variation from random noise and other factors. The temperature trace does not even need to be correct in absolute terms just reasonably accurate in relative terms time-wise. This is obvious, even trivial, to me. Apparently the importance of the change in direction of temperature trend is not recognized by those who do not understand how feedback works. The trends used in the example in 51 are each about 5000 yr long and other trends have various lengths. The shortest Milankovich cycle is about 23000 yr. Milankovich can have no significant influence on the direction changes of the trends. Besides, the direction changes go both ways. You state “primary effects (raised CO2 levels) supplemented with feedbacks can be overpowered by other effects (reduced insolation during waning Milankovitch cycles)”. If feedbacks can be overpowered by other effects then ‘other effects’ determine which direction future temperature trends will go and predictions of GCMs are meaningless. Either way, the GCMs are invalidated as temperature predictors. That is pretty much the point.
  2. re #54 Dan Pangurn is wrong again, and compounds his errors with another piece of gross misrepresentation of the science. Since Dan is pursuing these misrepresentations of the science in support of fallacious interpretations, it isn’t really “off-topic” to address them! Dan Pangburn’s nebulous point about “feedbacks” isn’t well-defined (he hasn’t really explained his problem)…we can look at that in a seperate post. Dan makes a weasel defence in his post #53 that my “disagreement is with the data” and not with him. That’s nonsense, of course. The data is fine. Dan has just cherry-picked and misrepresented it horribly. Let’s have a look again: (i) There is a vast wealth of data on millennial scale paleotemperature proxy data (see links/citations at bottom of post). To assess globally averaged paleotemperatures, competent and honest scientists use as many validated paleotemperature records as possible, using as many data points as possible, using a range of different paleotemperature proxies, from as many places on Earth as possible. Dan selected ONE data point from ONE record, from ONE location on Earth, and attempted to pursue the deceit that this indicates that the global temperature was warmer than now 400 years ago. There’s nothing wrong with the dataset. Dan has just grossly misused it by an extraordinary piece of cherry-picking. (ii) There is a wealth of data on the relationship between paleoCO2 and palaeotemperature in the deep past (see citations in my posts #46 and #48 above). These cover vast periods of the entire Phanerozoic and indicate a strong temperature/CO2 coupling throughout the last 500 million years. Dan selected ONE time period in which there is evidence of a cold Earth, and attempted to sell the notion that there is a disconnect between paleotemperature and paleoCO2. Unfortunately, there isn’t a paleotemperature proxy for this period (late Ordovician), and so Dan Pangburn’s interpretation is fallacious. (iii) Dan Pangburn has added to his set of fallacious interpretations with another piece of cherrypicking. There are many studies on paleotemperature variation throughout the last 1000-2000 years (see citations/links at bottom of the post), and these uniformly indicate that current temperatures are well above those of the past 1000 (and up to 2000) years. Dan has selected one study published in a non-science magazine whose editor openly admits to publishing non-science in pursuit of dubious agendas. Let’s look at Loehle’s paper that Dan Pangburn linked to in his post #53: According to Dan “It shows that the Medieval Warm Period, which was before the industrial revolution, probably reached higher average global temperatures than now and the steepest recent (around 1990) rate-of-change trend is about the same as it was at 4 other times in the last 800 years”. Neither of these is true; let’s see why: (a) If anyone has bothered to follow Dan’s link to the Loehle paper in “Energy and Environment”, you can see that the paper comes with a CORRECTION. There are several things that Loehle has had to correct, one of the more blatant ones being a shift in the entire data series back by around 50 years. Loehle’s original data set extended to around 2000; in the correction the data sets extend to around 1950. What’s going on there?? The answer is a bit of incompetence. Since scientists are compiling paleodata all the time, it makes sense to reference these to a common year. So when a paleodata point is dated as 1000 BP, with BP meaning “Before Present”, “Present” does not mean 2008 (or 2009 or 2010 or 2015 and so on), unless specifically indicated. In fact the convention is to use 1950 as the “Present”, so that all data sets are referenced to a common year and can thus be compared by simple juxtaposition. Loehle apparently didn’t realize this! What does this mean for Dan Pangburn’s assertion that Loehle’s “data” shows that the Medieval Warm Period (MWP) was probably globally warmer than now? It means that it’s another fallacious misinterpretation. Since Loehle suggests that the MWP might have been 0.3 oC warmer than 1950, and the globally averaged temperatures are now 0.5-0.6 oC above 1950 temperatures (e.g. NASA GISS temperature data), it’s clearly warmer now than during the MWP, even using Loehle’s decidedly dodgy analysis [see (b) and (c)]. How could Loehle publish such a nonsense? The answer is that Energy and Environment isn’t a science journal. It only pretends to be one. It’s a repository for stuff that supports the weird agenda of its Editor. The papers aren’t peer-reviewed, and so ludicrous errors aren’t picked up. In their defense they have issued a correction to Loehle’s paper. Unfortunately, as in many instances where agenda-led nonsense is subsequently corrected or debunked, the corrections may go un-noticed, and unscrupulous individuals seem happy to ignore them anyway….. Two other quick points: (b) Dan Pangburn talks about rates of temperature change, and suggests that Loehle’s data indicates that current/recent rates of temperature change are not anomalous. He says: “…. and the steepest recent (around 1990) rate-of-change trend is about the same as it was at 4 other times in the last 800 years”. Sadly, Dan has messed up yet again. Remember that Loehle made a silly boo-boo with his timescale. His data only goes up to the year 1950. The “steepest recent (around 1990) rate of change trend..” that Dan refers to is now “around 1940” in Loehle’s corrected data. In fact even using Loehle’s dubious data it’s clear that the rate of temperature increase we’ve seen during the last 30-odd years is very much faster than any time in the last 800 years (see Wikipedia link just below, for example). If one examines the science as opposed to nonsense, the paleotemperature data demonstrate that the late 20th century temperature rise is much faster than anything in the past 1000 years: http://en.wikipedia.org/wiki/Image:1000_Year_Temperature_Comparison.png (or look at the papers cited below). Since Loehle completely omits the last around 60 years of temperature rise from his analysis/presentations, the scale of the large post-1950’s temperature rise that rather dominates the record is completely lost! (c) It’s worth pointing out that apart from Loehle’s rather ludicrous error highlighted above, his data analysis is extremely dodgy. Two things are worth highlighting. For example, much of Loehle’s very limited data sets are extremely sparse in both time and location. A large chunk of the data involves data points averaged over huge time periods (e.g. a time point every 100 years). Clearly while one can “join up the points”, it’s impossible to say anything about rates of temperature change with grossly averaged data. Where spatially widespread data are used (e.g. Viau et al’s N. America composite from pollen analysis) the data actually show rather small temperature variation before the 20th century, not just for the past 1000 years, but during the 7-8000 years before the 20th century (e.g. Viau et al state “Our results show millennial-scale climate variability on the order of +/- 0.2 oC during the entire Holocene at the North American scale”; we’ve had approaching 1 oC of warming over the same region just in the last 30-odd years). One could highlight more of the dreary errors in Loehle’s analysis and Dan’s interpretations. But what’s the point? Surely if we are interested in what the science shows, we address the science published in the scientific literature. We don’t ignore the science and hunt around for dodgy nonsense from dubious sources. --------------------------------------------------Here’s some of the abundant paleotemperature data covering the last 1-2000 years: The published data from multiple sources of published scientific research is compiled by the NOAA and can be found here: http://www.ncdc.noaa.gov/paleo/recons.html Wikipedia has a reasonably good account of this data, and an overlay of many of the paleotemperature proxy data can be found here: http://en.wikipedia.org/wiki/Image:1000_Year_Temperature_Comparison.png recent papers with datasets/analyses that may not be in the Wikipedia compilation are: M. E. Mann et al (2008) “Proxy-based reconstructions of hemispheric and global surface temperature variations over the past two millennia” Proceedings of the Natl. Acad. Sci. USA 105:13252-13257; D'Arrigo RD, Wilson R, Jacoby G (2006) “On the long-term context for 20th century warming.” J Geophys Res 111:D03103. Hegerl GC et al (2007) “Detection of human influence on a new, validated 1500 year temperature reconstruction.” J Clim 20:650–666. Lee TCK, Zwiers FW, Tsao M (2008) “Evaluation of proxy-based millennial reconstruction methods.” Clim Dyn 31:263–281. Viau, AE et al (2006) “Millennial-scale temperature variations in North America during the Holocene” J. Geophys. Res. 111, D09102.
  3. Re #53 Dan Pangburn You are pursuing a very vague point about warming feedbacks, which you assert, in contradiction to the scientific data, don't exist. You haven't explained your argument for this other than to state the likes of (paraphrasing) "look at this ice core data - clearly feedbacks don't exist - it seems obvious, even trivial, to me." But what seems obvious, even trivial, to you, may simply be another example of misunderstanding of the science. It's simply not possible to maintain the deceit that CO2-induced atmospheric warming (or atmospheric warming from any source) doesn't result in a positive feedback from enhanced water vapour concentrations. That's really beyond dispute. So you need to try to explain rather more explicitly why you don't believe in feedbacks. I have a feeling that your particular Engineering background may have confused you over the meaning of "feedback" as applied in Engineering compared to that used in Ocean and Atmospheric Physics. But we won't know that unless you are rather more specific about your problem. Notice, by the way, that GCM's are certainly not "the only indicator that...human produced carbon dioxide is causing global warming". That's a very odd thing to say. The reason that CO2-induced warming is included in GCM's is because the physics of the greenhouse effect is rather well understood. You've rather put the cart before the horse!
  4. New Study Increases Concerns About Climate Model Reliability ScienceDaily (Dec. 12, 2007) — A new study comparing the composite output of 22 leading global climate models with actual climate data finds that the models do an unsatisfactory job of mimicking climate change in key portions of the atmosphere.
  5. A list of all legitimate indicators that human produced carbon dioxide is a substantial contributor to global warming is welcome. The record of approximately 30-year long up and down temperature trends during the steady progressive rise in atmospheric carbon dioxide level of the 20th century certainly is not one since it corroborates that there is no significant correlation between rising atmospheric carbon dioxide and global average temperature. All of my sources are cited so that they can be checked. None are misrepresented. Quoting a maximum or minimum in a data set hardly qualifies as ‘cherry picked’. The Middlebury link (post 41) includes links to all of the source data that is graphed there. The corrections to Dr. Loehle’s paper are included with the original in the link at http://www.ncasi.org/publications/Detail.aspx?id=3025 . Select ‘Download File’ to get both the original and the corrections. Contrary to assertions by Chris, review of this paper reveals that the ‘corrections’ made little change to the results. Loehle used a 29 year smoothing which allowed comparison only through 1992 at the time of the paper. The smoothed average global temperature in 1992 reached about the same as was reached during the Medieval Warm Period. Loehle describes all of the data sources and methods that were used and solicits feedback by also giving his email address. Regarding the Medieval Warm Period, this is what Dr. Loehle actually said (in the correction): “The peak value of the MWP is 0.526 Deg C above the mean over the period (again as a 29 year mean, not annual, value). This is 0.412 Deg C above the last reported value at 1935 (which includes data through 1949) of 0.114 Deg C. The standard error of the difference is 0.224 Deg C, so that the difference is significantly non-zero at the 10% level (t = 1.84). While instrumental data are not strictly comparable, the rise in 29 year-smoothed global data from NASA GISS (http://data.giss.nasa.gov/gistemp) from 1935 to 1992 (with data from 1978 to 2006) is 0.34 Deg C. Even adding this rise to the 1935 reconstructed value, the MWP peak remains 0.07 Deg C above the end of the 20th Century values, though the difference is not significant.” Utilizing information from several publications as well as the web helps to compensate for the bias, agenda, group-think and de facto censoring that can exist with a particular publication. There are undoubtedly many publications that supposedly show that added atmospheric carbon dioxide is a significant cause of Global Warming. That can happen when you start out with a conclusion and then set out to justify it. I started out with the relation of carbon dioxide and Global Warming as a question. Although I try to listen very carefully to what others say, I withhold judgment as to validity until vastly corroborated and even then remain alert to contradiction. The above and, except for mentioning feedback, the lengthy comments by Chris are not particularly relevant to the issue of reliability of GCMs. Although reliability as used here is ambiguous, I assume, as probably most do, that it means that it pertains to whether GCMs can reliably predict future climate. Maybe some day some of them will be able to but not yet. Three major issues are apparent: 1) Vertical convection is subjectively parameterized. 2) Clouds are also subjectively parameterized, and rather poorly (see post 17). 3) The users arbitrarily impose substantial positive feedback which, climate history proves is a mistake. There are other issues as listed at post 32 (Average temperature anomaly from NOAA for Jan thru Sept 2008 is 0.445). There is one exact computer of earth’s climate as I described at post 45 above. Of course any credible temperature proxy can be used as an archive of results. It appears that Chris either did not read or did not understand my earlier post (43) on feedback. Referring to feedback as “vague” and “nebulous” further verifies a lack of understanding of feedback. Failure to see the difference between the paraphrase of my words “clearly feedbacks don't exist” and my actual assertion that NET positive feedback does not exist also indicates a lack of understanding of feedback. Failing to understand feedback explains why temperature TREND reversals during the previous glaciation are not recognized as proving that significant NET positive feedback does not exist in climate. Actual temperature response is influenced by NET feedback. NET feedback is the combined effect of positive feedbacks such as water vapor, negative feedbacks such as Lindzen’s iris effect, and all other feedbacks whether recognized or not. Although the numerical values and formulation are different between engineering feedback and Ocean and Atmospheric Physics feedback, positive feedback means the same thing in both. The response is greater with positive feedback than it would be if there were no feedback. NET means the combined effects of all active feedbacks whether known or not. A temperature TREND direction change proves that there is no significant NET positive feedback. Any credible source of temperature can be used. All that is needed to determine that there is no net positive feedback is a temperature trace for a long enough time to average out cyclic variation from random noise and other factors such as ENSO. Of course it must also be substantially longer than any smoothing period that was employed. The temperature trace does not even need to be correct in absolute terms just reasonably accurate in relative terms time-wise. Apparently the importance of the change in direction of temperature trend is not recognized by those who do not understand how feedback works. Without significant net positive feedback, the GCMs do not predict significant Global Warming.
  6. Re #57 There are some extraordinary misconceptions and lovely examples of deliberate misinterpretation in Dan’s post. Let’s have a look (a response to Dan’s “feedback” stuff in a separate post): We can examine the wealth of paleoproxy data published in the scientific literature (these can be found in the NOAA site urled in the list below, and some of these are compiled in a graph on the Wikipedia page...…more recent data sets that aren’t in the Wikipedia composite are cited below too). All of this data from a very large number of analyses indicate that we are a good bit warmer now (by 0.4-0.6 oC or more) in the Northern hemisphere now than during the so-called “Medieval Warm Period” (MWP). Dan has chosen to ignore all of the published data, and to refer us to an article in a non-science magazine who’s editor is quite open about her inclusion of (non-peer reviewed) stuff that supports her rather odd political considerations. Dan's article is scuppered by a ludicrous howler in which the author (Loehle) misunderstood the dating of paleodata and thought that his data sets progressed to the present, when in fact they extend at the very most to 1949. In other words Loehle misses out completely the very marked global scale warming of the last nearly 60 years. Loehle corrected his analysis.....now taking Loehle’s own CORRECTED data at face value his analysis demonstrates that it is a good bit warmer now that during the MWP. So Dan got it wrong. Note that although Loehle was honest enough to print a correction of his paper, Dan chose to base his original “analysis” (post #53) on the incorrect presentation even ‘though the correction is joined into the same document as the original incorrect article...that’s a dull piece of contrived misrepresentation and cherrypicking……sadly, that seems to Dan’s modus operandi (see posts #46, 48, 50, 52, 54). It’s worth noting Dan’s attempt to “rescue” the “situation”. Dan points out that Loehle still considers that the MWP might have been (in the Northern hemisphere) as warm as now. However Loehle makes another fundamental error here. Note that Loehle’s paleodata set is extremely sparse (18 records) and some of these records themselves are extremely sparse (e.g. a paleotemperature point every 100 years). This might be contrasted with the recent paleoanalysis of Mann et al (2008), for example, which also addressed the paleodata without using tree ring proxies, and who's analysis uses around 170 paleotemperature data sets with the stipulation that the data has at least decadal temporal resolution. Examination of Loehle’s original sparse records shows considerable variability, and (as is quite normal) in order to make the paleotemperature variations accessible and to incoproprate disparate sets into a common record, the data are smoothed by averaging in the time domain. Loehle used a 30 year running mean (changed to a 29 year running mean in his correction). The problem is that Loehle then chose to compare his most recent paleoproxy temperature point (the year 1935), with the instrumental temperature record (from NASA GISS: http://data.giss.nasa.gov/gistemp/) smoothed as a 29 year running average. Of course that doesn’t make any sense. We know what the earth’s land/sea surface temperature has done since 1935. It’s risen by around 0.6 oC. If one arbitrarily averages the real measured temperature with a 29 year running average, one arithmetically “magic’s” away a good bit of the warming. O.K. so Loehle’s analysis is pants on a number of levels. But for all its ludicrous faults, taken at face value it still indicates that we are a good bit warmer now (in the N. hemisphere) than during the MWP. I would suggest that if anyone is interested in looking at what the science indicates on this subject, they look at the paleodata on the NOAA NCDC database or download the very recent extensive analysis of Mann et al (2008) published as an Open Access article in the Proceeds of the National Academy of Sciences (http://www.pnas.org/content/105/36/13252.full) M. E. Mann et al (2008) “Proxy-based reconstructions of hemispheric and global surface temperature variations over the past two millennia” Proceedings of the Natl. Acad. Sci. USA 105:13252-13257 ------------------------------------------------------- The extensive published paleoproxy temperature data is compiled here: http://www.ncdc.noaa.gov/paleo/recons.html Wikipedia has a reasonably good account of this data, and an overlay of many of the paleotemperature proxy data can be found here: http://en.wikipedia.org/wiki/Image:1000_Year_Temperature_Comparison.png recent papers with datasets/analyses that may not be in the Wikipedia compilation are: M. E. Mann et al (2008) “Proxy-based reconstructions of hemispheric and global surface temperature variations over the past two millennia” Proceedings of the Natl. Acad. Sci. USA 105:13252-13257. (http://www.pnas.org/content/105/36/13252.full) D'Arrigo RD, Wilson R, Jacoby G (2006) “On the long-term context for 20th century warming.” J Geophys Res 111:D03103. Hegerl GC et al (2007) “Detection of human influence on a new, validated 1500 year temperature reconstruction.” J Clim 20:650–666. Lee TCK, Zwiers FW, Tsao M (2008) “Evaluation of proxy-based millennial reconstruction methods.” Clim Dyn 31:263–281. Viau, AE et al (2006) “Millennial-scale temperature variations in North America during the Holocene” J. Geophys. Res. 111, D09102.
  7. Re #57, on CO2 and feedbacks. There is a large amount of paleodata on the relationship between Earth’s paleotemperature data and paleoCO2 measures, and these indicate that the Earth in the deep past was warm when atmospheric CO2 levels were high, and cool/cold when atmospheric CO2 levels were low. Some of these data are listed at the bottom of the post (data set #2).. Dan makes an odd statement about the record of “30 year long up and down temperature trends during the steady progressive rise in atmospheric carbon dioxide level of the 20th century”. But one only needs to look at the temperature record (e.g. http://data.giss.nasa.gov/gistemp/), to see that the trend is a positive one. The earth’s surface temperature is undergoing a rapid increase in temperature that is following the extraordinarily rapid rise in atmospheric CO2. But one needs to be careful of course. The temperature rise that results from enhanced atmospheric CO2 levels relates to the temperature AT EQUILIBRIUM. There are two problems with Dan’s simple misrepresentation. Internal variations in the climate system (ocean currents, El Nino’s, La Nino’s) that temporarily redistribute heat, the effects of volcanic eruptions that transiently cool the atmosphere (or man made aerosols), the solar cycle, and so on, result in fluctuations around the equilibrium temperature that is effectively “set” by the solar output and the greenhouse effect. So we obviously don’t expect to see a perfectly steady increase in temperature as CO2 levels rise. The earth’s temperature has been rising by around 0.2 oC per decade during the last 30-odd years. However internal variation can be as large as 0.1-0.2 oC per year. So the temperature rise is overlaid with “noise” from these fluctuations. That’s pretty obvious. Likewise right now we’re smack at the bottom of the solar cycle. So for the last couple of years and for perhaps another couple the Earth’s temperature rise is being opposed by a slightly cooler sun. In a couple of years the rise in solar output will add to the greenhouse warming.. ..and so on. The fact is that when we assess the trends over longish periods, the Earth is on a warming trend…we’re around 0.5 oC warmer globally than 30 years ago. The temperature may have gone “up and down” a bit during this period...but overall it’s gone up! A large number of analyses indicate that the Earth’s EQUILIBRIUM temperature rises by around 3 oC (+/- a bit) per doubling of atmospheric CO2. A significant part of this temperature rise results from feedbacks, the most important one being the water vapour feedback. As the atmosphere warms under the influence of raised CO2 levels, so the atmospheric concentration of water vapour rises. Does this feedback actually exist? Yes. We can measure the enhanced atmospheric water vapour directly in the real world [see Soden et al (2005); Brogniez H and Pierrehumbert RT (2007); Santer BD et al. (2007); Buehler et al. (2008); Gettelman and Fu (2008)…and so on (citations below]. So the major feedback to enhanced CO2 level exists. As atmospheric CO2 levels rise so atmospheric water vapour levels rise, pretty much in expectations with predictions based on straightforward atmospheric physics (not to mention models which also predict the observed tropospheric moistening). It’s difficult to know exactly where Dan is confused with respect to “feedbacks” since he is very vague. Notice that Dan is being a tad dishonest in his comments in post #57, since I don’t refer to feedbacks as “vague” and “nebulous” at all, but to Dan’s “discussion” of these as vague (this dishonesty is similar to Dan’s pretence that my criticism of Dan’s appalling cherrypicking of paleotemperature data equates to a disagreement on my part with the data). The problem is that Dan makes very vague comments about feedbacks. He talks about “feedbacks, known or not”. He alludes to negative feedbacks without really addressing what these might be, other than alluding to a negative feedback “identified” by Dr. Richard Lindzen and “his iris effect”. But of course Lindzen didn’t “identify” an “iris effect”. Lindzen hypothesised such a possibility…however real world analysis hasn’t really provided any evidence for such a thing (see below). Lindzen earlier postulated that increased CO2-induced warming would cause a drying of the troposphere, but in the face of real world data world [see Soden et al (2005); Brogniez H and Pierrehumbert RT (2007); Santer BD et al. (2007); Buehler et al. (2008); Gettelman and Fu (2008)…and so on (citations below], Lindzen had to dump that notion too. Unverified or disproven hypothesis don't constitute evidence of anything. The problem with vague assertions about hypothetical negative feedbacks is not just that these are ill-defined, and that the evidence indicates that these hypothetical feedbacks don’t exist or are small. Real world observations support the conclusions that (i) that the climate sensitivity to raised CO2 is rather significant (around 3 oC per doubling of atmospheric CO2), and (ii) that putative, hypothetical negative feedbacks are not very significant. Thus many of the determinations of climate sensitivity are empirical analyses that relate warming to variations in forcings and accommodate all feedbacks whether negative or positive. Thus determination of a climate sensitivity to CO2 by analysis of glacial-interglacial transitions, by analysis of paleotemp/paleoCO2 data [Royer et al (2007)]; by analysis of the Earth’s temperature response to the solar cycle [Tung and Camp (2008)], and so on, implicitly incorporate all of the forcings whether negative or positive. These give values near 3 oC of warming per doubling of atmospheric CO2. Likewise we’ve had a very marked warming during the last 30 years (around 0.5-0.6 oC) in response to an increase in atmospheric CO2 from 330 ppm to 385 ppm. If we’ve had 0.5-0.6 oC of temperature rise from a “small” (!) CO2 rise of 55 ppm on the course of a potential doubling of 330-660 ppm, then that seems highly inconsistent with a low climate sensitivity; the same conclusion arises from the extent of warming we’ve had in response to a relatively small proportion of doubling of atmospheric CO2 during the 20th century. In fact the temperature increase of the 20th century, modelled using the full set of known contributions, is entirely compatible with the effects of feedbacks (Hansen et al, 2005) and predictive simulations set up in the 1980’s have done a rather good job of predicting the subsequent global temperature increase (Hansen et al, 2006) and so on. Thus it’s perverse to suggest that what exists (since we can measure it in the real world) doesn’t exist…or to assert that what doesn’t seem to exist (since there seems precious little evidence for it!), does. Dan also needs to be far less vague about his comments concerning temporal relationships between temperature and greenhouse gas levels during glacial cycles. He’s confused over something and thinks that everyone else might be wrong…but unless he is explict about his problem we’re unlikely to be able to help him… Buehler SA (2008) An upper tropospheric humidity data set from operational satellite microwave data. J. Geophys. Res. 113, art #D14110 Brogniez H and Pierrehumbert RT (2007) Intercomparison of tropical tropospheric humidity in GCMs with AMSU-B water vapor data. Geophys. Res. Lett. 34, art #L17912 Gettelman A and Fu, Q. (2008) Observed and simulated upper-tropospheric water vapor feedback . J. Climate 21, 3282-3289 Hansen, J. et al (2005) Earth's energy imbalance: Confirmation and implications. Science, 308, 1431-1435. http://pubs.giss.nasa.gov/docs/2005/2005_Hansen_etal_1.pdf Hansen, J. et al. (2006) Global temperature change. Proc. Natl. Acad. Sci., 103, 14288-14293. http://pubs.giss.nasa.gov/docs/2006/2006_Hansen_etal_1.pdf Royer DL et al. (2007) Climate sensitivity constrained by CO2 concentrations over the past 420 million years Nature 446, 530-532 Santer BD et al. (2007) Identification of human-induced changes in atmospheric moisture content. Proc. Natl. Acad. Sci. USA 104, 15248-15253 Soden BJ, et al (2005) The radiative signature of upper tropospheric moistening Science 310, 841-844. Tung and Camp (2008) Solar Cycle warming at the Earth’s surface and an observational determination of climate sensitivity http://www.amath.washington.edu/research/articles/Tung/journals/solar-jgr.pdf ------------------------------------------------- Data set #2: A wealth of paleoproxy data support the conclusion of a strong relationship between atmospheric CO2 and earth’s surface temperature during the deep past. These data support a high climate sensitivity to CO2 and indeed analysis of the relationships between paleotemperature and paleoCO2 indicate that the earth’s temperature sensitivity to enhanced CO2 has been high for 500 million years. Explicitly a value for the climate sensitivity of 2.8 oC per doubling of atmospheric CO2 has been determined (see Royer et al (2007) in the citayions listed above. D.L. Royer (2006) "CO2-forced climate thresholds during the Phanerozoic" Geochim. Cosmochim. Acta 70, 5665-5675. (this is a review compiles much of the published data) Even more recent studies supplement the information in Royers compilation and cover additional periods with new data sets right through the past several hundreds of millions of years: R.E. Carne, J.M. Eiler, J. Veizer et al (2007) "Coupling of surface temperatures and atmospheric CO2 concentrations during the Palaeozoic era" Nature 449, 198-202 W. M. Kurschner et al (2008) “The impact of Miocene atmospheric carbon dioxide fluctuations on climate and the evolution of the terrestrial ecosystem” Proc. Natl. Acad. Sci. USA 105, 499-453. D. L. Royer (2008) “Linkages between CO2, climate, and evolution in deep time” Proc. Natl Acad. Sci. USA 105, 407-408 Zachos JC (2008) “An early Cenozoic perspective on greenhouse warming and carbon-cycle dynamics” Nature 451, 279-283. Doney SC et al (2007) “Carbon and climate system coupling on timescales from the Precambrian to the Anthropocene” Ann. Rev. Environ. Resources 32, 31-66. Horton DE et al (2007) “Orbital and CO2 forcing of late Paleozoic continental ice sheets” Geophys. Res. Lett. L19708 (Oct. 11 2007). B. J. Fletcher et al. (2008) “Atmospheric carbon dioxide linked with Mesozoic and early Cenozoic climate change” Nature Geoscience 1, 43-48.
  8. Re #56 Quietman, the posting of your link to a paper purporting to identify an incompatibility between tropospheric temperatures in the tropics and modelled tropospheric temperature is fascinating. Here’s a very recent paper by a large group of 17 climate scientists. It (abstract at bottom of post) completely contradicts the paper that you linked towards: B. D. Santer et al. (2008) Consistency of modelled and observed temperature trends in the tropical troposphere. International Journal of Climatology 28, 1703 – 1722. You can download and read it from here: https://publicaffairs.llnl.gov/news/news_releases/2008/NR-08-10-05-article.pdf What can be going on? The answer is the guys whose paper you linked towards (Drs Douglass, Christy, Pearson and Singer; DCPS) messed up somewhat (incidentally you should always be a little suspicious of papers containing the rather dubious S. Fred Singer). Here’s the story: 1. Simple atmospheric physics indicates that as the atmosphere warms under the influence of raised [CO2], a water feedback (raised water vapour in a warming atmosphere) should kick in resulting in additionally raised atmospheric temperature. This is observed in models (both the raised water vapour and atmospheric temperature), and is generally consistent with real world measurements. 2. But not fully. There has been an apparent mismatch between predicted tropospherical warming and measured warming in the tropics. Radiosonde data (crude temperature measures in weather balloons) especially, don’t seem to show the predicted temperature increase. Something is wrong. 3. But what? In this case it looks like it might be the measurements that are wrong. In fact the paper you linked towards (DCPS) was not so much about demonstrating that there is a mismatch between the models and tropical tropospheric temperature measures (there quite likely isn’t), but in asserting that the tropospherical tropical temperature measurements are sufficiently free from error that such a comparison can be reliably made. In fact it seems that they aren’t. 4. What does the evidence indicate? It’s been known for some time that there is a very significant problem with the radiosonde tropospheric data, and this is particularly severe in the tropics. If these errors are taken into account, then the model and tropical tropospheric temperature can be be reconciled. However this requires a recognition of the substantial errors in the measured raiosonde data and a proper evaluation of these errors when assessing any real or potential disparity with the models. S. C. Sherwood et al. (2005) Radiosonde Daytime Biases and Late-20th Century Warming Science 309, 1556 – 1559. Abstract: “The temperature difference between adjacent 0000 and 1200 UTC weather balloon (radiosonde) reports shows a pervasive tendency toward cooler daytime compared to nighttime observations since the 1970s, especially at tropical stations. Several characteristics of this trend indicate that it is an artifact of systematic reductions over time in the uncorrected error due to daytime solar heating of the instrument and should be absent from accurate climate records. Although other problems may exist, this effect alone is of sufficient magnitude to reconcile radiosonde tropospheric temperature trends and surface trends during the late 20th century.” L. Haimberger et al (2008) Toward Elimination of the Warm Bias in Historic Radiosonde Temperature Records—Some New Results from a Comprehensive Intercomparison of Upper-Air Data. J. Climate 21, 4587-4606. M. P. McCarthy et al. (2008) “Assessing Bias and Uncertainty in the HadAT-Adjusted Radiosonde Climate Record”. J. Climate 21, 817-832. P. W. Thorne et al. (2007) Tropical vertical temperature trends: A real discrepancy? Geophys. Res. Lett. 34, L16702. And so on… 5. And in fact, if tropical tropospheric temperatures are assessed using other measured correlates of temperature, there is increasing evidence that in fact the tropical troposphere is warming as predicted: Allen RJ and Sherwood SC (2008) Warming maximum in the tropical upper troposphere deduced from thermal winds. Nature Geoscience 1, 399-403. Abstract: "Climate models and theoretical expectations have predicted that the upper troposphere should be warming faster than the surface. Surprisingly, direct temperature observations from radiosonde and satellite data have often not shown this expected trend. However, non-climatic biases have been found in such measurements. Here we apply the thermal-wind equation to wind measurements from radiosonde data, which seem to be more stable than the temperature data. We derive estimates of temperature trends for the upper troposphere to the lower stratosphere since 1970. Over the period of observations, we find a maximum warming trend of 0.65 +/- 0.47 K per decade near the 200 hPa pressure level, below the tropical tropopause. Warming patterns are consistent with model predictions except for small discrepancies close to the tropopause. Our findings are inconsistent with the trends derived from radiosonde temperature datasets and from NCEP reanalyses of temperature and wind fields. The agreement with models increases confidence in current model-based predictions of future climate change." 6. What are the conclusions? The first is that one should be carefully not to be fooled by dubious papers that are circulated around the blogosphere to fool the unwary. There are usually a number of papers that are relevant to assess particular issues, and one should try to address all of the evidence. Secondly, one can only assess the relationship between predicted/modeled analyses and real world data if the real world data is sufficiently accurately defined to make a valid comparison. Although this is often the case, in the particular instance of measured tropical tropospheric temperatures, the evidence indicates that the real world measurement errors are still too large. However as Santer et al indicate, they are improving, and there is now no substantial disagreement between modelled and measured data. ----------------------------------------------------- B. D. Santer et al. (2008) Consistency of modelled and observed temperature trends in the tropical troposphere. International Journal of Climatology 28, 1703 – 1722. Abstract "A recent report of the U.S. Climate Change Science Program (CCSP) identified a potentially serious inconsistency between modelled and observed trends in tropical lapse rates (Karl et al., 2006). Early versions of satellite and radiosonde datasets suggested that the tropical surface had warmed more than the troposphere, while climate models consistently showed tropospheric amplification of surface warming in response to human-caused increases in well-mixed greenhouse gases (GHGs). We revisit such comparisons here using new observational estimates of surface and tropospheric temperature changes. We find that there is no longer a serious discrepancy between modelled and observed trends in tropical lapse rates. This emerging reconciliation of models and observations has two primary explanations. First, because of changes in the treatment of buoy and satellite information, new surface temperature datasets yield slightly reduced tropical warming relative to earlier versions. Second, recently developed satellite and radiosonde datasets show larger warming of the tropical lower troposphere. In the case of a new satellite dataset from Remote Sensing Systems (RSS), enhanced warming is due to an improved procedure of adjusting for inter-satellite biases. When the RSS-derived tropospheric temperature trend is compared with four different observed estimates of surface temperature change, the surface warming is invariably amplified in the tropical troposphere, consistent with model results. Even if we use data from a second satellite dataset with smaller tropospheric warming than in RSS, observed tropical lapse rate trends are not significantly different from those in all other model simulations. Our results contradict a recent claim that all simulated temperature trends in the tropical troposphere and in tropical lapse rates are inconsistent with observations. This claim was based on use of older radiosonde and satellite datasets, and on two methodological errors: the neglect of observational trend uncertainties introduced by interannual climate variability, and application of an inappropriate statistical consistency test."
  9. It was somewhat surprising to discover that the study of climate science does not require any exposure to the ‘theory’ (it is widely and successfully applied practice in some engineering disciplines, especially electrical, mechanical and aeronautical) of dynamic systems with feedback control. Their ignorance has resulted in climatologists coming up with their own expression for feedback and the perception that feedback in climate is somehow different from feedback in other systems. In effect it isn’t (for more, see 49 above). Earth’s climate is a dynamic system that is controlled by NET feedback. A lack of understanding of dynamic systems with feedback and how they work has resulted in many articles being published that a reviewer who was knowledgeable in dynamic systems with feedback would quickly recognize as patently false. Climate publications are staffed by climate scientists. Articles for publication in climate publications are peer reviewed by climate scientists. None of them appear to be knowledgeable in dynamic systems with feedback and thus they are unable to recognize information that is readily shown to be false and should never have been published. Feedback means that the output (results, response) influences the input. Feedback can be positive or negative. Positive feedback means that the output is greater than it would be without feedback. Negative feedback means that the output is reduced from what it would be without feedback. Net feedback is the effective feedback when there are both positive and negative feedbacks. If net feedback is positive the trend must continue up at a progressive rate. The effect on a savings account balance with compound interest is a familiar example of net positive feedback. Complexity does not alter how net feedback works. Now look at any credible historic temperature data. To be credible, a temperature trace must be for a long enough time to average out cyclic variation from random noise and other factors such as ENSO. The temperature trace does not even need to be correct in absolute terms just reasonably valid in relative terms time-wise. It should also be substantially longer than any smoothing period that was employed in generating the data set. A temperature trend can not change direction from up to down if net positive feedback exists. If there is at least one change of average global temperature trend from up to down (a down trend of average global temperature can not exist with net positive feedback) without an overpowering external influence, it proves that net positive feedback does not exist. There are many and there are downtrends. Therefore net positive feedback does not exist. Without net positive feedback the climate computer models (GCMs) do not predict significant global warming from increased atmospheric carbon dioxide. There are other issues with GCMs and their use as described at 32 above. Climate scientists and climate scientist wannabes who claim that ‘the science says’ are simply ignorant of an important part of science that is relevant to the issue. Climate scientists, in their ignorance, impose net positive feedback on their GCMs which causes them to falsely predict that added atmospheric carbon dioxide causes significant global warming.
  10. Re #61 Dan’s pursuing another error that results from not bothering to find out what the term "feedback" means in an unfamiliar field. The mistake is easy to see in Dan’s definition of "feedback". Here it is: [Dan: "Feedback means that the output (results, response) influences the input."] But that definition doesn't really apply to the climate system and its temperature inputs/outputs in relation to the energy balance that defines an equilibrium temperature. Here's a simple example. The solar output increases a tad (perhaps during the solar cycle). As a result the atmosphere warms a bit. What might also happen? Since the relative humidity of the atmosphere tends to remain constant, and a warmer atmosphere has a higher saturation point for water vapour, the atmospheric water concentration rises (we can measure this in the real world). This is considered a positive feedback in atmospheric physics. Does this accord with Dan’s definition of "feedback" as used in engineering? Not really. I think we’d all agree that the enhanced water vapour concentration doesn't alter the solar output. Of course there is an element of "engineering"-style "feedback" in the water vapour feedback. The solar warming results in raised water vapour concentration which warms the atmosphere further resulting in further enhanced water vapour concentration. If the solar change results in a 1 oC change, and the resulting water vapour feedback adds an additional x of additional warming then the total warming from the solar enhancement + water vapour feedback is something like 1 + x + x^2 + x^3 + x^4 ... which is 1/(1-x). We can make the same argument for the enhancement of atmospheric CO2 concentrations. If the atmospheric CO2 concentrations rise by an amount giving a 1 oC of warming then the water vapour feedback will result in a total warming of 1/(1-x), where x is the temperature rise at equilibrium resulting from the enhanced water vapour concentration that is induced by a CO2-driven rise in temperature of 1 oC. Again note that in this case (enhanced CO2 forcing a temperature rise that generates a positive water vapour feedback), Dan’s “engineering-style feedback” barely applies (it might a tad). In other words, the water vapour feedback doesn’t recruit further rises in atmospheric CO2. Note that this is a little different from the CO2 feedback warming from enhanced insolation, for example during glacial-interglacial transitions driven by Milankovitch cycles. Here the enhanced insolation results in atmospheric warming which recruits a small amount of CO2 from the ocean and terrestrial environment, which results in a small amount of enhancement of the water vapour concentration with a tiny additional enhancement of the atmospheric CO2. But we know that the temperature-dependent recruitment of CO2 into the atmosphere is quite small. So, for example, the last glacial-interglacial transition from around 15000-10000 years ago resulted in a global temperature increase near 6 oC, and a warming-induced increase in atmospheric CO2 of around 90-100 ppm. So it takes a 1 oC of temperature rise to raise atmospheric CO2 levels by around 15-16 ppm. Interestingly this takes around 1000 years (averaging over the transition), whereas we’re getting this amount of enhanced CO2 in around 7 years now. Dan suggests that: “If net feedback is positive the trend must continue up at a progressive rate. The effect on a savings account balance with compound interest is a familiar example of net positive feedback. Complexity does not alter how net feedback works.” But each of those statements is untrue in the context of atmospheric physics and the Earth’s energy balance. Even though the net feedback is positive, the “trend” DOESN’T “continue up at a progressive rate “. This is because the feedback doesn’t affect the input in the manner that Dan suggests, (and also because the “strengths” of the feedbacks are not sufficiently large as to cause the system to “continue up at a progressive rate “ - see the pnt about the atmospheric CO2 feedback to Milankovitch warming in the last but one paragraph). What happens is that the Earth’s energy balance progresses towards a new equilibrium with a temperature that is somewhat higher than it would be without feedbacks. It’s not like Dan’s idea of “compound interest” in “a savings account balance”, at all. We can add other feedbacks. Some of these, of course, might well be negative. But we know for example that there is at least one more additional positive feedback. The warming from raised CO2 results in melting of mountain glacial and polar sea and land ice. Since this doesn’t result in very much in the way of recruiting of additional CO2, again this is a feedback that doesn’t influence the input (enhanced atmospheric CO2) to any great extent. So we can treat it much as we did above. It will cause additional atmospheric warming as more solar shortwave infrared is absorbed by the earth and converted into thermal energy. This will warm the atmosphere a bit more, and more water vapour will be “recruited”… ..again the Earth’s “temperature” will settle towards a new equilibrium temperature that is a bit warmer than that resulting only from the enhanced atmospheric CO2 with its water vapour feedback. In effect this will be the Earth’s equilibrium temperature that applies to this particular insolation, with this particular atmospheric CO2 concentration and this particular atmospheric water vapour concentration and this particular albedo. Note that the albedo effect is inherently self-limiting, and this is another example of where Dan’s mis-application of “engineering-style” “theory” to an inappropriate example breaks down. We could discuss this too… Overall, we can examine the paleoclimate record, analyze the warming resulting from Milankovitch-forced glacial-interglacial transitions, analyze the 20th century warming record, determine the atmospheric response to volcanic eruptions, study the theoretical response in computer models and so on….all of these indicate that the Earth’s climate responds to enhanced atmospheric Co2 concentrations with positive feedbacks of the sort described in the preceding paragraphs, such that the Earth’s “energy balance” shifts to a new equilibrium that gives us a higher surface temperature that would result solely from the enhanced CO2 without feedbacks. This new equilibrium temperature is around 3 oC of warming per doubling of atmospheric [CO2].
  11. Chris apparently has no knowledge of dynamic system theory. That helps explain the overt hostility (under the false assumption that I am just making stuff up) and why he/she mistakenly declares that some of my assertions are erroneous. Dynamic systems with feedback are phenomena of the natural world, like thermodynamics, genetics, cosmology, etc. etc., which can be studied and understood. The subject is studied by some engineers; usually as part of a post graduate course. They study the phenomenon and learn concepts and applicable mathematic tools and usually apply them to things like the guidance system of an antimissile missile, cruise control device for a vehicle, etc. Learning about dynamic systems is not required for climate scientists. They appear to be totally unaware that knowledge of dynamic systems would drastically alter their perception of world climate. Knowledge of dynamic systems allows recognition that world climate, as summarized by average global temperature, can be viewed as a dynamic system and that the mathematics and concepts of dynamic systems apply. Some things are immediately obvious to anyone familiar with dynamic systems with feedback. For example, the existence of temperature downtrends proves that significant NET positive feedback does not exist. Failure of climate scientists to recognize this stems from a lack of knowledge of that part of science pertaining to dynamic systems. Incidentally, a lack of knowledge of dynamic systems resulted in misinterpreting the meaning of ‘input’. Input to a dynamic system refers to the input to the transfer function. This input is not merely the output of the source of energy (as Chris erroneously guessed), which in the case of climate is the sun, but also includes any and all feedbacks (the combined effect of which is NET feedback). Also, lacking an understanding of dynamic systems can result in the delusion that world climate is somehow special and does not follow the same (dynamic system theory) rules as other dynamic systems. The output of this dynamic system model is average world temperature. The transfer function is by definition a function that accounts for all factors that influence average world temperature. Lack of understanding of dynamic systems with feedback has resulted in a repeat of stuff that no one that is knowledgeable on the subject disputes and a failure to realize that temperature downtrends prove that substantial negative feedback must exist because the NET feedback can not be significantly positive. Temperature observations are widely available. They show temperature downtrends when there is no significant influence from Milankovitch. This could not take place (without change to influence from outside the planet) if there were any net positive feedback. Without the imposition of net positive feedback by the GCM users, the GCMs do not show significant global warming. Other shortcomings of GCMs and their use are described at 32 above. Any good reference on dynamic system theory and application would serve to learn how dynamic systems work. As a start, one might review the applicable chapters in Phelan, R 1967, Dynamics of Machinery McGraw Hill Book Co. NY. Although the subject is presented in the context of control systems it is readily generalized to apply to global climate and global average temperature.
  12. O.K. Dan, I think we're making some progress. It seems your "disagreement" with the science relates to a misunderstanding of the nature of "feedback" in relation to the earth's energy budget combined with a reliance on inappropriate analogies ("anti-missile missiles"; "cruise control devices"), a misunderstanding of insolation effects resulting from the cyclical elements of the earth's orbital properties that modulates the pattern of insolation on the 10's of 1000's of years timescale, and (judging by your previous posts and your dismal web page) a desire to impose a false view of this entire subject through a propagation of contrived misrepresentation. Is that "hostile"? Possibly...but I'd prefer "trenchant", since I think one should address contrived misrepresentation with a bit of vigour! Feedbacks. The evidence indicates that there is a NET positive feedback to enhanced atmospheric CO2 concentrations. You’ve said in another post somewhere that positive feedbacks occur with carbon dioxide and water. That’s exactly right. The warming effect of enhanced atmospheric CO2, for example, is amplified by a water vapour feedback, and certainly an albedo feedback. It seems that we agree about that. Overall the evidence indicates that the NET feedback results in a warming resulting from doubling of atmospheric CO2 of around 3 oC (+/- a bit). You seem to have a residual problem with this…I wonder whether it relates to your reliance on analogies and a textbook (Phelan, 1967) based on the analysis of control systems. Unfortunately feedbacks in relation to “control systems” are not really appropriate (see following): Dynamic systems/control systems. The climate is a dynamic system with elements involving forcings and feedbacks that "act" on many different timescales, as well as stochastic and non-stochastic elements that provide “noise” in various accessible parameters (such as the surface temperature anomaly). It differs from your notion of a “control system” in that the feedbacks are neither “designed” nor constrained to maintain an equilibrium, even if parameters (like the earth’s surface temperature anomaly) might well be in equilibrium for long periods as a result of a relatively steady state in relation to forcings (e.g. the sum of solar and greenhouse contributions). If there is a change in these forcings (a change in solar output or a change in greenhouse gas concentrations) the earth doesn’t respond so as to maintain an equilibrium surface temperature. The earth’s climate system evolves dynamically under the influence of the new forcings until a new (dynamic) equilibrium is reached. In the case of enhanced greenhouse forcing at constant insolation, the new equilibrium is around 3 oC of raised surface temperature per doubling of atmospheric [CO2]. There’s a NET positive feedback. Does the climate system have elements of your “control systems”. It does a bit. For example the vast oceans provides a heat reservoir that regulates surface temperature somewhat, both directly and through the evaporation/precipitation cycles. The vast ice sheets also provide a bit of a thermal “buffer” due to the large heat capacity associated with the ice/water phase transition. Over very long periods greenhouse-induced warming is countered by increased weathering that draws CO2 out of the atmosphere. But overall the earth isn’t really under the influence of “control systems” and certainly doesn’t respond in that manner. It responds to a change in forcings via dynamic transitions to new (dynamic) thermal equilibria. Milankovitch/feedbacks. I suspect you’re still confused by these. Variations in the earth’s orbital climatic precession, obliquity and eccentricity result in a rather complex, but well-defined variation in insolation that matches rather well the progression of temperature anomalies in the ice cores. I suggest that you look at some of the papers linked by John Cook here: http://www.skepticalscience.com/co2-lags-temperature.htm especially Petit et al, 1999 and Shackleton, 2000. If you have access to last week’s Nature magazine (6th November) read the paper on page 85 (Lisiecki et al (2008) “Atlantic overturning responses to Late Pleistocene climate forcings” Nature 456, 85-88.), or the accompanying commentary by Michael Crucifix “Climate’s astronomical sensors” on page 47. I know that you don’t like reading scientific papers and prefer weird websites and non-science magazines. However, one may as well obtain one’s information from the source that mature and well-informed policymakers source theirs! The significant NET positive feedback that amplifies CO2-induced warming relates to a relatively constant insolation. So in our present situation with a rather constant solar output and no significant Milankovitch contributions for many thousands of years to come, the enhanced greenhouse forcing is giving us (and will give us further) warming resulting from the earth’s climate sensitivity to enhanced [CO2] which the best evidence indicates is near 3 oC (+/- a bit) of warming for a doubled [CO2]. Obviously if the solar contribution diminishes either in relation to total solar output, or due to altered insolation patterns during Milankovitch cycles, the earth will still undergo cooling even ‘though there there is (a) a NET positive climate warming feedback to enhanced [CO2] under conditions of constant insolation, and (b) a residual highish concentration of atmospheric CO2 (since CO2 is drawn only very slowly out of the atmosphere).
  13. Chris is not only unaware of a well established part of science but apparently refuses to consider it. Dynamic Systems Theory is readily applied to global average temperature history and easily proves that there is no significant NET positive feedback. Instead we get parochial rationalizations and erroneous estimates of future temperature as calculated by flawed computer programs that mistakenly invoke significant net positive feedback. The current UAH satellite numerical temperature anomaly data (these data consist of the differences of lower atmospheric temperature from the 1979 thru 1998 average) are at http://vortex.nsstc.uah.edu/data/msu/t2lt/uahncdc.lt . According to these data, the AVERAGE GLOBAL TEMPERATURE for the first 10 months of 2008 is LOWER than the average from 2000 thru 2007 by an amount equal to 40.3% of the total linearized increase (NOAA temperature anomaly data from ftp://ftp.ncdc.noaa.gov/pub/data/anomalies/annual.land_and_ocean.90S.90N.df_1901-2000mean.dat) during the 20th century. Since 2000, the CARBON DIOXIDE LEVEL HAS INCREASED by 14.4% of the total increase since the start of the Industrial Revolution (from several sources which are given on the fourth graph in the Middlebury link at 41 above). None of the GCMs predicted anything remotely close to this decline of average global temperature with rising atmospheric carbon dioxide level. The GCMs are little more than glorified curve fitting to historical data and apparently have negligible predictive capability. It will probably need to get much colder for some people to realize that they may be missing something. As the carbon dioxide level continues to increase and the average global temperature doesn’t, many people are looking more and more foolish.
  14. I see...a gear switch into tropospherical temperature measures now? Fair enough...however your problems on this issue are similar to those in relation to your cherrypicking of paleotemperature data (see posts #46, 48, 50, 52), your contrived misrepresentation of paleoCO2 data that is completely contradicted by the pukka scientific data (see posts #46, 48, 50, 52, 54), your dull cherrypicking of an incompetent paleotemperature "analysis" in a non-science magazine in which you pretended that the authors own rather fatal correction didn't exist (see posts #54, 58), your confusion over feedbacks…..and Milankovitch contributions (see posts #59, 62, 64)......and so on ..We've pretty much sorted out each of these (see posts #46, 48, 50, 52, 54, 58, 59, 62, 64)....so what about that tropospheric temperature data? There's a pretty serious problem with it I think we would agree. There's no question that the Earth's surface temperature is rising, and has done so rather dramatically since the mid 1970's. We can see this in the surface temperature record..or we can dispense with direct temperature records and construct a temperature record from the record of mountain glacier retreat…it’s pretty uncontroversial that it’s been getting significantly warmer, and rather quickly during the past 30-odd years. Basic atmospheric physics and associated climate models predict a significant tropospheric warming (it should be a bit larger than the surface temperature increase in response to enhanced greenhouse warming). However, the tropospheric temperature record from satellites (Microwave Sounding Units; MSU) and radiosondes (weather balloons) are giving some rather ambiguous data. What’s going on…? Your choice of the UAH record is interesting. The characters that compile this data have pursued a path of studied incompetence during the last 15 or more years, during which their early attempt to sell the notion that the troposphere was actually undergoing a cooling trend, was revised after it was pointed out that (a) their analysis was not sufficiently constrained to distinguish cooling from a warming consistent with physical expectations [ONE], (b) the method of averaging different satellite records introduce a spurious cooling trend [TWO], and (c) their incompetent disregard of orbital decay introduced another spurious cooling trend [THREE]. A little later it was shown (d) that MSU-2 showed a spurious cooling trend due to spillover of stratospheric cooling into the tropospheric temperature signal [FOUR], and later still it was pointed out that (e) the diurnal correction applied by Christy and Spencer (a sad litany of incompetence) was of the wrong sign and gave yet another spurious cooling trend [FIVE]. SO UAH is a rather dodgy source of data unfortunately. It’s a pretty scandalous record in fact. The RSS tropospheric data is likely to be more robust. But, unfortunately, however you look at it, the tropospheric temperature record from satellite measures [the radiosonde record has been shown to be highly contaminated by artefactual biases (see post #60 above)], is still poorly constrained. Despite Christy and Spencers’ assertions of “precision” in these analyses, they seem sadly inaccurate (and more so with Spencer and Christy’s litany of spurious adjustments towards cooling trends which has bedeviled the UAH analyses). Finally even Christy agrees that the tropospheric data worldwide is consistent with expectations from models, although he considers there is still a problem with the tropospherical temperature in the tropics. However that has been resolved recently, and there doesn't seem to be any substantive disagreement between the tropical tropospheric temperature trend as measured by satellites and predicted by models [SIX]. But it’s probably true to say that tropospheric temperature measures cannot really be used to make conclusive conclusions about either the agreement of satellite (or radiosonde) tropospheric temperatures with models or their disagreement. We need better tropospheric temperature measures I suspect. So if we’re really interested in knowing what the Earth’s surface temperature is doing in response to enhanced greenhouse forcing, we can look at the long term surface temperature record (around 100 years longer than the very short satellite tropospheric temperature record), and monitor the effects of warming (enhanced rate of sea level rise; large scale retreat of mountain glaciers; hugely increased rate of attenuation of Arctic sea ice…and so on). We can also note with respect to the troposphere, that the water vapour levels in the troposphere are increasing much as predicted by models [SEVEN], and alternative measures of tropospheric temperature that are not so affected by artifacts (not to mention incompetent mis-analysis; see above) give rather large warming trends (e.g. tropsopheric thermal wind measurements give maximum tropospheric temperature trends of 0.65 +/- 0.47 K per decade [EIGHT]). [ONE] B.J. Gary and S. J. Keihm (1991) Microwave Sounding Units and Global Warming Science 251, 316 (1991) [TWO] J. W. Hurrell & .K E. Trenberth (1997) Spurious trends in satellite MSU temperatures from merging different satellite record. Nature 386, 164 – 167. [THREE] F. J. Wentz and M. Schabel (1998) Effects of orbital decay on satellite-derived lower-tropospheric temperature trends. Nature 394, 661-664 [FOUR] Q. Fu et al. (2004) Contribution of stratospheric cooling to satellite-inferred tropospheric temperature trends Nature 429, 55-58. [FIVE] C. A. Mears and F. J. Wentz (2005) The Effect of Diurnal Correction on Satellite-Derived Lower Tropospheric Temperature, Science 1548-1551. [SIX] B. D. Santer et al. (2008) Consistency of modelled and observed temperature trends in the tropical troposphere. International Journal of Climatology 28, 1703 – 1722. [SEVEN] Soden BJ, et al (2005) The radiative signature of upper tropospheric moistening Science 310, 841-844; Santer BD et al. (2007) Identification of human-induced changes in atmospheric moisture content. Proc. Natl. Acad. Sci. USA 104, 15248-15253; Brogniez H and Pierrehumbert RT (2007) Intercomparison of tropical tropospheric humidity in GCMs with AMSU-B water vapor data. Geophys. Res. Lett. 34, art #L17912; Buehler SA (2008) An upper tropospheric humidity data set from operational satellite microwave data. J. Geophys. Res. 113, art #D14110; Gettelman A and Fu, Q. (2008) Observed and simulated upper-tropospheric water vapor feedback . J. Climate 21, 3282-3289 [EIGHT] R. J. Allen & S. C. Sherwood (2008) Warming maximum in the tropical upper troposphere deduced from thermal winds. Nature Geoscience 1, 399 – 403.
  15. The discovery that the Climate Science Community is uninformed on Dynamic System Theory and the ramifications thereof were presented at post 61. Their lack of understanding of Dynamic System Theory prevents them from recognizing that some important aspects of earth’s climate are easily determined; specifically that the imposition of significant net positive feedback in their GCMs is a mistake (other deficiencies regarding GCM use are listed at post 32). All of Chris’ comments and references should be considered in the context that they are uninformed in a relevant part of science and that they are unaware that they are uninformed. Chris presented an extensive diatribe (including several references) denigrating the UAH reporting of lower atmospheric temperature anomalies that were based on measurements made by satellite. The diatribe includes comments such as “incompetent disregard”, “UAH is a dodgy source” and “scandalous record”. Then Chris writes “The RSS tropospheric data is likely to be more robust.” The reader is invited to look at the RSS data set. It can be seen at http://www.ncdc.noaa.gov/oa/climate/research/rss_monthly_msu_amsu_channel_tlt_anomalies_land_and_ocean.txt . Doing the same analysis on the RSS data as was done on the UAH data shows that the AVERAGE GLOBAL TEMPERATURE for the first 9 months of 2008 is LOWER than the average from 2000 thru 2007 by an amount equal to 39.8% of the total linearized increase (NOAA temperature anomaly data) during the 20th century. Thus the RSS data corroborate the UAH data. It will be interesting to see what fault Chris now finds with the RSS data. Both the UAH and RSS data sets use satellite information which measures lower atmospheric temperature. The atmosphere has low thermal capacitance (ability to store heat) so it changes temperature comparatively quickly. The other sources: Hadley, http://www.cru.uea.ac.uk/cru/data/temperature/hadcrut3gl.txt, GISS, http://data.giss.nasa.gov/gistemp/tabledata/GLB.Ts+dSST.txt and NOAA, ftp://ftp.ncdc.noaa.gov/pub/data/anomalies/monthly.land_and_ocean.90S.90N.df_1901-2000mean.dat , report land, ocean and combined land-ocean measurements. The land-ocean measurements are weighted to account for the fact that there is much more ocean area than land area (and other factors) and are presented as average global temperature. Applying the same method to the global average surface temperatures (latest available) as was done for the atmospheric temperature results in (there is less decline because of the influence of higher thermal capacitance) 21.8% (9 mo), 20.0% (10 mo) and 14.4% (9 mo) for Hadley, GISS and NOAA respectively. Thus all agencies are consistent in reporting the recent temperature decline. But understanding global climate does not come from examining a period so brief as the last decade, or even the last century. Any assessment of climate change that limits itself to a period that is a recovery from the LIA (Little Ice Age) while ignoring the decline in temperature that occurred during the change from the Medieval Warm Period (aka Medieval Climate Optimum) to the LIA is at best incomplete. Be aware that the ONLY predictors of significant Anthropogenic Global Warming are Global Climate Models (aka General Circulation Models) or GCMs. The only existing exact, correct computer of global climate is the planet itself. One of the outputs of this computer is recorded as temperature history. Temperature history, to those with even a minimum understanding of Dynamic System Theory, proves that net positive feedback does not occur in global climate. Without significant net positive feedback the GCMs do not predict significant global warming. Chris talks about glacier shortening but ignores that the glaciers started shortening about a century BEFORE the beginning of increase of substantial fossil fuel use and continued to shorten at the same rate with absolutely no indication of any influence from increased atmospheric carbon dioxide. This contributes to the growing realization that the GCM based predictions are faulty. Incidentally, imagine what was happening to glacier length during the period from the Medieval Climate Optimum (that Mann tried to claim never happened) until the lowest temperatures of the Little Ice Age. No one can be sure where the average global temperature will go from here. According to Vostok ice core and other data it has been warmer than now at other times during the Holocene (the last 11,000 or so years) and other interglacial periods so eventual temporary further rise is not out of the question. However, the change in pattern since 2001, the recent downtrend, and continued quiet sun are all indicating that the planet is in for a continuation of the cooling trend. The huge thermal capacitance of the oceans will cause the cooling to be gradual, as was the warming. The real issue is not the climate. There is no objective evidence that human activity has ever had or ever will have any significant effect on it. The real issue is the damage to human freedom and prosperity that can happen because of a few government financed alarmists and their followers who are unaware of a relevant part of science. Record low temperatures and newsworthy rare or early snow falls are starting to get attention. Unfortunately, it may require a drastic decline of temperature with accompanying crop failure and wide spread starvation for many to begin to realize that they may be missing something.
  16. Oh dear. You're attempting to sell the unsubstantiated deceit that climate scientists don't understand feedbacks in relation to the earth's energy budget, and thus you can make a blanket dismissal of everything I present or every reference I cite. That's an excellent wheeze..you're entranced by the conceit that you are right and everyone else is wrong! Sadly, so far it's been easy to show that it is you that has glaring misconceptions on the science. Let's look at the essential errors in your post #67: 1. I pointed out that the UAH satellite data is rather dodgy, bedevilled as it is by a slew of errors yielding artefactual cooling trends (see references cited in post #66). The RSS data set is likely to be rather more accurate. Not very controversial I think. 2. I also pointed out that the tropospheric temperature measures are not particularly robust (they are broadly consistent with the land-sea surface record, but are not particularly well-constrained), and that while efforts are made to improve these, particularly in relation to calibrations, and taking account the relatively short time series (satellite measurements of tropospheric temperatures are available only from 1979), it makes more sense to consider the land-sea surface temperature measures if one wants to establish how our world is responding to enhanced greenhouse gas forcing (see references cited in post #66). Not very controversial either. 3. These (NASA GISS, Hadcrut, NOAA) show long warming trends from the mid 1970's through to the present. 4. You are choosing to make an analysis in which part of the land-sea surface 2008 data (the first 9 months) is compared to the 2000-2007 mean. But it doesn't make any sense in the context of greenhouse-forced warming trends, to compare single years (or parts of year) with anything. This should be obvious. Here’s why: 5. The land-sea surface records show a warming trend somewhere near 0.18-0.2 oC per decade over the last 30-ish years. Obviously, since year on year variations can result in short term drops or rises in the surface temperature by 0.1 oC (or even 0.2 oC if one considers the effects of the extraordinary El Nino year, 1998), one needs to consider trends over longish periods - looking at parts of single years is highly misleading, since there is rather a lot of “noise” on the temperature record. 6. Let's look for example at your cherrypicked early-mid 2008. The first 5-6 months of 2008 were strongly influenced by a La Nina episode that suppressed the surface temperature measurably. In addition the sun has reached the very bottom in its 11 year solar cycle and will only start to significantly supplement greenhouse warming in a couple of years. So we've had a short period when "cooling" phenomena have coincided. That's measured in the surface (and tropospheric) temperature records. Not a big surprise. 7. But of course if we're interested in how the Earth's surface temperature responds to enhanced greenhouse warming, we don't play at contrived wonderment that the surface temperature has cooled a bit due to fluctuations that happen to be in a cooling direction for several months. In another years or two the rise in the solar cycle will be supplementing the greenhouse enhanced forcing rather than opposing it as in the last few years. No doubt we’ll get the next record year at the next significant El Nino or two… Here's the other problems in your post: 1. Oddly, while you attempt to make an "argument" on the basis of a short 9 month period, you then proceed to attempt a completely contrary “argument” around the notion; [Dan Pangbourn: "But understanding global climate does not come from examining a period so brief as the last decade, or even the last century"]. A lovely cherrypicking of 9 months of data is fine though! The other problem with the "argument" that you attempt to develop from that, is that no-one has ignored the temperature changes during the past 1000 years. There's a reasonably good understanding of those (hint - it's the sun and volcanic activity that has resulted in small and slow changes in the earth's surface temperature during those periods). Note that the Earth's surface temperature "recovered" from the Little Ice Age by around the middle of the 19th century. I wonder whether you are trying to pretend that 20th century and contemporary warming is "recovery" from the LIA! 2. Be aware that the only predictors of significant Anthropogenic Global Warming are certainly NOT Global Climate Models or GCMs. What an odd notion to try to insinuate; what evidence lends to you consider such an ill-informed idea? The major predictor of Anthropogenic Global Warming is our understanding of the Earth's greenhouse effect and the physics/thermodynamics of the response of the earth's energy budget to enhanced greenhouse forcing. That's why (to give one of dozens of examples going pack to the mid 19th century), Wallace Broecker was able to predict in 1975 that the Earth’s global temperature would likely be warmer by the early 2000’s than at any period in the previous 1000 years. The evidence indicates he was right. [[b][/i]Broecker, WS (1975) “Climate Change: Are we on the brink of a pronounced global warming ? Science 189, 460-463[/i][/b]] Broecker didn’t have a GCM at hand (and nether did John Tyndall in the mid 19th century nor Arrhenius in the late 19th century and so on, each of whom understood that atmospheric CO2 contributed to the Earth’s enhanced temperature above its “black body” temperature and the effects of enhancing greenhouse gas forcings). You seem to have a severe misconception of the scope of GCM’s and their use in relation to understanding the evolution of the climate in a warming world, its spatial distribution and consequent effects (rainfall patterns, heat transfer by air and ocean currents and so on). So let’s not pretend that anthropogenic global warming arises magically from climate models. We’ve known about global warming in response to anthropogenic enhancement of the earth’s greenhouse effect for over 100 years. 3. There isn’t any data from the Vostok core that indicates “its been warmer than now at other times during the Holocene”. Unless by “it” you mean Vostok. One location does not a global temperature make. 4. It does seem to have been a tad warmer during the last interglacial period particularly around 130,000 to 125,000-ish years ago. Unfortunately sea levels were around 4 metres higher then than now as a result. That’s one of the many reasons we don’t want to push temperatures up much further. 5. What “quiet sun”? The present minimum which is opposing enhanced greenhouse-induced warming will in a year or two begin to “supplement” this. Getting excited about the low point in the rather regular 11 year sinusoidal variation in the solar output is nonsense. And your repeated misconception about feedbacks: 6. Despite agreeing that enhanced CO2 results in enhanced greenhouse forcing with resultant atmospheric warming that yields a water vapour feedback, and the abundant evidence that the Earth responds to enhanced atmospheric CO2 concentrations with a warming encompassing a net positive feedback that yields a surface temperature near 3 oC, you still assert with zero substantiation that net positive feedbacks don’t exist. I wonder when you’re going to provide any evidence in support of that assertion other than “I know I’m right and everyone else is wong”! I explained some of the essential features of feedbacks in post #64. Your response was to parrot your mantra (paraphrasing) “I’m right and everyone else is wrong”. Some argument!.....
  17. Radiated energy (from all surfaces, including earths) varies as the fourth power of absolute temperature so a temperature down trend is insufficient to prove that net positive feedback does not exist. My bad to have overlooked this before. However, review of temperature during the last and previous glacial periods reveals that the temperature changed from an uptrend to a down trend with the atmospheric carbon dioxide level higher during the down trend than it had been during the uptrend. That could not happen if atmospheric carbon dioxide level increase was a significant driver of average global temperature increase. The present atmospheric carbon dioxide level is somewhat higher than it was during the glacial periods. As Carbon dioxide level increases, each additional increment has less influence than the previous increment. This effect is appropriately called saturation. Thus increased atmospheric carbon dioxide now is even less able to influence temperature than it was during the last glacial period when temperature increasing trend changed to a decreasing trend. The conclusion from all this is that the current rising atmospheric carbon dioxide did not have a significant influence on any temperature rise including the temperature rise from the mid 1970s until about a decade ago and will never be a significant factor in temperature increase. Contrary to Chris’ assertion which was “The major predictor of Anthropogenic Global Warming is our understanding of the greenhouse effect …” the discovery long ago that carbon dioxide and water vapor absorb certain wavelengths of infrared radiation does not mandate that human activity has caused the planet to get significantly warmer. It is pretty widely known that the infrared absorption, mainly by water vapor, helps make the planet have the nominal temperature that it does. It is less widely known that the absorption takes place close to the emitting surface (half within 24 meters as calculated from Barrett’s paper at http://www.warwickhughes.com/papers/barrett_ee05.pdf , others calculate even closer). Adding carbon dioxide to the atmosphere results in the infrared radiation being absorbed a bit closer to the emitting surface. The atoms that absorb the infrared radiation energy nearly all immediately share it by thermal conduction with the much more abundant adjacent atoms that are transparent to infrared radiation. That, for the most part, is what warms the air. The shared energy is then carried up by convection currents. Existing GCMs are unable to objectively account for this natural convection so the process is imposed on the models with a contrived parameterization. Contrary to one of many of Chris’ erroneous assertions, that I have stated that “I am right and everyone else is wrong”, I share the perception with over 31,000 other scientists and engineers at http://www.petitionproject.org/ that human release of carbon dioxide will not cause catastrophic global warming. These scientists and engineers gain nothing for this declaration while the 2500 or so alarmist climatologists must make dire predictions for the government grants to continue.
  18. Just another modelling error: Global Warming Predictions Are Overestimated, Suggests Study On Black Carbon ScienceDaily (Nov. 19, 2008) — A detailed analysis of black carbon -- the residue of burned organic matter -- in computer climate models suggests that those models may be overestimating global warming predictions.
  19. chris Just a small point re: "3. These (NASA GISS, Hadcrut, NOAA) show long warming trends from the mid 1970's through to the present." In reality only GISS actually shows a slight increase, the others are actually slightly negetive.
  20. chris disregard that - I misread your statement. I was referring to the last 10 years while you referred to the entire length of the last PDO.
  21. Re #69 Dan O.K., so you've finally come round to the truism that a downtrend in temperature is not proof that a net positive feedback doesn't exist, after all. So everyone else but you wasn't wrong! Your bad indeed. But we got there in the end... Your second paragraph is illogical. We all know that the Earth's equilibrium temperature response has a logarithmic relationship to the atmospheric CO2 concentration. Arrhenius had worked that out already over 100 years ago. Your third and fourth paragraphs are nonsense too. Why go to a non-science magazine created with the intention (as the Editor admits) of misrepresenting the science on power industry-related matters? We've already seen (see posts #54 and #58) that "articles" in that magazine on climate-related matters are dodgy. Not surprisingly, the author of that article has got it wrong. There are lots of errors: (i) absorption of EM radiation doesn't "take place close to the surface". Photons can travel vast distances before being "absorbed". It depends on the absorbtivity/transmisivity of the medium through which the photons pass. (ii) If one considers longwave IR emitted from the Earth's surface, the wavelength/energy of the emitted wavelength has to be considered, since the absorption coefficient (k) is inversely related to the wavelength of the absorption band. The transmisivity, t, (absorbtivity = 1-transmisivity) of a column of air = t = e^(-k*p*l) where k is the absorption coefficient, p is the partial pressure and l is the path length. since the absorption coefficients for the absorption bands of the greenhouse gases are known[1], we can calculate the pathlength required to effectively absorb all of the radiation (at that energy/wavelength). For 99% absorption, the pathlength of the 4-5 micron absorption band of CO2 is 625 metres at current atmospheric CO2 concentrations and for the ~14-20 micron absorption band, CO2 at 385 ppm is still unsaturated at 7,800 metres of altitude. likewise for the 12-20 micron infrared absorption band of water at 0.4%, water vapour is still absorbing at 1,700 metres. (iii) in other words at current atmospheric greenhouse gas concentrations, the absorption bands aren't saturated, and enhancement of the concentration of greenhouse gases, particularly at higher altitudes [see (iv)], is effective in trapping more of the longwave IR emitted from the Earth's surface. (iv) In any case, the altitude of absorption of IR emitted from the Earth’s surface isn’t that important. A key element of the greenhouse effect is the altitude of emission of longwave IR into space. This has to happen for radiative balance between incoming radiation and outward radiation. You’ve actually given a clue to an important consideration unwittingly in the very first statement of your post: [Dan “bad boy” Pangbourn: “Radiated energy (from all surfaces, including earths) varies as the fourth power of absolute temperature”] Exactly so. As greenhouse gases are added to the Earth’s atmosphere, the radiation of IR into space is suppressed at any altitude (especially altitudes far from the Earth’s surface). So the radiation emitted to space from (say) 5 km is suppressed by enhanced CO2 concentrations, and so the altitude of mean radiation to space is increased. Since an increased altitude in the troposphere is at a lower temperature, the efficiency of radiation to space is decreased (as you said yourself). What’s the effect of this? The troposphere must warm in order to restore radiative balance. Since the surface and troposphere are strongly coupled, the warming of the troposphere is transmitted to the earth’s surface (and vice versa) [2]. (v) The article in the anti-science journal that you linked to makes three more errors that relate to ignoring real world measurements. These are: (i) on page 1044 your ill-informed author states: “It would be expected that more CO2 would have a greater effect on atmospheric warming at higher altitudes, but that seems not to be occurring in spite of the predictions of most GCMs”. But as we’ve seen already on this thread, the tropsopheric warming is quite consistent with GCMs (see my posts #60 and #66, where this exact issue is addressed). (ii) on page 1045 your ill-informed author states: “The GCMs take feedbacks into account, such as the supposed positive feedback from extra warming caused by the radiation by extra water vapour”. Yes, exactly. In line with the enhanced tropsopheric warming caused by enhanced [CO2], the troposphere is accumulating extra water vapour rather in line with predictions [3-7]. According to your ill-informed author this shouldn’t be happening since adding extra greenhouse gases isn’t (according to him) supposed to make the troposphere warmer! (iii) and overall your ill-informed author neglects to state that we can measure in the real world, not only the longwave radiation transmitted down to the Earth’s surface from the troposphere (which shouldn't be happening according to your ill-informed author), but the enhancement of this radiation due to the enhanced greenhouse gas concentrations of the last 30 years (which also shouldn't be happening according to yuor ill-informed author), or the reduction in this radiation outwards to space [8-12] ---------------------------------------- [1] this has been known for decades. See e.g RM Goody and GD Robinson (1951) Quart. J. Roy. Meteor. Soc. 77, 153 [2] Shine, KP (1995) Spectrochimica Acta A 51, 1393-4. [3] Santer BD et al. (2007) Identification of human-induced changes in atmospheric moisture content. Proc. Natl. Acad. Sci. USA 104, 15248-15253 [4] Soden BJ, et al (2005) The radiative signature of upper tropospheric moistening. Science 310, 841-844. [5] Buehler SA (2008) An upper tropospheric humidity data set from operational satellite microwave data. J. Geophys. Res. 113, art #D14110 [6] Brogniez H and Pierrehumbert RT (2007) Intercomparison of tropical tropospheric humidity in GCMs with AMSU-B water vapor data. Geophys. Res. Lett. 34, art #L17912 [7] Gettelman A and Fu, Q. (2008) Observed and simulated upper-tropospheric water vapor feedback. J. Climate 21, 3282-3289 [8] Harries JE et al (2001) Increases in greenhouse forcing inferred from the outgoing longwave radiation spectra of the Earth in 1970 and 1997. Nature 410, 335-337. [9] Worden HM et al. (2008) Satellite measurements of the clear-sky greenhouse effect from tropospheric ozone. Nature Geoscience 1, 305-8. [10] Philipona R et al (2004) Radiative forcing - measured at Earth's surface corroborate the increasing greenhouse effect. Geophys. Res. Lett. 31, art # L03202. [11] Wild M et al. (2008) Decadal changes in surface radiative fluxes and their role in global climate change Adv. Global Change Res. 33 , 155-167. [12] Philipona R et al (2005) Anthropogenic greenhouse forcing and strong water vapor feedback increase temperature in Europe Geophys. Res. Lett. 32, art # L19809. etc. etc. etc. etc……
  22. Re #70 I wouldn't really say that's a modelling error Quietman. Have a read of the original article in Nature Geosciences. A very small amount of carbon from inefficient burning of fossil fuels (that isn't captured in catalytic converters!), or from forest fires under oxygen-deficiency, or from people that use inefficient wood-burning stoves in the less-developed world, may be retained in the soil for long periods, and thus the amount released into the atmosphere may be reduced somewhat. Remember that no one expects the GCM models to be perfect. We know that they're not. That's not really the point of modelling. We know already from basic atmospheric physics and from numerous studies of the real world that the Earth responds to enhanced greenhouse gases with a warming somewhere of the order of 3 oC per doubling of atmospheric CO2. That's completely independent of models. The models help us to predict the spatial distribution of this warming, its effects under different emission scenarios and such like. As new information is obtained about contributions and their paramaterization, so the models are iteratively improved. So the work just published in Nature Geoscience will be explored further no doubt, and when it's sufficiently characterized/parameterized will be incorporated into the models... ..that's how science works!
  23. During the last and previous glacial periods the temperature changed from an uptrend to a down trend with the atmospheric carbon dioxide level higher during the down trend than it had been during the uptrend. That could not happen if there was significant net positive feedback and proves that significant net positive feedback does not exist. Without the imposition of substantial net positive feedback the GCMs do not predict significant global warming.
  24. Come on Dan. You provided your own answer to that illogical mantra in your first paragraph of your post #69: [Dan ".....a temperature down trend is insufficient to prove that net positive feedback does not exist. My bad to have overlooked this before."] You were right in your post #69. Why change your mind again??
  25. Post #75 was a repeat of the statement in #69 that followed the statement quoted in #76. It is unclear why you did not appear to notice this before and now do not seem to be able to see the difference between the two statements.

Prev  1  2  3  4  5  6  Next

Post a Comment

Political, off-topic or ad hominem comments will be deleted. Comments Policy...

You need to be logged in to post a comment. Login via the left margin or if you're new, register here.

Link to this page


The Consensus Project Website

THE ESCALATOR

(free to republish)


© Copyright 2024 John Cook
Home | Translations | About Us | Privacy | Contact Us