


 Arguments


Betting against global warming is a sure way to lose money
Posted on 8 December 2015 by dana1981
In 2008, a paper was published in the journal Nature predicting that global surface temperatures would cool slightly in the years 2005–2015 as compared to 1994–2004. The authors of that paper thought that during that time, the cool phase of natural ocean cycles would be enough to more than offset warming from the increased greenhouse effect, before human-caused global warming caught up again thereafter. At the time, the paper and its cooling prediction received a tremendous amount of media attention.
There was some truth to the prediction. From about 1999 to 2012, there weremore La Niña than El Niño events, with the former having a short-term cooling influence on global surface temperatures, and the latter having a short-term warming effect. So, it’s true that natural ocean cycles had a temporary cooling effect during that time period.
But, the authors of the paper predicted that global surface temperatures would fall. The climate scientists who blog at RealClimate were so confident that temperatures would continue to rise that they offered the authors a bet.
If the average temperature 2000-2010 (their first forecast) really turns out to be lower or equal to the average temperature 1994-2004, we will pay them € 2500. If it turns out to be warmer, they pay us € 2500. This bet will be decided by the end of 2010. We offer the same for their second forecast: If 2005-2015 turns out to be colder or equal compared to 1994-2004, we will pay them € 2500 – if it turns out to be warmer, they pay us the same.
The authors of the paper declined to accept the bet, which was a good decision, because it turns out they would have lost. Despite the temporary cooling influence of natural ocean cycles and low solar activity since 1999, temperatures have continued to rise due to the strength of the increased greenhouse effect. They have risen more slowly than they would have otherwise, but temperatures have continued to rise nevertheless. As the climate scientists at RealClimatewrote,
It is clear that prediction of global cooling or even stasis was way off the mark, with global warming continuing and observations running more than 0.15ºC warmer than the Keenlyside et al forecast … Had our bet been accepted, it is clear we would have won unambiguously.
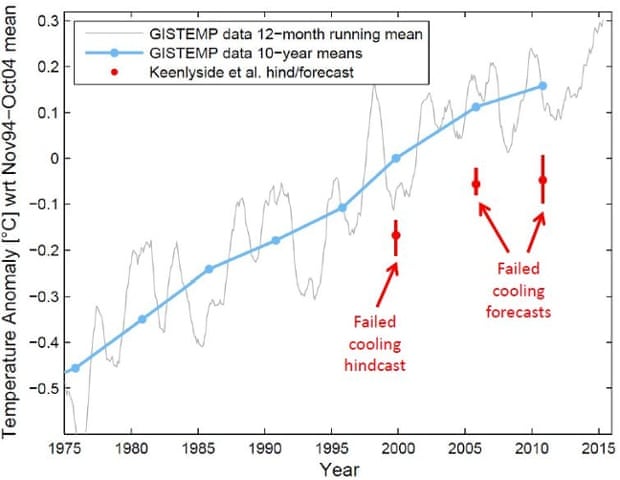
Observed global surface temperature data from NASA GISS (gray) and 10-year averages (blue) vs. Keenlyside et al. (2008) cooling predictions. Illustration from RealClimate.org.
One might ask, is it ever again going to be smart to bet against global warming? A paper published earlier this year in the Royal Society journal Philosophical Transactions A asked that very question. The authors looked at the global surface temperature data and considered whether for each 15-year period, a bet of warming or cooling as compared to the previous 15-year average would have won.
The results, shown in the figure below, are strongly influenced by natural climate cycles. Betting on global surface cooling would have usually been a winner in 1880–1910 and 1950–1965. Wagering on global surface warming would have won the bet ever year from 1910 to 1940, and every year since 1970.
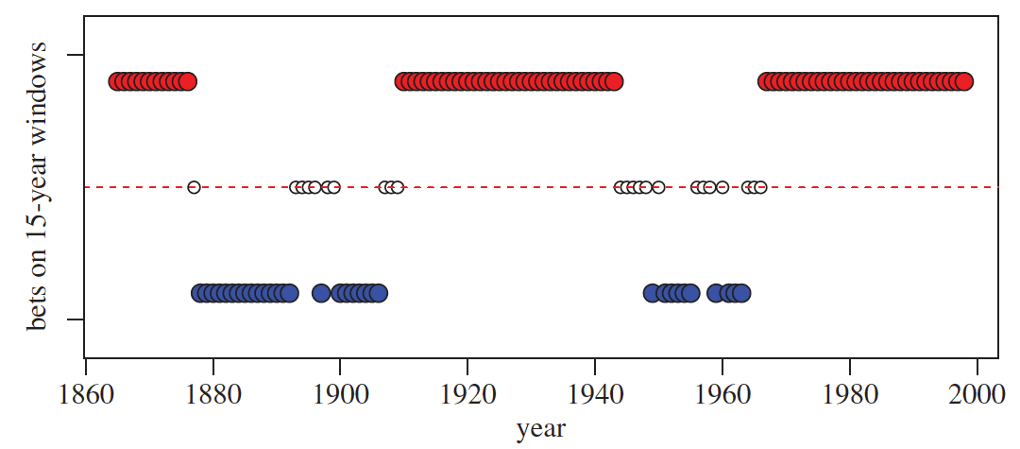
Results bets that the 15-year average global surface temperature would increase (red dots), decrease (blue dots) or stay about the same (white dots) from the previous 15-year mean. Figure from Risbey et al. (2015). Source: Philosophical Transactions A.
The authors of the paper note it’s particularly interesting that global warming keeps winning the bet despite ocean cycles, solar activity, and human aerosol pollution all acting in the cooling direction over the past 15 years. Human-caused global warming has become so strong that it’s consistently overcoming these natural short-term cooling factors.
The shift in odds to favour warming changes reflects the growing greenhouse contribution to 15-year trends. The greenhouse contribution is now about the same magnitude as typical naturally occurring 15-year trends … While it is still possible to get negative 15-year changes that will rely on large amplitude and less frequent natural triggers of 15-year changes such as large volcanoes or large amplitude negative [ocean cycle] events.
In other words, betting against global warming is an almost sure way to lose money at this point. As I document in my book Climatology versus Pseudoscience, contrarians rarely predict global temperature changes, but those who do usually predict cooling, and their predictions have performed terribly. Much worse than global warming projections from mainstream climate models.


To forestall any criticism, let me say upfront I don't believe alterations to temperature records have been made solely to hide a "hiatus" or "pause "or exaggerate a warming trend. A question-was the bet based on temperature calculations from satellite measurement or ground station observations? In view of the adjustments that have been made to temperature readings for whatever reason, it is probably a good thing the bet was not made. Adjustments to temperature records which did occur after the bet had been suggested, would and quite rightly should, have raised doubts in all of those placing the bet whatever the temperature trend showed. A bit like having a bet on a horse only to find finding the track had been altered after the bet had been placed but before the race had been run.
Fortunately GISS still distribute the ERSSTv3b grids, and the software to blend them into a land-ocean record. They're at the bottom of this page. Look for the link labelled "Sea surface air temperature (ERSSTv3b), previously used". So we can easily find out whether the bet would also have been won with the old GISTEMP.
I've got the calculations running now.
Let's hope "the bet" outcome will not be much different, for old versus new, on the Cowtan Totalisator.
I'm expecting that the [Ryland] horse racetrack length will have suffered only a few metres' alteration in toto, over the years. Not enough to worry any genuine punter, anyway.
Plus, we have already witnessed the cumulative race results in recent decades . . . and the stewards have confirmed the results :- It's getting warmer. No pawse, just hoofbeats ~ and let's pray it is not the biblical four horse race :-)
OK, here are the results using both the previous SST dataset (ERSSTv3b), and the one before that (HadR2):
1994-2004 2000-2010 2004-2015
ERSSTv3b 0.492 0.591 0.619
HadR2 0.458 0.557 0.589
SkS 0.451 0.553 0.587
I took the dates from the RC post, which claims they are decadal. However the last period seems to be an unusual 11-year decade.
If you want to go further the next step would be to use the SkS temperature calculator to calculate a pure unadjusted record from HadSST3-unadjusted and GHCN-unadjusted. That way we can ensure that no changes in adjustment or calculation method play a role. I've listed those in the final row of the table.
I'm not endorsing those numbers - Zeke and I have already provided two independent analyses supporting the existence of a cool bias in the SSTs over the period. They should therefore be treated as a lower bound on the warming over that period.
With respect to ryland's comment, looking at Cowtan's temperature plotter and the RSS data since 1994, it is slightly possible that the Real Climate folk would have won that bet as well. Remember the bet was1. 2000-2010 >= 1994-2004 and
2. 2005-2015 >= 1994-2004
While it is certainly true some (like Ted Cruz) can point to RSS data and say "no warming" the past 18 years, even RSS clearly shows "no cooling" as well, certainly since 1994. The El Nino years in 2010 and present certainly balance the massive one in 1998 and the period 2001 to 2007 works to the advantage of the Real Climate folk.
So far as Ryland's altered horse track comment, note that RSS does not seem to publish version numbers, but I would be surprised if their methods have been locked in stone since 1994. UAH on the other hand is far more open. Their version 5.6 was much more in agreement with the surface data sets, but version 6.0 moved its data significantly in the direction of RSS data. THAT as well is an altered horse track.
Knaugle, using WoodforTrees, the relevant means for RSS are:
1994-2004: 0.196
2000-2010: 0.225
2004-Current: 0.239
2005-Curent: 0.242
I have included the last as a better approximation to a decadal value.
In any event, with RSS it remains a clear win for the 'warmists', although the margins are not as large.
As an aside, the bet was that each period would be warmer, with a payout to Keenlyside et al if temperatures were tied (had they taken the bet).
As is so often the case with ryland's comments, he adopts a position that retains its reasonableness only by scrupulously not looking at the data. If you play unfair and look at the data, you find all he is left with is empty rhetoric.
Tom Curtis. You clearly never have heard the phrase "perception is reality." The point I'm making has nothing at all to do with the data per se but only to the perceptions of "foul play" that alterations to the data might have caused. I hope I have now made that clear to you. And I'm not saying or even insinuating there was any foul play. As the altered data showed warming the cool bettor could be suspicious of the result and had it shown cooling the warm bettots might have had their suspicions.
@5 I'm not sure that anyone answered my original query if the bet was based on ground or satellite based readings but satellite doesn't UAH 6 show a decrease in the temperature trend since 1998? Even though other data sets showed warming that UAH data could have lead the cool bettors to suggest that the bet should be annulled
The prediction about cooling that bet was based on, was for modelling of global surface temperatures. The appropriate data set to compare against the model prediction is GISS. Satellites attempt to measure measure lower troposphere (lower 4-6 km) temperatures. Besides the usual issues with satellite measurements, the troposphere is much more sensitive to ENSO variations than surface temperatures.
The precise nature of the prediction was that: "over the next decade, the current Atlantic meridional overturning circulation will weaken to its long-term mean; moreover, North Atlantic SST and European and North American surface temperatures will cool slightly, whereas tropical Pacific SST will remain almost unchanged." The slow rate of warming in satellite records is due largely to preponderance of La Nina pattern in pacific.
ryland @8:
UAH tlt v6.0 beta4:
1994-2004 0.094
2000-2010 0.105
2004-current 0.129
In fact the realclimate article offering the bet states:
HadCRUT3v
1994-2004 0.337
2000-2010 0.411
2004-2014 0.422
Basicaly it does not matter which surface dataset, or satellite tlt dataset you use - the bet would have been lost by Keenlyside et al. And the payout, if the bet were accepted, would not have been based on "perception" but reality - the reality of the HadCRUT3 dataset which has not been adjusted.
And, speaking of which, Ryland @7, I would believe you are just raising concerns about perception if there was even the slightest evidence that you dispelled false perceptions in favour of reality on this or any other website. If you do, I certainly have not seen that evidence. Rather, you appear to want to use a perception as a cloak against reality - repeatedly.
I don' t comment on any other website so anything you see elsewhere under ryland is not from me. And as for you not seeing "the slightest evidence" it may be that you don't always/refuse to recognise what you are seeing.
Spencer's write-up on UAH6.0beta notes that the peak sensitivity of 6.0 is at about 4km altitude, compared to about 2km for 5.6.
I've done a little analysis of v6.0 from the perspective of using it to infill surface temperatures. My (so far unpublished) results show that, as you would probably expect, UAH6.0beta shows both lower spatial correlation and slightly less temporal correlation with surface temperature than v5.6. That's not to say v6.0 is wrong - it may be a better measure of temperature in the mid troposphere. However it is, both in theory and practice, less useful than v5.6 as a proxy for surface temperature.
@2, 4, 9, 12 Thanks Kevin C and scaddenp for the time taken and the civil and informative responses to a couple of my questions. Such responses here are both rare and a pleasant surprise.
From the graphs presented by Spencer in his write-up, the UAHv0.6beta sensitivity averages to an altitude of 4,500m while the UAHv5.6 averages to 3,400m. Using their version of such graphs, RSS averages to 4,200m.
Yes, the weighted averages are less different than the peaks.
What difference does it make? We can take a look at a reanalysis - in this case ERA-interim. Ideally we'd look at the weighted mean of the pressure levels, but for now I've just looked at the 700mb (3km) and 500mb (5.5km) levels. For the period 1998-2014 I get a trend of 0.08C/decade for the 700mb level and 0.04C/decade for the 500mb level (quick calculation without checks).
However the difference in trend between the two levels is reversed for the period before 1998. That's consistent with the behavour of the difference between UAH v6.0 and v5.6. I haven't looked at the magnitude of the difference, but it could be that most of the difference between v5.6 and v6.0 is explained by the difference in the height sampling profile.
That's an interesting project for someone to take on.
I don't know if this is relavent, Kevin, but isn't that 500-700mb altitude right around the base of where we should be detecting the tropospheric hotspot?
Would it make sense that that region of the atmosphere would be heavily influenced by the ENSO cycle, so that over a period dominated by la Nina we might actually expect to see less of a trend over the time frames being discussed?
I think it may be highly relevent. So a second line of attack would be to try removing the ENSO signal from the temperatures at the different pressure levels.
There are lots of pointers to there being interesting science to be done here. Unfortunately I can't take it on this time!
ryland @8,
I'd be surprised if UAH v6.0 shows a statistically significant decrease in trend although its best estimate is indeed lower. However, in order to get these "slowdown" trends you have to allow for magical "jumps" in termperature just before the proposed slowdown. This is a result of the long-term global warming trend and the Escalator shows the principle behind it. Tamino has also posted about this, showing that claims of a slowdown require magical non-physical temperature jumps just before your desired slowdown.
So even if you pick some of the data to make the trend look smaller, your period is going to be warmer than the previous one because you've still stepped up in temperatures.
Of course, this is not obvious in most presentations that claim a slowdown because the presenters typically choose to hide the earlier data.
Mark R @18.
UAH TLT v6.0 is flat 1998-to-date but has a positive trend 1999-to-date.
Regarding the difference between v6.0 & v5.6, you can also include the difference between them & RSS and with surface measurements like HadCRUT4.
Although there has been a lot of talk of UAHv5.6 showing less warming that the surface measurements, if you ignore the first 5 years of UAHv5.6, the trend is indistinguishable - UAH 0.175ºC/decade against HadCRUT 0.178ºC/decade.
The difference in trend between UAH TLT v6.0 and v5.6 is large with RSS sitting in between. (See rolling-average graph two clicks down here) The profile of v6.0-RSS shows many of the same features as v5.6-v6.0 but with v5.6 the difference in trend greater plus and there is a big bulge centred on 1998. Given the ziggy-wobbles in HadCRUT-v6.0 appear concurrent with El Chichon & Pinatuba, plus the big bulge sort of makes sense with a similar timing, I do wonder if the effect resulting from that extra 1,000m of altitude between average v6.0 and average v5.6 could have a lot to do with aerosol/cloud.
@1, are you saying tools don't need adjusting?
Why aren't we all still driving model t's around??
It is interesting that the discussion is very specific about UAH, ver 5.6 or 6.0, yet RSS is at version 3.3 and nearly every source I read in the public literature is silent on this. The point remains that it seems many politicos, like Sens. Cruz & Inhofe, argue that when the surface datasets make revisions, they are cheating. Yet when the satellite data is modified, they are silent, and that is just the normal course of science?
I've found it fascinating - over the last five years the deniers have in turn focused on HadCRUT3, then UAH, and now RSS in sequence. Moving to whatever temperature record showed the least warming over recent years, and jumping ship whenever that record reversed variability and warmed faster, or received an update that took it off the bottom of the list.
Cherry picking in the extreme.
"In 2008, a paper was published in the journal Nature predicting that global surface temperatures would cool slightly in the years 2005–2015 as compared to 1994–2004."
Not quite what it says in the abstract (which is all I can see):
"Our results suggest that global surface temperature may not increase over the next decade, ..."
JohnSeers @23, From Keenlyside et al:
And here is the relevant figure 4:
Note, the prediction (greenline) is that the decadal average starting Nov 2000 will be "slightly" cooler than the observed 1994-2004 levels on HadCRUT3 (redline), not their hindcast values (greenline) which are lower.